Quantum Rotational Field MappingQuantum Rotational Field Mapping (QRFM):
Phase Coherence Detection Through Complex-Plane Oscillator Analysis
Quantum Rotational Field Mapping applies complex-plane mathematics and phase-space analysis to oscillator ensembles, identifying high-probability trend ignition points by measuring when multiple independent oscillators achieve phase coherence. Unlike traditional multi-oscillator approaches that simply stack indicators or use boolean AND/OR logic, this system converts each oscillator into a rotating phasor (vector) in the complex plane and calculates the Coherence Index (CI) —a mathematical measure of how tightly aligned the ensemble has become—then generates signals only when alignment, phase direction, and pairwise entanglement all converge.
The indicator combines three mathematical frameworks: phasor representation using analytic signal theory to extract phase and amplitude from each oscillator, coherence measurement using vector summation in the complex plane to quantify group alignment, and entanglement analysis that calculates pairwise phase agreement across all oscillator combinations. This creates a multi-dimensional confirmation system that distinguishes between random oscillator noise and genuine regime transitions.
What Makes This Original
Complex-Plane Phasor Framework
This indicator implements classical signal processing mathematics adapted for market oscillators. Each oscillator—whether RSI, MACD, Stochastic, CCI, Williams %R, MFI, ROC, or TSI—is first normalized to a common scale, then converted into a complex-plane representation using an in-phase (I) and quadrature (Q) component. The in-phase component is the oscillator value itself, while the quadrature component is calculated as the first difference (derivative proxy), creating a velocity-aware representation.
From these components, the system extracts:
Phase (φ) : Calculated as φ = atan2(Q, I), representing the oscillator's position in its cycle (mapped to -180° to +180°)
Amplitude (A) : Calculated as A = √(I² + Q²), representing the oscillator's strength or conviction
This mathematical approach is fundamentally different from simply reading oscillator values. A phasor captures both where an oscillator is in its cycle (phase angle) and how strongly it's expressing that position (amplitude). Two oscillators can have the same value but be in opposite phases of their cycles—traditional analysis would see them as identical, while QRFM sees them as 180° out of phase (contradictory).
Coherence Index Calculation
The core innovation is the Coherence Index (CI) , borrowed from physics and signal processing. When you have N oscillators, each with phase φₙ, you can represent each as a unit vector in the complex plane: e^(iφₙ) = cos(φₙ) + i·sin(φₙ).
The CI measures what happens when you sum all these vectors:
Resultant Vector : R = Σ e^(iφₙ) = Σ cos(φₙ) + i·Σ sin(φₙ)
Coherence Index : CI = |R| / N
Where |R| is the magnitude of the resultant vector and N is the number of active oscillators.
The CI ranges from 0 to 1:
CI = 1.0 : Perfect coherence—all oscillators have identical phase angles, vectors point in the same direction, creating maximum constructive interference
CI = 0.0 : Complete decoherence—oscillators are randomly distributed around the circle, vectors cancel out through destructive interference
0 < CI < 1 : Partial alignment—some clustering with some scatter
This is not a simple average or correlation. The CI captures phase synchronization across the entire ensemble simultaneously. When oscillators phase-lock (align their cycles), the CI spikes regardless of their individual values. This makes it sensitive to regime transitions that traditional indicators miss.
Dominant Phase and Direction Detection
Beyond measuring alignment strength, the system calculates the dominant phase of the ensemble—the direction the resultant vector points:
Dominant Phase : φ_dom = atan2(Σ sin(φₙ), Σ cos(φₙ))
This gives the "average direction" of all oscillator phases, mapped to -180° to +180°:
+90° to -90° (right half-plane): Bullish phase dominance
+90° to +180° or -90° to -180° (left half-plane): Bearish phase dominance
The combination of CI magnitude (coherence strength) and dominant phase angle (directional bias) creates a two-dimensional signal space. High CI alone is insufficient—you need high CI plus dominant phase pointing in a tradeable direction. This dual requirement is what separates QRFM from simple oscillator averaging.
Entanglement Matrix and Pairwise Coherence
While the CI measures global alignment, the entanglement matrix measures local pairwise relationships. For every pair of oscillators (i, j), the system calculates:
E(i,j) = |cos(φᵢ - φⱼ)|
This represents the phase agreement between oscillators i and j:
E = 1.0 : Oscillators are in-phase (0° or 360° apart)
E = 0.0 : Oscillators are in quadrature (90° apart, orthogonal)
E between 0 and 1 : Varying degrees of alignment
The system counts how many oscillator pairs exceed a user-defined entanglement threshold (e.g., 0.7). This entangled pairs count serves as a confirmation filter: signals require not just high global CI, but also a minimum number of strong pairwise agreements. This prevents false ignitions where CI is high but driven by only two oscillators while the rest remain scattered.
The entanglement matrix creates an N×N symmetric matrix that can be visualized as a web—when many cells are bright (high E values), the ensemble is highly interconnected. When cells are dark, oscillators are moving independently.
Phase-Lock Tolerance Mechanism
A complementary confirmation layer is the phase-lock detector . This calculates the maximum phase spread across all oscillators:
For all pairs (i,j), compute angular distance: Δφ = |φᵢ - φⱼ|, wrapping at 180°
Max Spread = maximum Δφ across all pairs
If max spread < user threshold (e.g., 35°), the ensemble is considered phase-locked —all oscillators are within a narrow angular band.
This differs from entanglement: entanglement measures pairwise cosine similarity (magnitude of alignment), while phase-lock measures maximum angular deviation (tightness of clustering). Both must be satisfied for the highest-conviction signals.
Multi-Layer Visual Architecture
QRFM includes six visual components that represent the same underlying mathematics from different perspectives:
Circular Orbit Plot : A polar coordinate grid showing each oscillator as a vector from origin to perimeter. Angle = phase, radius = amplitude. This is a real-time snapshot of the complex plane. When vectors converge (point in similar directions), coherence is high. When scattered randomly, coherence is low. Users can see phase alignment forming before CI numerically confirms it.
Phase-Time Heat Map : A 2D matrix with rows = oscillators and columns = time bins. Each cell is colored by the oscillator's phase at that time (using a gradient where color hue maps to angle). Horizontal color bands indicate sustained phase alignment over time. Vertical color bands show moments when all oscillators shared the same phase (ignition points). This provides historical pattern recognition.
Entanglement Web Matrix : An N×N grid showing E(i,j) for all pairs. Cells are colored by entanglement strength—bright yellow/gold for high E, dark gray for low E. This reveals which oscillators are driving coherence and which are lagging. For example, if RSI and MACD show high E but Stochastic shows low E with everything, Stochastic is the outlier.
Quantum Field Cloud : A background color overlay on the price chart. Color (green = bullish, red = bearish) is determined by dominant phase. Opacity is determined by CI—high CI creates dense, opaque cloud; low CI creates faint, nearly invisible cloud. This gives an atmospheric "feel" for regime strength without looking at numbers.
Phase Spiral : A smoothed plot of dominant phase over recent history, displayed as a curve that wraps around price. When the spiral is tight and rotating steadily, the ensemble is in coherent rotation (trending). When the spiral is loose or erratic, coherence is breaking down.
Dashboard : A table showing real-time metrics: CI (as percentage), dominant phase (in degrees with directional arrow), field strength (CI × average amplitude), entangled pairs count, phase-lock status (locked/unlocked), quantum state classification ("Ignition", "Coherent", "Collapse", "Chaos"), and collapse risk (recent CI change normalized to 0-100%).
Each component is independently toggleable, allowing users to customize their workspace. The orbit plot is the most essential—it provides intuitive, visual feedback on phase alignment that no numerical dashboard can match.
Core Components and How They Work Together
1. Oscillator Normalization Engine
The foundation is creating a common measurement scale. QRFM supports eight oscillators:
RSI : Normalized from to using overbought/oversold levels (70, 30) as anchors
MACD Histogram : Normalized by dividing by rolling standard deviation, then clamped to
Stochastic %K : Normalized from using (80, 20) anchors
CCI : Divided by 200 (typical extreme level), clamped to
Williams %R : Normalized from using (-20, -80) anchors
MFI : Normalized from using (80, 20) anchors
ROC : Divided by 10, clamped to
TSI : Divided by 50, clamped to
Each oscillator can be individually enabled/disabled. Only active oscillators contribute to phase calculations. The normalization removes scale differences—a reading of +0.8 means "strongly bullish" regardless of whether it came from RSI or TSI.
2. Analytic Signal Construction
For each active oscillator at each bar, the system constructs the analytic signal:
In-Phase (I) : The normalized oscillator value itself
Quadrature (Q) : The bar-to-bar change in the normalized value (first derivative approximation)
This creates a 2D representation: (I, Q). The phase is extracted as:
φ = atan2(Q, I) × (180 / π)
This maps the oscillator to a point on the unit circle. An oscillator at the same value but rising (positive Q) will have a different phase than one that is falling (negative Q). This velocity-awareness is critical—it distinguishes between "at resistance and stalling" versus "at resistance and breaking through."
The amplitude is extracted as:
A = √(I² + Q²)
This represents the distance from origin in the (I, Q) plane. High amplitude means the oscillator is far from neutral (strong conviction). Low amplitude means it's near zero (weak/transitional state).
3. Coherence Calculation Pipeline
For each bar (or every Nth bar if phase sample rate > 1 for performance):
Step 1 : Extract phase φₙ for each of the N active oscillators
Step 2 : Compute complex exponentials: Zₙ = e^(i·φₙ·π/180) = cos(φₙ·π/180) + i·sin(φₙ·π/180)
Step 3 : Sum the complex exponentials: R = Σ Zₙ = (Σ cos φₙ) + i·(Σ sin φₙ)
Step 4 : Calculate magnitude: |R| = √
Step 5 : Normalize by count: CI_raw = |R| / N
Step 6 : Smooth the CI: CI = SMA(CI_raw, smoothing_window)
The smoothing step (default 2 bars) removes single-bar noise spikes while preserving structural coherence changes. Users can adjust this to control reactivity versus stability.
The dominant phase is calculated as:
φ_dom = atan2(Σ sin φₙ, Σ cos φₙ) × (180 / π)
This is the angle of the resultant vector R in the complex plane.
4. Entanglement Matrix Construction
For all unique pairs of oscillators (i, j) where i < j:
Step 1 : Get phases φᵢ and φⱼ
Step 2 : Compute phase difference: Δφ = φᵢ - φⱼ (in radians)
Step 3 : Calculate entanglement: E(i,j) = |cos(Δφ)|
Step 4 : Store in symmetric matrix: matrix = matrix = E(i,j)
The matrix is then scanned: count how many E(i,j) values exceed the user-defined threshold (default 0.7). This count is the entangled pairs metric.
For visualization, the matrix is rendered as an N×N table where cell brightness maps to E(i,j) intensity.
5. Phase-Lock Detection
Step 1 : For all unique pairs (i, j), compute angular distance: Δφ = |φᵢ - φⱼ|
Step 2 : Wrap angles: if Δφ > 180°, set Δφ = 360° - Δφ
Step 3 : Find maximum: max_spread = max(Δφ) across all pairs
Step 4 : Compare to tolerance: phase_locked = (max_spread < tolerance)
If phase_locked is true, all oscillators are within the specified angular cone (e.g., 35°). This is a boolean confirmation filter.
6. Signal Generation Logic
Signals are generated through multi-layer confirmation:
Long Ignition Signal :
CI crosses above ignition threshold (e.g., 0.80)
AND dominant phase is in bullish range (-90° < φ_dom < +90°)
AND phase_locked = true
AND entangled_pairs >= minimum threshold (e.g., 4)
Short Ignition Signal :
CI crosses above ignition threshold
AND dominant phase is in bearish range (φ_dom < -90° OR φ_dom > +90°)
AND phase_locked = true
AND entangled_pairs >= minimum threshold
Collapse Signal :
CI at bar minus CI at current bar > collapse threshold (e.g., 0.55)
AND CI at bar was above 0.6 (must collapse from coherent state, not from already-low state)
These are strict conditions. A high CI alone does not generate a signal—dominant phase must align with direction, oscillators must be phase-locked, and sufficient pairwise entanglement must exist. This multi-factor gating dramatically reduces false signals compared to single-condition triggers.
Calculation Methodology
Phase 1: Oscillator Computation and Normalization
On each bar, the system calculates the raw values for all enabled oscillators using standard Pine Script functions:
RSI: ta.rsi(close, length)
MACD: ta.macd() returning histogram component
Stochastic: ta.stoch() smoothed with ta.sma()
CCI: ta.cci(close, length)
Williams %R: ta.wpr(length)
MFI: ta.mfi(hlc3, length)
ROC: ta.roc(close, length)
TSI: ta.tsi(close, short, long)
Each raw value is then passed through a normalization function:
normalize(value, overbought_level, oversold_level) = 2 × (value - oversold) / (overbought - oversold) - 1
This maps the oscillator's typical range to , where -1 represents extreme bearish, 0 represents neutral, and +1 represents extreme bullish.
For oscillators without fixed ranges (MACD, ROC, TSI), statistical normalization is used: divide by a rolling standard deviation or fixed divisor, then clamp to .
Phase 2: Phasor Extraction
For each normalized oscillator value val:
I = val (in-phase component)
Q = val - val (quadrature component, first difference)
Phase calculation:
phi_rad = atan2(Q, I)
phi_deg = phi_rad × (180 / π)
Amplitude calculation:
A = √(I² + Q²)
These values are stored in arrays: osc_phases and osc_amps for each oscillator n.
Phase 3: Complex Summation and Coherence
Initialize accumulators:
sum_cos = 0
sum_sin = 0
For each oscillator n = 0 to N-1:
phi_rad = osc_phases × (π / 180)
sum_cos += cos(phi_rad)
sum_sin += sin(phi_rad)
Resultant magnitude:
resultant_mag = √(sum_cos² + sum_sin²)
Coherence Index (raw):
CI_raw = resultant_mag / N
Smoothed CI:
CI = SMA(CI_raw, smoothing_window)
Dominant phase:
phi_dom_rad = atan2(sum_sin, sum_cos)
phi_dom_deg = phi_dom_rad × (180 / π)
Phase 4: Entanglement Matrix Population
For i = 0 to N-2:
For j = i+1 to N-1:
phi_i = osc_phases × (π / 180)
phi_j = osc_phases × (π / 180)
delta_phi = phi_i - phi_j
E = |cos(delta_phi)|
matrix_index_ij = i × N + j
matrix_index_ji = j × N + i
entangle_matrix = E
entangle_matrix = E
if E >= threshold:
entangled_pairs += 1
The matrix uses flat array storage with index mapping: index(row, col) = row × N + col.
Phase 5: Phase-Lock Check
max_spread = 0
For i = 0 to N-2:
For j = i+1 to N-1:
delta = |osc_phases - osc_phases |
if delta > 180:
delta = 360 - delta
max_spread = max(max_spread, delta)
phase_locked = (max_spread < tolerance)
Phase 6: Signal Evaluation
Ignition Long :
ignition_long = (CI crosses above threshold) AND
(phi_dom > -90 AND phi_dom < 90) AND
phase_locked AND
(entangled_pairs >= minimum)
Ignition Short :
ignition_short = (CI crosses above threshold) AND
(phi_dom < -90 OR phi_dom > 90) AND
phase_locked AND
(entangled_pairs >= minimum)
Collapse :
CI_prev = CI
collapse = (CI_prev - CI > collapse_threshold) AND (CI_prev > 0.6)
All signals are evaluated on bar close. The crossover and crossunder functions ensure signals fire only once when conditions transition from false to true.
Phase 7: Field Strength and Visualization Metrics
Average Amplitude :
avg_amp = (Σ osc_amps ) / N
Field Strength :
field_strength = CI × avg_amp
Collapse Risk (for dashboard):
collapse_risk = (CI - CI) / max(CI , 0.1)
collapse_risk_pct = clamp(collapse_risk × 100, 0, 100)
Quantum State Classification :
if (CI > threshold AND phase_locked):
state = "Ignition"
else if (CI > 0.6):
state = "Coherent"
else if (collapse):
state = "Collapse"
else:
state = "Chaos"
Phase 8: Visual Rendering
Orbit Plot : For each oscillator, convert polar (phase, amplitude) to Cartesian (x, y) for grid placement:
radius = amplitude × grid_center × 0.8
x = radius × cos(phase × π/180)
y = radius × sin(phase × π/180)
col = center + x (mapped to grid coordinates)
row = center - y
Heat Map : For each oscillator row and time column, retrieve historical phase value at lookback = (columns - col) × sample_rate, then map phase to color using a hue gradient.
Entanglement Web : Render matrix as table cell with background color opacity = E(i,j).
Field Cloud : Background color = (phi_dom > -90 AND phi_dom < 90) ? green : red, with opacity = mix(min_opacity, max_opacity, CI).
All visual components render only on the last bar (barstate.islast) to minimize computational overhead.
How to Use This Indicator
Step 1 : Apply QRFM to your chart. It works on all timeframes and asset classes, though 15-minute to 4-hour timeframes provide the best balance of responsiveness and noise reduction.
Step 2 : Enable the dashboard (default: top right) and the circular orbit plot (default: middle left). These are your primary visual feedback tools.
Step 3 : Optionally enable the heat map, entanglement web, and field cloud based on your preference. New users may find all visuals overwhelming; start with dashboard + orbit plot.
Step 4 : Observe for 50-100 bars to let the indicator establish baseline coherence patterns. Markets have different "normal" CI ranges—some instruments naturally run higher or lower coherence.
Understanding the Circular Orbit Plot
The orbit plot is a polar grid showing oscillator vectors in real-time:
Center point : Neutral (zero phase and amplitude)
Each vector : A line from center to a point on the grid
Vector angle : The oscillator's phase (0° = right/east, 90° = up/north, 180° = left/west, -90° = down/south)
Vector length : The oscillator's amplitude (short = weak signal, long = strong signal)
Vector label : First letter of oscillator name (R = RSI, M = MACD, etc.)
What to watch :
Convergence : When all vectors cluster in one quadrant or sector, CI is rising and coherence is forming. This is your pre-signal warning.
Scatter : When vectors point in random directions (360° spread), CI is low and the market is in a non-trending or transitional regime.
Rotation : When the cluster rotates smoothly around the circle, the ensemble is in coherent oscillation—typically seen during steady trends.
Sudden flips : When the cluster rapidly jumps from one side to the opposite (e.g., +90° to -90°), a phase reversal has occurred—often coinciding with trend reversals.
Example: If you see RSI, MACD, and Stochastic all pointing toward 45° (northeast) with long vectors, while CCI, TSI, and ROC point toward 40-50° as well, coherence is high and dominant phase is bullish. Expect an ignition signal if CI crosses threshold.
Reading Dashboard Metrics
The dashboard provides numerical confirmation of what the orbit plot shows visually:
CI : Displays as 0-100%. Above 70% = high coherence (strong regime), 40-70% = moderate, below 40% = low (poor conditions for trend entries).
Dom Phase : Angle in degrees with directional arrow. ⬆ = bullish bias, ⬇ = bearish bias, ⬌ = neutral.
Field Strength : CI weighted by amplitude. High values (> 0.6) indicate not just alignment but strong alignment.
Entangled Pairs : Count of oscillator pairs with E > threshold. Higher = more confirmation. If minimum is set to 4, you need at least 4 pairs entangled for signals.
Phase Lock : 🔒 YES (all oscillators within tolerance) or 🔓 NO (spread too wide).
State : Real-time classification:
🚀 IGNITION: CI just crossed threshold with phase-lock
⚡ COHERENT: CI is high and stable
💥 COLLAPSE: CI has dropped sharply
🌀 CHAOS: Low CI, scattered phases
Collapse Risk : 0-100% scale based on recent CI change. Above 50% warns of imminent breakdown.
Interpreting Signals
Long Ignition (Blue Triangle Below Price) :
Occurs when CI crosses above threshold (e.g., 0.80)
Dominant phase is in bullish range (-90° to +90°)
All oscillators are phase-locked (within tolerance)
Minimum entangled pairs requirement met
Interpretation : The oscillator ensemble has transitioned from disorder to coherent bullish alignment. This is a high-probability long entry point. The multi-layer confirmation (CI + phase direction + lock + entanglement) ensures this is not a single-oscillator whipsaw.
Short Ignition (Red Triangle Above Price) :
Same conditions as long, but dominant phase is in bearish range (< -90° or > +90°)
Interpretation : Coherent bearish alignment has formed. High-probability short entry.
Collapse (Circles Above and Below Price) :
CI has dropped by more than the collapse threshold (e.g., 0.55) over a 5-bar window
CI was previously above 0.6 (collapsing from coherent state)
Interpretation : Phase coherence has broken down. If you are in a position, this is an exit warning. If looking to enter, stand aside—regime is transitioning.
Phase-Time Heat Map Patterns
Enable the heat map and position it at bottom right. The rows represent individual oscillators, columns represent time bins (most recent on left).
Pattern: Horizontal Color Bands
If a row (e.g., RSI) shows consistent color across columns (say, green for several bins), that oscillator has maintained stable phase over time. If all rows show horizontal bands of similar color, the entire ensemble has been phase-locked for an extended period—this is a strong trending regime.
Pattern: Vertical Color Bands
If a column (single time bin) shows all cells with the same or very similar color, that moment in time had high coherence. These vertical bands often align with ignition signals or major price pivots.
Pattern: Rainbow Chaos
If cells are random colors (red, green, yellow mixed with no pattern), coherence is low. The ensemble is scattered. Avoid trading during these periods unless you have external confirmation.
Pattern: Color Transition
If you see a row transition from red to green (or vice versa) sharply, that oscillator has phase-flipped. If multiple rows do this simultaneously, a regime change is underway.
Entanglement Web Analysis
Enable the web matrix (default: opposite corner from heat map). It shows an N×N grid where N = number of active oscillators.
Bright Yellow/Gold Cells : High pairwise entanglement. For example, if the RSI-MACD cell is bright gold, those two oscillators are moving in phase. If the RSI-Stochastic cell is bright, they are entangled as well.
Dark Gray Cells : Low entanglement. Oscillators are decorrelated or in quadrature.
Diagonal : Always marked with "—" because an oscillator is always perfectly entangled with itself.
How to use :
Scan for clustering: If most cells are bright, coherence is high across the board. If only a few cells are bright, coherence is driven by a subset (e.g., RSI and MACD are aligned, but nothing else is—weak signal).
Identify laggards: If one row/column is entirely dark, that oscillator is the outlier. You may choose to disable it or monitor for when it joins the group (late confirmation).
Watch for web formation: During low-coherence periods, the matrix is mostly dark. As coherence builds, cells begin lighting up. A sudden "web" of connections forming visually precedes ignition signals.
Trading Workflow
Step 1: Monitor Coherence Level
Check the dashboard CI metric or observe the orbit plot. If CI is below 40% and vectors are scattered, conditions are poor for trend entries. Wait.
Step 2: Detect Coherence Building
When CI begins rising (say, from 30% to 50-60%) and you notice vectors on the orbit plot starting to cluster, coherence is forming. This is your alert phase—do not enter yet, but prepare.
Step 3: Confirm Phase Direction
Check the dominant phase angle and the orbit plot quadrant where clustering is occurring:
Clustering in right half (0° to ±90°): Bullish bias forming
Clustering in left half (±90° to 180°): Bearish bias forming
Verify the dashboard shows the corresponding directional arrow (⬆ or ⬇).
Step 4: Wait for Signal Confirmation
Do not enter based on rising CI alone. Wait for the full ignition signal:
CI crosses above threshold
Phase-lock indicator shows 🔒 YES
Entangled pairs count >= minimum
Directional triangle appears on chart
This ensures all layers have aligned.
Step 5: Execute Entry
Long : Blue triangle below price appears → enter long
Short : Red triangle above price appears → enter short
Step 6: Position Management
Initial Stop : Place stop loss based on your risk management rules (e.g., recent swing low/high, ATR-based buffer).
Monitoring :
Watch the field cloud density. If it remains opaque and colored in your direction, the regime is intact.
Check dashboard collapse risk. If it rises above 50%, prepare for exit.
Monitor the orbit plot. If vectors begin scattering or the cluster flips to the opposite side, coherence is breaking.
Exit Triggers :
Collapse signal fires (circles appear)
Dominant phase flips to opposite half-plane
CI drops below 40% (coherence lost)
Price hits your profit target or trailing stop
Step 7: Post-Exit Analysis
After exiting, observe whether a new ignition forms in the opposite direction (reversal) or if CI remains low (transition to range). Use this to decide whether to re-enter, reverse, or stand aside.
Best Practices
Use Price Structure as Context
QRFM identifies when coherence forms but does not specify where price will go. Combine ignition signals with support/resistance levels, trendlines, or chart patterns. For example:
Long ignition near a major support level after a pullback: high-probability bounce
Long ignition in the middle of a range with no structure: lower probability
Multi-Timeframe Confirmation
Open QRFM on two timeframes simultaneously:
Higher timeframe (e.g., 4-hour): Use CI level to determine regime bias. If 4H CI is above 60% and dominant phase is bullish, the market is in a bullish regime.
Lower timeframe (e.g., 15-minute): Execute entries on ignition signals that align with the higher timeframe bias.
This prevents counter-trend trades and increases win rate.
Distinguish Between Regime Types
High CI, stable dominant phase (State: Coherent) : Trending market. Ignitions are continuation signals; collapses are profit-taking or reversal warnings.
Low CI, erratic dominant phase (State: Chaos) : Ranging or choppy market. Avoid ignition signals or reduce position size. Wait for coherence to establish.
Moderate CI with frequent collapses : Whipsaw environment. Use wider stops or stand aside.
Adjust Parameters to Instrument and Timeframe
Crypto/Forex (high volatility) : Lower ignition threshold (0.65-0.75), lower CI smoothing (2-3), shorter oscillator lengths (7-10).
Stocks/Indices (moderate volatility) : Standard settings (threshold 0.75-0.85, smoothing 5-7, oscillator lengths 14).
Lower timeframes (5-15 min) : Reduce phase sample rate to 1-2 for responsiveness.
Higher timeframes (daily+) : Increase CI smoothing and oscillator lengths for noise reduction.
Use Entanglement Count as Conviction Filter
The minimum entangled pairs setting controls signal strictness:
Low (1-2) : More signals, lower quality (acceptable if you have other confirmation)
Medium (3-5) : Balanced (recommended for most traders)
High (6+) : Very strict, fewer signals, highest quality
Adjust based on your trade frequency preference and risk tolerance.
Monitor Oscillator Contribution
Use the entanglement web to see which oscillators are driving coherence. If certain oscillators are consistently dark (low E with all others), they may be adding noise. Consider disabling them. For example:
On low-volume instruments, MFI may be unreliable → disable MFI
On strongly trending instruments, mean-reversion oscillators (Stochastic, RSI) may lag → reduce weight or disable
Respect the Collapse Signal
Collapse events are early warnings. Price may continue in the original direction for several bars after collapse fires, but the underlying regime has weakened. Best practice:
If in profit: Take partial or full profit on collapse
If at breakeven/small loss: Exit immediately
If collapse occurs shortly after entry: Likely a false ignition; exit to avoid drawdown
Collapses do not guarantee immediate reversals—they signal uncertainty .
Combine with Volume Analysis
If your instrument has reliable volume:
Ignitions with expanding volume: Higher conviction
Ignitions with declining volume: Weaker, possibly false
Collapses with volume spikes: Strong reversal signal
Collapses with low volume: May just be consolidation
Volume is not built into QRFM (except via MFI), so add it as external confirmation.
Observe the Phase Spiral
The spiral provides a quick visual cue for rotation consistency:
Tight, smooth spiral : Ensemble is rotating coherently (trending)
Loose, erratic spiral : Phase is jumping around (ranging or transitional)
If the spiral tightens, coherence is building. If it loosens, coherence is dissolving.
Do Not Overtrade Low-Coherence Periods
When CI is persistently below 40% and the state is "Chaos," the market is not in a regime where phase analysis is predictive. During these times:
Reduce position size
Widen stops
Wait for coherence to return
QRFM's strength is regime detection. If there is no regime, the tool correctly signals "stand aside."
Use Alerts Strategically
Set alerts for:
Long Ignition
Short Ignition
Collapse
Phase Lock (optional)
Configure alerts to "Once per bar close" to avoid intrabar repainting and noise. When an alert fires, manually verify:
Orbit plot shows clustering
Dashboard confirms all conditions
Price structure supports the trade
Do not blindly trade alerts—use them as prompts for analysis.
Ideal Market Conditions
Best Performance
Instruments :
Liquid, actively traded markets (major forex pairs, large-cap stocks, major indices, top-tier crypto)
Instruments with clear cyclical oscillator behavior (avoid extremely illiquid or manipulated markets)
Timeframes :
15-minute to 4-hour: Optimal balance of noise reduction and responsiveness
1-hour to daily: Slower, higher-conviction signals; good for swing trading
5-minute: Acceptable for scalping if parameters are tightened and you accept more noise
Market Regimes :
Trending markets with periodic retracements (where oscillators cycle through phases predictably)
Breakout environments (coherence forms before/during breakout; collapse occurs at exhaustion)
Rotational markets with clear swings (oscillators phase-lock at turning points)
Volatility :
Moderate to high volatility (oscillators have room to move through their ranges)
Stable volatility regimes (sudden VIX spikes or flash crashes may create false collapses)
Challenging Conditions
Instruments :
Very low liquidity markets (erratic price action creates unstable oscillator phases)
Heavily news-driven instruments (fundamentals may override technical coherence)
Highly correlated instruments (oscillators may all reflect the same underlying factor, reducing independence)
Market Regimes :
Deep, prolonged consolidation (oscillators remain near neutral, CI is chronically low, few signals fire)
Extreme chop with no directional bias (oscillators whipsaw, coherence never establishes)
Gap-driven markets (large overnight gaps create phase discontinuities)
Timeframes :
Sub-5-minute charts: Noise dominates; oscillators flip rapidly; coherence is fleeting and unreliable
Weekly/monthly: Oscillators move extremely slowly; signals are rare; better suited for long-term positioning than active trading
Special Cases :
During major economic releases or earnings: Oscillators may lag price or become decorrelated as fundamentals overwhelm technicals. Reduce position size or stand aside.
In extremely low-volatility environments (e.g., holiday periods): Oscillators compress to neutral, CI may be artificially high due to lack of movement, but signals lack follow-through.
Adaptive Behavior
QRFM is designed to self-adapt to poor conditions:
When coherence is genuinely absent, CI remains low and signals do not fire
When only a subset of oscillators aligns, entangled pairs count stays below threshold and signals are filtered out
When phase-lock cannot be achieved (oscillators too scattered), the lock filter prevents signals
This means the indicator will naturally produce fewer (or zero) signals during unfavorable conditions, rather than generating false signals. This is a feature —it keeps you out of low-probability trades.
Parameter Optimization by Trading Style
Scalping (5-15 Minute Charts)
Goal : Maximum responsiveness, accept higher noise
Oscillator Lengths :
RSI: 7-10
MACD: 8/17/6
Stochastic: 8-10, smooth 2-3
CCI: 14-16
Others: 8-12
Coherence Settings :
CI Smoothing Window: 2-3 bars (fast reaction)
Phase Sample Rate: 1 (every bar)
Ignition Threshold: 0.65-0.75 (lower for more signals)
Collapse Threshold: 0.40-0.50 (earlier exit warnings)
Confirmation :
Phase Lock Tolerance: 40-50° (looser, easier to achieve)
Min Entangled Pairs: 2-3 (fewer oscillators required)
Visuals :
Orbit Plot + Dashboard only (reduce screen clutter for fast decisions)
Disable heavy visuals (heat map, web) for performance
Alerts :
Enable all ignition and collapse alerts
Set to "Once per bar close"
Day Trading (15-Minute to 1-Hour Charts)
Goal : Balance between responsiveness and reliability
Oscillator Lengths :
RSI: 14 (standard)
MACD: 12/26/9 (standard)
Stochastic: 14, smooth 3
CCI: 20
Others: 10-14
Coherence Settings :
CI Smoothing Window: 3-5 bars (balanced)
Phase Sample Rate: 2-3
Ignition Threshold: 0.75-0.85 (moderate selectivity)
Collapse Threshold: 0.50-0.55 (balanced exit timing)
Confirmation :
Phase Lock Tolerance: 30-40° (moderate tightness)
Min Entangled Pairs: 4-5 (reasonable confirmation)
Visuals :
Orbit Plot + Dashboard + Heat Map or Web (choose one)
Field Cloud for regime backdrop
Alerts :
Ignition and collapse alerts
Optional phase-lock alert for advance warning
Swing Trading (4-Hour to Daily Charts)
Goal : High-conviction signals, minimal noise, fewer trades
Oscillator Lengths :
RSI: 14-21
MACD: 12/26/9 or 19/39/9 (longer variant)
Stochastic: 14-21, smooth 3-5
CCI: 20-30
Others: 14-20
Coherence Settings :
CI Smoothing Window: 5-10 bars (very smooth)
Phase Sample Rate: 3-5
Ignition Threshold: 0.80-0.90 (high bar for entry)
Collapse Threshold: 0.55-0.65 (only significant breakdowns)
Confirmation :
Phase Lock Tolerance: 20-30° (tight clustering required)
Min Entangled Pairs: 5-7 (strong confirmation)
Visuals :
All modules enabled (you have time to analyze)
Heat Map for multi-bar pattern recognition
Web for deep confirmation analysis
Alerts :
Ignition and collapse
Review manually before entering (no rush)
Position/Long-Term Trading (Daily to Weekly Charts)
Goal : Rare, very high-conviction regime shifts
Oscillator Lengths :
RSI: 21-30
MACD: 19/39/9 or 26/52/12
Stochastic: 21, smooth 5
CCI: 30-50
Others: 20-30
Coherence Settings :
CI Smoothing Window: 10-14 bars
Phase Sample Rate: 5 (every 5th bar to reduce computation)
Ignition Threshold: 0.85-0.95 (only extreme alignment)
Collapse Threshold: 0.60-0.70 (major regime breaks only)
Confirmation :
Phase Lock Tolerance: 15-25° (very tight)
Min Entangled Pairs: 6+ (broad consensus required)
Visuals :
Dashboard + Orbit Plot for quick checks
Heat Map to study historical coherence patterns
Web to verify deep entanglement
Alerts :
Ignition only (collapses are less critical on long timeframes)
Manual review with fundamental analysis overlay
Performance Optimization (Low-End Systems)
If you experience lag or slow rendering:
Reduce Visual Load :
Orbit Grid Size: 8-10 (instead of 12+)
Heat Map Time Bins: 5-8 (instead of 10+)
Disable Web Matrix entirely if not needed
Disable Field Cloud and Phase Spiral
Reduce Calculation Frequency :
Phase Sample Rate: 5-10 (calculate every 5-10 bars)
Max History Depth: 100-200 (instead of 500+)
Disable Unused Oscillators :
If you only want RSI, MACD, and Stochastic, disable the other five. Fewer oscillators = smaller matrices, faster loops.
Simplify Dashboard :
Choose "Small" dashboard size
Reduce number of metrics displayed
These settings will not significantly degrade signal quality (signals are based on bar-close calculations, which remain accurate), but will improve chart responsiveness.
Important Disclaimers
This indicator is a technical analysis tool designed to identify periods of phase coherence across an ensemble of oscillators. It is not a standalone trading system and does not guarantee profitable trades. The Coherence Index, dominant phase, and entanglement metrics are mathematical calculations applied to historical price data—they measure past oscillator behavior and do not predict future price movements with certainty.
No Predictive Guarantee : High coherence indicates that oscillators are currently aligned, which historically has coincided with trending or directional price movement. However, past alignment does not guarantee future trends. Markets can remain coherent while prices consolidate, or lose coherence suddenly due to news, liquidity changes, or other factors not captured by oscillator mathematics.
Signal Confirmation is Probabilistic : The multi-layer confirmation system (CI threshold + dominant phase + phase-lock + entanglement) is designed to filter out low-probability setups. This increases the proportion of valid signals relative to false signals, but does not eliminate false signals entirely. Users should combine QRFM with additional analysis—support and resistance levels, volume confirmation, multi-timeframe alignment, and fundamental context—before executing trades.
Collapse Signals are Warnings, Not Reversals : A coherence collapse indicates that the oscillator ensemble has lost alignment. This often precedes trend exhaustion or reversals, but can also occur during healthy pullbacks or consolidations. Price may continue in the original direction after a collapse. Use collapses as risk management cues (tighten stops, take partial profits) rather than automatic reversal entries.
Market Regime Dependency : QRFM performs best in markets where oscillators exhibit cyclical, mean-reverting behavior and where trends are punctuated by retracements. In markets dominated by fundamental shocks, gap openings, or extreme low-liquidity conditions, oscillator coherence may be less reliable. During such periods, reduce position size or stand aside.
Risk Management is Essential : All trading involves risk of loss. Use appropriate stop losses, position sizing, and risk-per-trade limits. The indicator does not specify stop loss or take profit levels—these must be determined by the user based on their risk tolerance and account size. Never risk more than you can afford to lose.
Parameter Sensitivity : The indicator's behavior changes with input parameters. Aggressive settings (low thresholds, loose tolerances) produce more signals with lower average quality. Conservative settings (high thresholds, tight tolerances) produce fewer signals with higher average quality. Users should backtest and forward-test parameter sets on their specific instruments and timeframes before committing real capital.
No Repainting by Design : All signal conditions are evaluated on bar close using bar-close values. However, the visual components (orbit plot, heat map, dashboard) update in real-time during bar formation for monitoring purposes. For trade execution, rely on the confirmed signals (triangles and circles) that appear only after the bar closes.
Computational Load : QRFM performs extensive calculations, including nested loops for entanglement matrices and real-time table rendering. On lower-powered devices or when running multiple indicators simultaneously, users may experience lag. Use the performance optimization settings (reduce visual complexity, increase phase sample rate, disable unused oscillators) to improve responsiveness.
This system is most effective when used as one component within a broader trading methodology that includes sound risk management, multi-timeframe analysis, market context awareness, and disciplined execution. It is a tool for regime detection and signal confirmation, not a substitute for comprehensive trade planning.
Technical Notes
Calculation Timing : All signal logic (ignition, collapse) is evaluated using bar-close values. The barstate.isconfirmed or implicit bar-close behavior ensures signals do not repaint. Visual components (tables, plots) render on every tick for real-time feedback but do not affect signal generation.
Phase Wrapping : Phase angles are calculated in the range -180° to +180° using atan2. Angular distance calculations account for wrapping (e.g., the distance between +170° and -170° is 20°, not 340°). This ensures phase-lock detection works correctly across the ±180° boundary.
Array Management : The indicator uses fixed-size arrays for oscillator phases, amplitudes, and the entanglement matrix. The maximum number of oscillators is 8. If fewer oscillators are enabled, array sizes shrink accordingly (only active oscillators are processed).
Matrix Indexing : The entanglement matrix is stored as a flat array with size N×N, where N is the number of active oscillators. Index mapping: index(row, col) = row × N + col. Symmetric pairs (i,j) and (j,i) are stored identically.
Normalization Stability : Oscillators are normalized to using fixed reference levels (e.g., RSI overbought/oversold at 70/30). For unbounded oscillators (MACD, ROC, TSI), statistical normalization (division by rolling standard deviation) is used, with clamping to prevent extreme outliers from distorting phase calculations.
Smoothing and Lag : The CI smoothing window (SMA) introduces lag proportional to the window size. This is intentional—it filters out single-bar noise spikes in coherence. Users requiring faster reaction can reduce the smoothing window to 1-2 bars, at the cost of increased sensitivity to noise.
Complex Number Representation : Pine Script does not have native complex number types. Complex arithmetic is implemented using separate real and imaginary accumulators (sum_cos, sum_sin) and manual calculation of magnitude (sqrt(real² + imag²)) and argument (atan2(imag, real)).
Lookback Limits : The indicator respects Pine Script's maximum lookback constraints. Historical phase and amplitude values are accessed using the operator, with lookback limited to the chart's available bar history (max_bars_back=5000 declared).
Visual Rendering Performance : Tables (orbit plot, heat map, web, dashboard) are conditionally deleted and recreated on each update using table.delete() and table.new(). This prevents memory leaks but incurs redraw overhead. Rendering is restricted to barstate.islast (last bar) to minimize computational load—historical bars do not render visuals.
Alert Condition Triggers : alertcondition() functions evaluate on bar close when their boolean conditions transition from false to true. Alerts do not fire repeatedly while a condition remains true (e.g., CI stays above threshold for 10 bars fires only once on the initial cross).
Color Gradient Functions : The phaseColor() function maps phase angles to RGB hues using sine waves offset by 120° (red, green, blue channels). This creates a continuous spectrum where -180° to +180° spans the full color wheel. The amplitudeColor() function maps amplitude to grayscale intensity. The coherenceColor() function uses cos(phase) to map contribution to CI (positive = green, negative = red).
No External Data Requests : QRFM operates entirely on the chart's symbol and timeframe. It does not use request.security() or access external data sources. All calculations are self-contained, avoiding lookahead bias from higher-timeframe requests.
Deterministic Behavior : Given identical input parameters and price data, QRFM produces identical outputs. There are no random elements, probabilistic sampling, or time-of-day dependencies.
— Dskyz, Engineering precision. Trading coherence.
Tìm kiếm tập lệnh với "pullback"

JOPA Channel (Dual-Volumed) v1 [JopAlgo]JOPA Channel (Dual-Volumed) v1
Short title: JOPAV1 • License: MPL-2.0 • Provider: JopAlgo
We have developed our own, first channel-based trading indicator and we’re making it available to all traders. The goal was a channel that breathes with the tape—built on a volume-weighted backbone—so the outcome stays lively instead of static. That led to the JOPA Channel.
All important features (at a glance)
In one line: A Rolling-VWAP channel whose width adapts with two volumes (RVOL + dollar-flow), adds order-flow asymmetry (OBV tilt) and regime awareness (Efficiency Ratio), and frames risk with outer containment bands from residual extremes—so you see fair value, momentum, and exhaustion in one view.
Feature list
Rolling VWAP centerline: Tracks where volume traded (fair value).
Dual-volume width: Bands expand/contract with relative volume and value traded (price×volume).
OBV tilt: Upper/lower widths skew toward the side actually pushing.
Regime adapter (ER): Tighter in trend, wider in chop—automatically.
Outer containment rails: Residual-extreme ceilings/floors, smoothed + margin.
20% / 80% guides: 20% light blue (discount), 80% light red (premium).
Squeeze dots (optional): Orange circles below candles during compression.
Non-repainting: Uses rolling sums and past-only math; no lookahead.
Default visual in this release
Containment rails + fill: ON (stepline, medium).
Inner Value rails + fill: Rails OFF (stepline, thin), fill ON (drawn only if rails are shown).
20% & 80% guides: ON (dashed, thin; 20% light blue, 80% light red).
Squeeze dots: OFF by default (orange circles when enabled).
What you see on the chart
RVWAP (centerline): Your compass for fair value.
Inner Value Bands (optional): Tight rails for breakouts and pullback timing.
Outer Containment Bands (default ON): High-confidence ceilings/floors for targets and fades.
20% / 80% guides: Quick read of “where in the channel” price is sitting.
Squeeze dots (optional): Volatility compression heads-up (no text labels).
Non-repainting note: The indicator does not revise closed bars. Forecast-Lock uses linear regression to extrapolate 1–3 bars ahead without using future data.
How to use it
Core reads (works on any timeframe)
Bias: Above a rising RVWAP → long bias; below a falling RVWAP → short bias.
Breakouts (momentum): Close beyond an Inner Value rail with RVOL ≥ threshold (alert provided).
Reversions (fades): Tag Outer Containment, stall, then close back inside → expect mean reversion toward RVWAP.
20/80 timing:
At/above 80% (light red) → premium/exhaustion risk; trim longs or consider fades if RVOL cools.
At/below 20% (light blue) → discount/exhaustion risk; trim shorts or consider longs if RVOL cools.
Squeeze clusters: When dots bunch up, expect a range break; use the Breakout alert as confirmation.
Playbooks by trading style
Day Trading (1–5m)
Setup: Keep the chart clean (Containment ON, Value rails OFF). Toggle Inner Value ON when hunting a breakout or timing a pullback.
Pullback Long: Dip to RVWAP / Lower Value with sub-threshold RVOL, then a close back above RVWAP → long.
Stop: Just beyond Lower Containment or the pullback swing.
Targets (1:1:1): ⅓ at RVWAP, ⅓ at Upper Value, ⅓ trail toward Upper Containment.
Breakout Long: After a squeeze cluster, take the Breakout Long alert (close > Upper Value, RVOL ≥ min). If no retest, demand the next bar holds outside.
Range Fade: Only when RVWAP is flat and dots cluster; short Upper Containment → RVWAP (mirror for longs at the lower rail).
Intraday (15m–1H)
HTF compass: Take bias from 4H.
Pullback Long: “Touch & reclaim” of RVWAP while RVOL cools; enter on the reclaim close or break of that candle’s high.
Breakout: Run Inner Value ON; act on Breakout alerts (RVOL gate ≈ 1.10–1.15 typical).
Avoid low-probability fades against the 4H slope unless RVWAP is flat.
Swing (4H–1D)
Continuation: In uptrends, buy pullbacks to RVWAP / Lower Value with sub-threshold RVOL; scale at Upper Containment.
Adds: Post-squeeze Breakout Long adds; trail on RVWAP or Lower Value.
Fades: Prefer when RVWAP flattens and price oscillates between containments.
Position (1D+)
Framework: Daily RVWAP slope + position within containment.
Add rule: Each reclaim of RVWAP after a dip is an add; trim into Upper Containment or near 80% light red.
Sizing: Containment distance is larger—size down and trail on RVWAP.
Inputs & Settings (complete)
Core
Source: Price input for RVWAP.
Rolling VWAP Length: Window of the centerline (higher = smoother).
Volume Baseline (RVOL): SMA window for relative volume.
Inner Value Bands (volatility-based width)
k·StdDev(residuals), k·ATR, k·MAD(residuals): Blend three measures into base width.
StdDev / ATR / MAD Lengths: Lookbacks for each.
Two-Volume Fusion
RVOL Exponent: How aggressively width responds to relative volume.
Dollar-Flow Gain: Adds push from price×volume (value traded).
Dollar-Flow Z-Window: Standardization window for dollar-flow.
Asymmetry (Order-Flow Tilt)
Enable Tilt (OBV): Lets flow skew upper/lower widths.
Tilt Strength (0..1): Gain applied to OBV slope z-score.
OBV Slope Z-Window: Window to standardize OBV slope.
Regime Adapter
Efficiency Ratio Lookback: Measures trend vs chop.
ER Width Min/Max: Maps ER into a width factor (tighter in trend, wider in chop).
Band Tracking (inner value rails)
Tracking Mode:
Base: Pure base rails.
Parallel-Lock: Smooth RVWAP & width; track in parallel.
Slope-Lock: Adds a fraction of recent slope (momentum-friendly).
Forecast-Lock: 1–3 bar extrapolation via linreg (non-repainting on closed bars).
Attach Strength (0..1): Blend tracked rails vs base rails.
Tracking Smooth Length: EMA smoothing of RVWAP and width.
Slope Influence / Forecast Lead Bars: Gains for the chosen mode.
Outer Containment Bands
Show Containment Bands: Master toggle (default ON).
Residual Extremes Lookback: Highest/lowest residual window.
Extreme Smoothing (EMA): Stability on extreme lines.
Margin vs inner width: Extra padding relative to smoothed inner width.
Squeeze & Alerts
Squeeze Window / Threshold: Width vs average; at/under threshold = dot (when enabled).
Min RVOL for Breakout: Required RVOL for breakout alerts.
Style (defaults in this release)
Inner Value rails: OFF (stepline, thin).
Inner & Containment fills: ON.
Containment rails: ON (stepline, medium).
20% / 80% guides: ON — 20% light blue, 80% light red, dashed, thin.
Squeeze dots: OFF by default (orange circles below candles when enabled).
Practical templates (copy/paste into a plan)
Momentum Breakout
Context: Squeeze cluster near RVWAP; Inner Value ON.
Trigger: Breakout Long (close > Upper Value & RVOL ≥ min).
Stop: Below Lower Value (tight) or below RVWAP (safer).
Targets (1:1:1): ⅓ Value → ⅓ Containment → ⅓ trail on RVWAP.
Pullback Continuation
Context: Uptrend; dip to RVWAP / Lower Value with cooling RVOL.
Trigger: Close back above RVWAP or break of reclaim candle’s high.
Stop: Just outside Lower Containment or pullback swing.
Targets: RVWAP → Upper Value → Upper Containment.
Containment Reversion (range)
Context: RVWAP flat; repeated containment tags.
Trigger: Stall at containment, then close back inside.
Stop: A step beyond that containment.
Target: RVWAP; runner only if RVOL stays muted.
Alerts included
DVWAP Breakout Long / Short (Value Bands)
Top Zone / Bottom Zone (20% / 80% guides)
Tip: On lower TFs, act on Breakout alerts with higher-TF bias (e.g., trade 5–15m in the direction of 1H/4H RVWAP slope/position).
Best practices
Let RVWAP be the compass; if unsure, wait until price picks a side.
Respect RVOL; low-RVOL breaks are prone to fail.
Use guides for timing, not certainty. Pair 20/80 zones with flow context.
Start with defaults; change one knob at a time.
Common pitfalls
Fading every containment touch → only fade when RVWAP is flat or RVOL cools.
Over-tuning inputs → the defaults are robust; small tweaks go a long way.
Fighting the higher timeframe on low TFs → expensive habit.
Footer — License & Publishing
License: Mozilla Public License 2.0 (MPL-2.0). You may modify and redistribute; keep this file under MPL and provide source for this file.
Originality: © 2025 JopAlgo. No third-party code reused; Pine built-ins and common formulas only.
Publishing: Keep this header/description intact when releasing on TradingView. Avoid promotional links in the public script text.

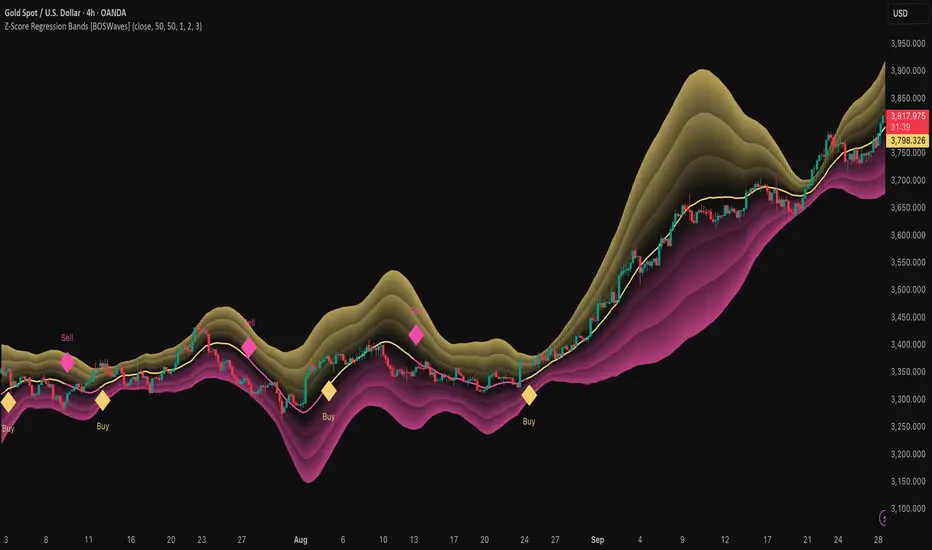
Z-Score Regression Bands [BOSWaves]Z-Score Regression Bands – Adaptive Trend and Volatility Insight
Overview
The Z-Score Regression Bands is a trend and volatility analysis framework designed to give traders a clear, structured view of price behavior. It combines Least Squares Moving Average (LSMA) regression, a statistical method to detect underlying trends, with Z-Score standardization, which measures how far price deviates from its recent average.
Traditional moving average bands, like Bollinger Bands, often lag behind trends or generate false signals in noisy markets. Z-Score Regression Bands addresses these limitations by:
Tracking trends accurately using LSMA regression
Normalizing deviations with Z-Scores to identify statistically significant price extremes
Visualizing multiple bands for normal, strong, and extreme moves
Highlighting trend shifts using diamond markers based on Z-Score crossings
This multi-layered approach allows traders to understand trend strength, detect overextensions, and identify periods of low or high volatility — all from a single, clear chart overlay. It is designed for traders of all levels and can be applied across scalping, day trading, swing trading, and longer-term strategies.
Theoretical Foundation
The Z-Score Regression Bands are grounded in statistical and trend analysis principles. Here’s the idea in plain terms:
Least Squares Moving Average (LSMA) – Unlike standard moving averages, LSMA fits a straight line to recent price data using regression. This “best-fit” line shows the underlying trend more precisely and reduces lag, helping traders see trend changes earlier.
Z-Score Standardization – A Z-Score expresses how far the LSMA is from its recent mean in standard deviation units. This shows whether price is unusually high or low, which can indicate potential reversals, pullbacks, or acceleration of a trend.
Multi-Band Structure – The three bands represent: Band #1: Normal range of price fluctuations; Band #2: Significant deviation from the trend; Band #3: Extreme price levels that are statistically rare. The distance between bands dynamically adapts to market volatility, allowing traders to visualize expansions (higher volatility) and contractions (lower volatility).
Trend Signals – When Z-Score crosses zero, diamonds appear on the chart. These markers signal potential trend initiation, continuation, or reversal, offering a simple alert for shifts in market momentum.
How It Works
The indicator calculates and plots several layers of information:
LSMA Regression (Trend Detection)
Computes a line that best fits recent price points.
The LSMA line smooths out minor fluctuations while reflecting the general direction of the market.
Z-Score Calculation (Deviation Measurement)
Standardizes the LSMA relative to its recent average.
Positive Z-Score → LSMA above average, negative → LSMA below average.
Helps identify overbought or oversold conditions relative to the trend.
Multi-Band Construction (Volatility Envelope)
Upper and lower bands are placed at configurable multiples of standard deviation.
Band #1 captures typical price movement, Band #2 signals stronger deviation, Band #3 highlights extreme moves.
Bands expand and contract with volatility, giving an intuitive visual guide to market conditions.
Trend Signals (Diamonds)
Appear when Z-Score crosses zero.
Indicates moments when momentum may shift, helping traders time entries or exits.
Visual Interpretation
Band width = volatility: wide bands indicate strong movement; narrow bands indicate calm periods.
LSMA shows underlying trend direction, while bands show how far price has strayed from that trend.
Interpretation
The Z-Score Regression Bands provide a multi-dimensional view of market behavior:
Trend Analysis – LSMA line slope shows general market direction.
Momentum & Volatility – Z-Score indicates whether the trend is accelerating or losing strength; band width indicates volatility levels.
Price Extremes – Price touching Band #2 or #3 may suggest overextension and potential reversals.
Trend Shifts – Diamonds signal statistically significant changes in momentum.
Cycle Awareness – Standard deviation bands help distinguish normal market fluctuations from extreme events.
By combining these insights, traders can avoid false signals and react to meaningful structural shifts in the market.
Strategy Integration
Trend Following
Enter trades when diamonds indicate momentum aligns with LSMA direction.
Use Band #1 and #2 for stop placement and partial exits.
Breakout Trading
Watch for narrow bands (low volatility) followed by price pushing outside Band #1 or #2.
Confirm with Z-Score movement in the breakout direction.
Mean Reversion/Pullback
If price reaches Band #2 or #3 without continuation, expect a pullback toward LSMA.
Exhaustion & Reversals
Flattening Z-Score near zero while price remains at extreme bands signals trend weakening.
Tighten stops or scale out before a potential reversal.
Multi-Timeframe Confirmation
High timeframe LSMA confirms the main trend.
Lower timeframe bands provide refined entry and exit points.
Technical Implementation
LSMA Regression : Best-fit line minimizes lag and captures trend slope.
Z-Score Standardization : Normalizes deviation to allow consistent interpretation across markets.
Multi-Band Envelope : Three layers for normal, strong, and extreme deviations.
Trend Signals : Automatic diamonds for Z-Score zero-crossings.
Band Fill Options : Optional shading to visualize volatility expansions and contractions.
Optimal Application
Asset Classes:
Forex : Capture breakouts, overextensions, and trend shifts.
Crypto : High-volatility adaptation with adjustable band multipliers.
Stocks/ETFs : Identify trending sectors, reversals, and pullbacks.
Indices/Futures : Track cycles and structural trends.
Timeframes:
Scalping (1–5 min) : Focus on Band #1 and trend signals for fast entries.
Intraday (15m–1h) : Use Bands #1–2 for continuation and breakout trades.
Swing (4h–Daily) : Bands #2–3 capture trend momentum and exhaustion.
Position (Daily–Weekly) : LSMA trend dominates; Bands #3 highlight regime extremes.
Performance Characteristics
Strong Performance:
Trending markets with moderate-to-high volatility
Assets with steady liquidity and identifiable cycles
Weak Performance:
Flat or highly choppy markets
Very short timeframes (<1 min) dominated by noise
Integration Tips
Combine with support/resistance, volume, or order flow analysis for confirmation.
Use bands for stops, targets, or scaling positions.
Apply multi-timeframe analysis: higher timeframe LSMA confirms main trend, lower timeframe bands refine entries.
Disclaimer
The Z-Score Regression Bands is a trading analysis tool, not a guaranteed profit system. Its effectiveness depends on market conditions, parameter selection, and disciplined risk management. Use it as part of a broader trading strategy, not in isolation.
Dodge Trend [MyTradingCoder]Introducing the "Dodge Trend" indicator, an innovative variant of the Supertrend indicator designed to help traders better avoid fakeouts and maintain positions in established trends.
Like the Supertrend, the Dodge Trend uses Average True Range (ATR) but incorporates a unique adaptive adjustment feature that differentiates it from its counterparts. While the conventional Supertrend rises with the trend and only descends when the price crosses it, the Dodge Trend is designed to 'dodge' potential fakeouts.
This 'dodging' mechanism works by allowing the Dodge Trend to fall slightly during pullbacks, reducing the risk of a premature exit due to a temporary price drop. The recovery rate after the pullback is quicker but is slightly lower than the rate at which a new Dodge Trend high would be established in an uptrend. This unique adjustment feature allows the Dodge Trend to chase price action in an exponential fashion, potentially enabling a quicker exit when the trend shifts.
Key Settings:
Length: Adjust how much price action is taken into consideration for the ATR average. Lower values yield higher responsiveness to recent price action.
Size: Determines the initial deviation of the Dodge Trend when it resets after every flip/break.
Source: Specifies the data point (close, high, open, low, hl2, etc.) used for the Dodge Trend.
Dodge Intensity: Adjusts the intensity of the pullback effect. Higher values result in more intense pullbacks. Range is limited between 0 and 99, with 95 as the recommended default.
Bullish Color Setting: Sets the color for the uptrend Dodge Trend.
Bearish Color Setting: Sets the color for the downtrend Dodge Trend.
Dodge Trend is a powerful tool for traders looking to ride trends and avoid unnecessary exits due to short-term price fluctuations. While it offers a unique feature that may potentially improve trading outcomes, it should be used in conjunction with other indicators and analysis methods for a comprehensive trading strategy. As with all tools, it does not guarantee profitable trades but aims to give traders more actionable and precise information to base their decisions on.
Experience trend-following in a more adaptive and efficient manner with the Dodge Trend indicator, a tool designed to help you 'dodge' false exits and stay in line with the overall trend.

Opposing Candle V2🟩 OC (Opposing Candle) Multi–Timeframe Framework
🔍 Overview
The OC Indicator automatically detects and displays Opposing Candles (OCs) across up to three timeframes.
An Opposing Candle is a candle that fully engulfs the previous one, signaling a potential shift in control — either a trend continuation or a trend reversal.
This multi–timeframe framework gives traders a structured way to visualize displacement, pullbacks, and momentum shifts between timeframes.
⚙️ How It Works
Each OC is drawn as a box showing:
High & Low → The candle’s full range
Open Line (black) → Key control level
Midline (white) → Candle equilibrium
Optional labels for timeframe and session
You can enable up to 3 timeframes (e.g., 30m / 1H / 4H) and adjust how many OCs to display for each.
📈 Trading Framework
🔹 Continuation Setup (Trend Following)
1. 4H Bias → Bullish or Bearish
Identify clear trend structure (HH/HL = bullish, LH/LL = bearish).
Confirm strong displacement and visible gaps between OCs — signs of momentum and healthy trend continuation.
2. 1H Confirmation OC
OC forms in the direction of the 4H bias, confirming control.
3. 30min Pullback OC
Opposite–colored OC appears → represents the pullback.
4. Entry Trigger
A yellow candle closes beyond the 30min OC open line, confirming the end of the pullback.
→ Enter in trend direction.
🎯 Targets
Target 1: Next 1H OC high or low (in trend direction)
Target 2: Next 4H OC high or low
🛑 Stop: Beyond the 30min OC’s opposite wick
🔹 Reversal Setup (Trend Shift)
1. 4H Structure → Extended or Losing Momentum
When there are no higher–timeframe gaps and no displacement, momentum weakens — often a sign of potential reversal.
2. Opposing OC Forms on HTF
A strong engulfing OC appears against the previous trend at a key structural level.
3. Lower–Timeframe Alignment
1H and 30min OCs begin forming in the new direction, confirming control shift.
4. Entry Trigger
Break of the lower–timeframe OC open line signals the reversal confirmation.
🟢 Example: Bullish Reversal
4H downtrend shows compression (no displacement)
4H bullish OC forms at support
30min breaks above a bearish OC’s open line → Go long
🔴 Example: Bearish Reversal
4H uptrend stalls at resistance
4H bearish OC forms
30min breaks below a bullish OC’s open line → Go short
🎯 Targets
Target 1: Nearest opposing 1H OC high/low
Target 2: Major 4H structural high/low
🛑 Stop: Beyond the reversal OC wick
🧠 Key Concepts
Displacement = Strength. Strong, impulsive moves with clear gaps between OCs show continuation.
Compression = Weakness. Overlapping candles and no HTF displacement often hint at reversal.
OC = Control Candle. The open line is the “line in the sand” — when price breaks it, control flips.
Multi–TF Confluence = Precision. 4H → 1H → 30m gives you structure → confirmation → entry accuracy.
🎨 Features
✅ Multi–Timeframe OC detection (default: 30m / 1H / 4H)
✅ Bullish & Bearish boxes with open and midlines
✅ Break candles highlighted yellow
✅ Optional labels (timeframe + session)
✅ Session filters (Asia, London, NYAM, NYPM)
✅ Fully customizable visuals and extension lengths

PolyFilter [BackQuant]PolyFilter
A flexible, low-lag trend filter with three smoothing engines—optimized for clean bias, fewer whipsaws, and clear alerting.
What it does
PolyFilter draws a single “intelligent” baseline that adapts to price while suppressing noise. You choose the engine— Fractional MA , Ehlers 2-Pole Super Smoother , or a Multi-Kernel blend . The line can color itself by slope (trend) or by position vs price (above/below), and you get four ready-made alerts for flips and crosses.
What it plots
PolyFilter line — your smoothed trend baseline (width set by “Line Width”).
Optional candle & background coloring — choose: color by trend slope or by whether price is above/below the filter.
Signal markers — Arrows with L/S when the slope flips or when price crosses the line (if you enable shapes/alerts).
How the three engines differ
Fractional MA (experimental) — A power-law weighting of past bars (heavier focus on the most recent samples without throwing away history). The Adaptation Speed acts like the “fraction” exponent (default 0.618). Lower values lean more on recent bars; higher values spread weight further back.
Ehlers 2-Pole Super Smoother — Classic low-lag IIR smoother that aggressively reduces high-frequency noise while preserving turns. Great default when you want a steady, responsive baseline with minimal parameter fuss.
Multi-Kernel — A 70/30 blend of a Gaussian window and an exponential kernel. The Gaussian contributes smooth structure; the exponential adds a hint of responsiveness. Useful for assets that oscillate but still trend.
Reading the colors
Trend mode (default) — Line & candles turn green while the filter is rising (signal > signal ) and red while it’s falling.
Above/Below mode — Line & candles reflect price’s position relative to the filter: green when price > filter, red when price < filter. This is handy if you treat the filter like a dynamic “fair value” or bias line.
Inputs you’ll actually use
Calculation Settings
Price Source — Default HLC/3. Switch to Close for stricter trend, or HLC3/HL2 to soften single-print spikes.
Filter Length — Window/period for all engines. Shorter = snappier turns; longer = smoother line.
Adaptation Speed — Only affects Fractional MA . Lower it for faster, more local weighting; raise it for smoother, more global weighting.
Filter Type — Pick one of: Fractional MA, Ehlers 2-Pole, Multi-Kernel.
UI & Plotting
Color based off… — Choose Trend (slope) or > or < Close (position vs price).
Long/Short Colors — Customize bull/bear hues to your theme.
Show Filter Line / Paint candles / Color background — Visual toggles for the line, bars, and backdrop.
Line Width — Make the filter stand out (2–3 works well on most charts).
Signals & Alerts
PolyFilter Trend Up — Slope flips upward (the filter crosses above its prior value). Good for early continuation entries or stop-tightening on shorts.
PolyFilter Trend Down — Slope flips downward. Often used to scale out longs or rotate bias.
PolyFilter Above Price — The filter line crosses up through price (filter > price). This can confirm that mean has “caught up” after a pullback.
PolyFilter Below Price — The filter line crosses down through price (filter < price). Useful to confirm momentum loss on bounces.
Quick starts (suggested presets)
Intraday (5–15m, crypto or indices) — Ehlers 2-Pole, Length 55–80. Trend coloring ON, candle paint ON. Look for pullbacks to a rising filter; avoid fading a falling one.
Swing (1H–4H) — Multi-Kernel, Length 80–120. Background color OFF (cleaner), candle paint ON. Add a higher-TF confirmation (e.g., 4H filter rising when you trade 1H).
Range-prone FX — Fractional MA, Length 70–100, Adaptation ~0.55–0.70. Consider Above/Below mode to trade mean reversion to the line with a strict risk cap.
How to use it in practice
Bias line — Trade in the direction of the filter slope; stand aside when it flattens and color chops back and forth.
Dynamic support/resistance — Treat the line as a moving value area. In trends, entries often appear on shallow tags of the line with structure confluence.
Regime switch — When the filter flips and holds color for several bars, tighten stops on the opposing side and look for first pullback in the new color.
Stacking filters — Many users run PolyFilter on the active chart and a slower instance (longer length) on a higher timeframe as a “macro bias” guardrail.
Tuning tips
If you see too many flips, lengthen the filter or switch to Multi-Kernel.
If turns feel late, shorten the filter or try Ehlers 2-Pole for lower lag.
On thin or very noisy symbols, prefer HLC3 as the source and longer lengths.
Performance note: very large lengths increase computation time for the Multi-Kernel and Fractional engines. Start moderate and scale up only if needed.
Summary
PolyFilter gives you a single, trustworthy baseline that you can read at a glance—either as a pure trend line (slope coloring) or as a dynamic “above/below fair value” reference. Pick the engine that matches your market’s personality, set a sensible length, and let the color and alerts guide bias, entries on pullbacks, and risk on reversals.

Trend Continuation [OmegaTools]Trend Continuation is a trend-following and trend-continuation tool designed to highlight high-probability pullbacks within an existing directional bias. It helps discretionary and systematic traders visually isolate “continuation zones” where a retracement is more likely to resolve in favor of the prevailing trend rather than trigger a full reversal.
1. Concept and Objective
The indicator combines two key components:
1. A trend bias engine (based either on a Rolling VWAP regime or on swing market structure).
2. A pullback pressure model, which quantifies how deep and “aggressive” the recent retracement has been relative to the trend.
The goal is to identify moments where the market pulls back against the trend, builds enough “reversal pressure,” and then shows signs that the trend is likely to **continue** rather than flip. When specific conditions are met, the indicator highlights bars and plots reference levels that can be used as potential continuation zones, filters, or confluence areas in a broader trading plan.
2. Trend Bias Modes
The primary trend direction is defined through the `Trend Mode` input:
* **RVWAP Mode (default)**
The script computes two rolling volume-weighted average prices over different lengths:
* A **shorter-term rolling VWAP**
* A **longer-term rolling VWAP**
When the shorter RVWAP is above the longer one, the bias is set to **bullish (+1)**. When it is below, the bias is **bearish (-1)**.
This creates a smooth, volume-weighted trend definition that tends to adapt to shifting regimes and filters out minor noise.
* **Market Structure Mode**
In this mode, trend bias is derived from **pivot highs and lows**:
* When price breaks above a recent pivot high, the bias flips to **bullish (+1)**.
* When price breaks below a recent pivot low, the bias flips to **bearish (-1)**.
This approach is more structurally oriented and reacts to significant swing breaks rather than just moving-average style relationships.
If no clear condition is met, the internal bias can temporarily be neutral, though the main design assumes working with clearly bullish or bearish environments.
3. Pullback and Reversal Pressure Logic
Once the trend bias is defined, the indicator measures **pullback intensity** against that trend:
* A **lookback window (“Pullback Length”)** scans recent highs and lows:
* In an uptrend, it tracks the **highest high** over the window and measures how far the current low pulls back from that high.
* In a downtrend, it tracks the **lowest low** and measures how far the current high bounces up from that low.
* This distance is converted into a **“reversal pressure” value**:
* In a bullish bias, deeper pullbacks (lower lows relative to the recent high) indicate stronger counter-trend pressure.
* In a bearish bias, stronger rallies (higher highs relative to the recent low) indicate stronger counter-trend pressure.
The raw reversal pressure is then smoothed with a long-term moving average to separate normal retracements from **statistically significant extremes**.
4. Thresholds and Histogram Coloring
To avoid reacting to every minor pullback, the indicator builds a **dynamic threshold** using a combination of:
* Long-term averages of reversal pressure.
* Standard deviation of reversal pressure.
* High-percentile values of reversal behavior over different sample sizes.
From this, a **threshold line** is derived, and the script then compares the current reversal pressure to this adaptive level:
* The **Reversal Histogram** (column plot) represents the excess reversal pressure above its own long-term average.
* When:
* There is a valid bullish or bearish bias, and
* The histogram is above the dynamic threshold,
the bars of the histogram are **colored**:
* Blue (or a similar “positive” color) in bullish bias.
* Red/pink (or a similar “negative” color) in bearish bias.
* When reversal pressure is below threshold or bias is not relevant, the histogram remains **neutral gray**.
These colored histogram segments represent **“high-tension” pullback states**, where counter-trend pressure has reached an extreme that, historically, often resolves with the original trend continuing rather than fully reversing.
5. Continuation Level and Bar Coloring on Price Chart
To connect the oscillator logic back to the chart:
* A **continuation reference level** is computed on the price series:
* In an uptrend, this is derived by subtracting the threshold from recent highs.
* In a downtrend, it is derived by adding the threshold to recent lows.
* This level is plotted as a **line on the price chart** (only when the trend bias is stable), acting as a visual guide for:
* Potential continuation zones,
* Possible stop-placement or invalidation areas,
* Or filters for entries/exits.
The bars are then **colored** when price crosses or interacts with these levels in the direction of the trend:
* In a bullish bias, bars closing below the continuation level can be highlighted as potential **deep pullback/continuation opportunities** or as warning signals, depending on the user’s playbook.
* In a bearish bias, bars closing above the continuation level are similarly highlighted.
This makes it easy to see where the oscillator’s “extreme pullback” conditions align with structural movements on the actual price bars.
6. Embedded Win-Rate Estimation (WR Table)
The script also includes an internal **win-rate style metric (WR%)** displayed in a small table on the chart:
* It tracks occurrences where:
* A valid bullish or bearish bias is present, and
* The Reversal Histogram is **above the threshold** (i.e., histogram is colored).
* It then approximates the **probability that the trend bias does not change** following such high-pressure pullback events.
* The WR value is shown as a percentage and represents, in essence, the **historical trend-continuation rate** under these specific conditions over the most recent sample of events.
This is not a formal statistical test and does not guarantee future performance, but it provides a quick visual indication of how often these continuation setups have led to **trend persistence** in the recent past.
7. How to Use in Practice
Typical applications include:
Trend-following entries on pullbacks
Identify the main trend using either RVWAP or Market Structure mode.
Wait for a colored histogram bar (reversal pressure above threshold).
Use the continuation reference line and bar coloring on the price chart to refine entry zones or invalidation levels.
Filtering signals from other systems
Run the indicator in the background to confirm trend continuation conditions before taking signals from another strategy (e.g., breakouts or momentum entries).
Only act on long signals when the bias is bullish and a high-pressure pullback has recently occurred; similarly for short signals in bearish conditions.
Risk management and trend monitoring
Monitor when reversal pressure is building against your current position.
Use shifts in bias combined with high reversal pressure to re-evaluate or scale out of trend-following trades.
Recommended steps:
1. Choose your Trend Mode:
- RVWAP for smoother, regime-style trend detection.
- Market Structure for swing-based structural changes.
2. Adjust Trend Length and Pullback Length to match your timeframe (shorter for intraday, longer for swing/position trading).
3. Observe where histogram colors appear and how price reacts around the continuation line and highlighted bars.
4. Integrate these signals into a pre-defined trading plan with clear entry, exit, and risk rules.
8. Limitations and Disclaimer
* This tool is a **technical analysis aid**, not a complete trading system.
* Past behavior of trend continuation or reversal pressure does **not** guarantee future results.
* The embedded WR metric is a **descriptive statistic** based on recent historical conditions only; it is not a promise of performance or a robust statistical forecast.
* All parameters (lengths, thresholds, modes) are user-configurable and should be **tested and validated** on your own data, instruments, and timeframes before any live use.
Disclaimer
This indicator is provided for informational and educational purposes only and does not constitute financial, investment, or trading advice. Trading and investing in financial markets involve substantial risk, including the possible loss of all capital. You are solely responsible for your own trading decisions and for evaluating all information provided by this tool. OmegaTools and the author of this script expressly disclaim any liability for any direct or indirect loss resulting from the use of this indicator. Always consult with a qualified financial professional before making any investment decisions.

ParabolicSAR+EMA[TS_Indie]🚀 EMA + Parabolic SAR Reversal Trading Strategy
This trading system effectively combines the use of Exponential Moving Averages (EMA) with the Parabolic SAR to identify both price trends and key reversal points. The EMA Fast is used to signal the primary short-term trend, while the EMA Slow acts as a filter for the long-term trend direction. The Parabolic SAR then helps to confirm the reversal signals.
🛠️ Tools Used
1. EMA Fast – Primary Short-Term Trend
2. EMA Slow – Long-Term Trend Filter
3. Parabolic SAR – Reversal Confirmation
🎯 Entry Rules
📈 Buy Setup
1. Trend Filter: EMA Fast > EMA Slow → Uptrend
2. Pullback: Price pulls back and closes below the EMA Fast line.
3. Reversal: Price reverses/pulls back up and closes above the EMA Fast line.
4. SAR Confirmation: The previous Parabolic SAR dot is above the high, and the dot in the current candle is below the low → Reversal signal confirmed.
5. Entry: Enter Buy immediately.
📉 Sell Setup
1. Trend Filter: EMA Fast < EMA Slow → Downtrend
2. Pullback: Price pulls back and closes above the EMA Fast line.
3. Reversal: Price reverses/pulls back down and closes below the EMA Fast line.
4. SAR Confirmation: The previous Parabolic SAR dot is below the low, and the dot in the current candle is above the high → Reversal signal confirmed.
5. Entry: Enter Sell immediately.
💰 Exit Management (Entry, Stop Loss, Take Profit)
1. Entry: Enter the order at the closing price of the signal candle.
2. Stop Loss (SL): Set the Stop Loss at the Parabolic SAR dot.
3. Take Profit (TP): Calculated from the Entry and Stop Loss points, multiplied by the Risk Reward Ratio.
⚙️ Optional Parameters
➭ Custom Risk/Reward Ratio for Take Profit.
➭ Option to add an ATR buffer to the Stop Loss.
➭ Adjustable EMA Fast period.
➭ Adjustable EMA Slow period.
➭ Adjustable Parabolic SAR parameters.
➭ Option to enable Long-only / Short-only positions.
➭ Customizable Backtest start and end date.
➭ Customizable trading session time.
🔔 Alert Function
Alerts display:
➭ Entry Price
➭ Stop Loss Price
➭ Take Profit Price
💡 This strategy allows for many parameter adjustments, such as the MA type, adding/subtracting from the Stop Loss using ATR, and selecting specific sessions for backtesting. If you find interesting or profitable results after adjusting the parameters, please share your comments with other traders!
⚠️ Disclaimer
This indicator is designed for educational and research purposes only. It does not guarantee profits and should not be considered financial advice. Trading in financial markets involves significant risk , including the potential loss of capital.

Reduced-Lag Chande Momentum Oscillator [BOSWaves]Reduced-Lag Chande Momentum Oscillator – Adaptive Momentum Geometry with Reduced-Latency Reversion Logic
Overview
The Reduced-Lag Chande Momentum Oscillator represents a sophisticated extension of the classical Chande Momentum Oscillator, preserving the foundational measurement of net directional pressure while addressing inherent limitations in lag, noise, and signal clarity. The traditional CMO provides reliable snapshots of upward versus downward force but reacts slowly to rapid market accelerations and can obscure meaningful momentum inflections with delayed readings. This iteration integrates a dual-stage reduced-lag filter, optional advanced smoothing, and acceleration-based analytics, producing a real-time, multi-dimensional representation of market momentum.
The design reframes classical momentum using a layered curvature and gradient structure - main, midline, and shadow - to show trajectory, velocity, and intensity in one view. Instead of the usual ±70/30 extremes, it uses ±50 as a statistically grounded threshold where one side of the market begins exerting true dominance. This captures structural imbalance more reliably, exposing exhaustion and actionable inflection without amplifying noise.
This visualization gives traders a continuous, responsive read on market structure, revealing not just direction but rate of change, acceleration alignment, and curvature behavior. The oscillator becomes a momentum map, expressing both probability and intensity behind directional shifts.
Where conventional oscillators mislabel short-lived swings as signals, the Reduced-Lag CMO separates baseline shifts from high-conviction transitions, enabling cleaner, more decisive signal interpretation.
Theoretical Foundation
The classical Chande Momentum Oscillator, created by Tushar Chande, calculates the normalized net difference between consecutive upward and downward price changes over a defined window, generating readings from –100 to +100. While effective for capturing basic directional pressure, the unmodified CMO suffers from signal latency and sensitivity to abrupt market swings, which can obscure actionable inflection points.
The Reduced-Lag CMO augments this foundation with three key mechanisms:
Reduced-Lag Filtering : A dual-EMA structure eliminates inertial lag, aligning the oscillator curve closely with real-time market momentum without producing overshoot artifacts.
Smoothing Architecture : Optional SMA, EMA, or WMA smoothing is applied post-filter, balancing noise reduction with trajectory fidelity. A multi-layer line system (shadow → midline → main) communicates depth, curvature, and gradient dynamics.
Acceleration Integration : First and second derivatives of the smoothed curve quantify velocity and acceleration, allowing the indicator to identify not only momentum flips but the force behind each shift, forming the basis for the strong-signal overlay.
The combination of these mechanisms produces an oscillator that respects the original CMO framework while delivering real-time, context-sensitive intelligence. The ±50 boundaries are selected as the statistically validated pressure zones where directional dominance exceeds neutral oscillation. Crosses and rejections at these boundaries are not arbitrary overbought/oversold events, but measurable imbalances with actionable significance.
How It Works
The Reduced-Lag CMO is constructed through a multi-stage process:
Momentum Estimation Core : Raw CMO values are calculated and then passed through a reduced-lag filter to remove delay, creating a curve that closely tracks instantaneous directional pressure.
Smoothing & Layered Representation : The filtered curve can be smoothed and split into three layers - shadow, midline, and main - giving visual depth, trajectory clarity, and curvature instead of a single-line oscillator.
Gradient-Based Pressure Mapping : Color gradients encode momentum strength and polarity. Green-yellow transitions highlight increasing upward dominance, while red-yellow transitions indicate weakening downward force.
Pressure-Zone Anchoring (±50) : The system defines statistically significant pressure zones at ±50. Moves beyond these levels reflect dominant directional control, and rejections inside the zone signal potential exhaustion.
Signal Generation : Momentum events are evaluated through velocity and acceleration. Standard signals appear as triangle markers indicating validated momentum flips. Strong signals appear as triangles with diamonds when acceleration confirms a high-conviction transition.
A cooldown rule spaces signals apart to reduce clutter and emphasize structurally meaningful events.
Interpretation
The Reduced-Lag CMO reframes momentum as a dynamic equilibrium between directional force and structural pressure:
Positive Momentum Phases : Curves above zero with green-yellow gradients indicate sustained upward pressure. Shallow retracements or midline tests denote controlled pullbacks.
Negative Momentum Phases : Curves below zero with red-yellow gradients show downward dominance. Rejections from –50 highlight potential exhaustion and reversal readiness.
Pressure-Zone Dynamics (±50) : Crosses beyond ±50 confirm dominant directional force. Meanwhile, rejections and rotations inside the zone signal structural fatigue.
Velocity & Acceleration Analysis : Rising momentum with decelerating velocity suggests fading force; acceleration alignment amplifies signal strength and forms the basis of strong signals.
Signal Architecture
The Reduced-Lag CMO produces a single event type with two intensities: a validated momentum inflection.
Standard Signals - Triangles:
Triggered by momentum flips confirmed by velocity.
Represent moderate-intensity directional changes.
Appear at zero-line crosses or ±50 rejections with aligned velocity.
Strong Signals Triangles + Diamonds:
Triggered when acceleration confirms the directional change.
Represent high-intensity, high-conviction shifts.
Rare by design; indicate robust momentum inflections.
Cooldown mechanics prevent repeated signals in short succession, emphasizing structural reliability over noise.
Strategy Integration
Trend Confirmation : Align zero-line flips with higher-timeframe directional bias.
Reversal Detection : Strong signals from ±50 zones highlight potential inflection points.
Volatility Assessment : Gradient transitions reveal strengthening or weakening momentum.
Pullback Timing : Multi-layer curvature identifies controlled retracements vs trend exhaustion.
Confluence Mapping : Pair with structure-based indicators to filter signals in context.
Technical Implementation Details
Core Engine : Classical CMO with Ehlers reduced-lag extension
Lag Reduction : Dual EMA filtering
Smoothing : Optional SMA/EMA/WMA post-filter
Multi-Layer Curve : Shadow, midline, main
Signal System : Two-tier momentum-acceleration framework
Pressure Zones : ±50 statistically validated thresholds
Cooldown Logic : Bar-indexed suppression
Gradient Mapping : Encodes magnitude and direction
Alerts : Standard and strong signals
Optimal Application Parameters
Timeframes:
1 - 5 min : Intraday momentum tracking
15 - 60 min : Trend rotations & volatility transitions
4H - Daily : Macro momentum exhaustion & re-accumulation mapping
Suggested Ranges:
CMO Length : 7 - 12
Reduced-Lag Length : 5 - 15
Smoothing : 10 - 20
Cooldown Bars : 5 - 15
Performance Characteristics
High Effectiveness:
Markets with directional pulses & clean pressure transitions
Trending phases with measurable pullbacks
Instruments with stable volatility cycles
Reduced Edge:
Choppy consolidations
Ultra-low volatility environments
Disclaimer
The Reduced-Lag Chande Momentum Oscillator is a professional-grade analytical tool. It is not predictive and carries no guaranteed profitability. Effectiveness depends on asset class, volatility regime, parameter selection, and disciplined execution. Any suggested application timeframes or recommended ranges are guidance only - they are not universally optimal and will not deliver consistent accuracy on every asset or market condition. BOSWaves recommends using it in conjunction with structure, liquidity, and momentum context.

Hellenic EMA Matrix - PremiumHellenic EMA Matrix - Alpha Omega Premium
Complete User Guide
Table of Contents
Introduction
Indicator Philosophy
Mathematical Constants
EMA Types
Settings
Trading Signals
Visualization
Usage Strategies
FAQ
Introduction
Hellenic EMA Matrix is a premium indicator based on mathematical constants of nature: Phi (Phi - Golden Ratio), Pi (Pi), e (Euler's number). The indicator uses these universal constants to create dynamic EMAs that adapt to the natural rhythms of the market.
Key Features:
6 EMA types based on mathematical constants
Premium visualization with Neon Glow and Gradient Clouds
Automatic Fast/Mid/Slow EMA sorting
STRONG signals for powerful trends
Pulsing Ribbon Bar for instant trend assessment
Works on all timeframes (M1 - MN)
Indicator Philosophy
Why Mathematical Constants?
Traditional EMAs use arbitrary periods (9, 21, 50, 200). Hellenic Matrix goes further, using universal mathematical constants found in nature:
Phi (1.618) - Golden Ratio: galaxy spirals, seashells, human body proportions
Pi (3.14159) - Pi: circles, waves, cycles
e (2.71828) - Natural logarithm base: exponential growth, radioactive decay
Markets are also a natural system composed of millions of participants. Using mathematical constants allows tuning into the natural rhythms of market cycles.
Mathematical Constants
Phi (Phi) - Golden Ratio
Phi = 1.618033988749895
Properties:
Phi² = Phi + 1 = 2.618
Phi³ = 4.236
Phi⁴ = 6.854
Application: Ideal for trending movements and Fibonacci corrections
Pi (Pi) - Pi Number
Pi = 3.141592653589793
Properties:
2Pi = 6.283 (full circle)
3Pi = 9.425
4Pi = 12.566
Application: Excellent for cyclical markets and wave structures
e (Euler) - Euler's Number
e = 2.718281828459045
Properties:
e² = 7.389
e³ = 20.085
e⁴ = 54.598
Application: Suitable for exponential movements and volatile markets
EMA Types
1. Phi (Phi) - Golden Ratio EMA
Description: EMA based on the golden ratio
Period Formula:
Period = Phi^n × Base Multiplier
Parameters:
Phi Power Level (1-8): Power of Phi
Phi¹ = 1.618 → ~16 period (with Base=10)
Phi² = 2.618 → ~26 period
Phi³ = 4.236 → ~42 period (recommended)
Phi⁴ = 6.854 → ~69 period
Recommendations:
Phi² or Phi³ for day trading
Phi⁴ or Phi⁵ for swing trading
Works excellently as Fast EMA
2. Pi (Pi) - Circular EMA
Description: EMA based on Pi for cyclical movements
Period Formula:
Period = Pi × Multiple × Base Multiplier
Parameters:
Pi Multiple (1-10): Pi multiplier
1Pi = 3.14 → ~31 period (with Base=10)
2Pi = 6.28 → ~63 period (recommended)
3Pi = 9.42 → ~94 period
Recommendations:
2Pi ideal as Mid or Slow EMA
Excellently identifies cycles and waves
Use on volatile markets (crypto, forex)
3. e (Euler) - Natural EMA
Description: EMA based on natural logarithm
Period Formula:
Period = e^n × Base Multiplier
Parameters:
e Power Level (1-6): Power of e
e¹ = 2.718 → ~27 period (with Base=10)
e² = 7.389 → ~74 period (recommended)
e³ = 20.085 → ~201 period
Recommendations:
e² works excellently as Slow EMA
Ideal for stocks and indices
Filters noise well on lower timeframes
4. Delta (Delta) - Adaptive EMA
Description: Adaptive EMA that changes period based on volatility
Period Formula:
Period = Base Period × (1 + (Volatility - 1) × Factor)
Parameters:
Delta Base Period (5-200): Base period (default 20)
Delta Volatility Sensitivity (0.5-5.0): Volatility sensitivity (default 2.0)
How it works:
During low volatility → period decreases → EMA reacts faster
During high volatility → period increases → EMA smooths noise
Recommendations:
Works excellently on news and sharp movements
Use as Fast EMA for quick adaptation
Sensitivity 2.0-3.0 for crypto, 1.0-2.0 for stocks
5. Sigma (Sigma) - Composite EMA
Description: Composite EMA combining multiple active EMAs
Composition Methods:
Weighted Average (default):
Sigma = (Phi + Pi + e + Delta) / 4
Simple average of all active EMAs
Geometric Mean:
Sigma = fourth_root(Phi × Pi × e × Delta)
Geometric mean (more conservative)
Harmonic Mean:
Sigma = 4 / (1/Phi + 1/Pi + 1/e + 1/Delta)
Harmonic mean (more weight to smaller values)
Recommendations:
Enable for additional confirmation
Use as Mid EMA
Weighted Average - most universal method
6. Lambda (Lambda) - Wave EMA
Description: Wave EMA with sinusoidal period modulation
Period Formula:
Period = Base Period × (1 + Amplitude × sin(2Pi × bar / Frequency))
Parameters:
Lambda Base Period (10-200): Base period
Lambda Wave Amplitude (0.1-2.0): Wave amplitude
Lambda Wave Frequency (10-200): Wave frequency in bars
How it works:
Period pulsates sinusoidally
Creates wave effect following market cycles
Recommendations:
Experimental EMA for advanced users
Works well on cyclical markets
Frequency = 50 for day trading, 100+ for swing
Settings
Matrix Core Settings
Base Multiplier (1-100)
Multiplies all EMA periods
Base = 1: Very fast EMAs (Phi³ = 4, 2Pi = 6, e² = 7)
Base = 10: Standard (Phi³ = 42, 2Pi = 63, e² = 74)
Base = 20: Slow EMAs (Phi³ = 85, 2Pi = 126, e² = 148)
Recommendations by timeframe:
M1-M5: Base = 5-10
M15-H1: Base = 10-15 (recommended)
H4-D1: Base = 15-25
W1-MN: Base = 25-50
Matrix Source
Data source selection for EMA calculation:
close - closing price (standard)
open - opening price
high - high
low - low
hl2 - (high + low) / 2
hlc3 - (high + low + close) / 3
ohlc4 - (open + high + low + close) / 4
When to change:
hlc3 or ohlc4 for smoother signals
high for aggressive longs
low for aggressive shorts
Manual EMA Selection
Critically important setting! Determines which EMAs are used for signal generation.
Use Manual Fast/Slow/Mid Selection
Enabled (default): You select EMAs manually
Disabled: Automatic selection by periods
Fast EMA
Fast EMA - reacts first to price changes
Recommendations:
Phi Golden (recommended) - universal choice
Delta Adaptive - for volatile markets
Must be fastest (smallest period)
Slow EMA
Slow EMA - determines main trend
Recommendations:
Pi Circular (recommended) - excellent trend filter
e Natural - for smoother trend
Must be slowest (largest period)
Mid EMA
Mid EMA - additional signal filter
Recommendations:
e Natural (recommended) - excellent middle level
Pi Circular - alternative
None - for more frequent signals (only 2 EMAs)
IMPORTANT: The indicator automatically sorts selected EMAs by their actual periods:
Fast = EMA with smallest period
Mid = EMA with middle period
Slow = EMA with largest period
Therefore, you can select any combination - the indicator will arrange them correctly!
Premium Visualization
Neon Glow
Enable Neon Glow for EMAs - adds glowing effect around EMA lines
Glow Strength:
Light - subtle glow
Medium (recommended) - optimal balance
Strong - bright glow (may be too bright)
Effect: 2 glow layers around each EMA for 3D effect
Gradient Clouds
Enable Gradient Clouds - fills space between EMAs with gradient
Parameters:
Cloud Transparency (85-98): Cloud transparency
95-97 (recommended)
Higher = more transparent
Dynamic Cloud Intensity - automatically changes transparency based on EMA distance
Cloud Colors:
Phi-Pi Cloud:
Blue - when Pi above Phi (bullish)
Gold - when Phi above Pi (bearish)
Pi-e Cloud:
Green - when e above Pi (bullish)
Blue - when Pi above e (bearish)
2 layers for volumetric effect
Pulsing Ribbon Bar
Enable Pulsing Indicator Bar - pulsing strip at bottom/top of chart
Parameters:
Ribbon Position: Top / Bottom (recommended)
Pulse Speed: Slow / Medium (recommended) / Fast
Symbols and colors:
Green filled square - STRONG BULLISH
Pink filled square - STRONG BEARISH
Blue hollow square - Bullish (regular)
Red hollow square - Bearish (regular)
Purple rectangle - Neutral
Effect: Pulsation with sinusoid for living market feel
Signal Bar Highlights
Enable Signal Bar Highlights - highlights bars with signals
Parameters:
Highlight Transparency (88-96): Highlight transparency
Highlight Style:
Light Fill (recommended) - bar background fill
Thin Line - bar outline only
Highlights:
Golden Cross - green
Death Cross - pink
STRONG BUY - green
STRONG SELL - pink
Show Greek Labels
Shows Greek alphabet letters on last bar:
Phi - Phi EMA (gold)
Pi - Pi EMA (blue)
e - Euler EMA (green)
Delta - Delta EMA (purple)
Sigma - Sigma EMA (pink)
When to use: For education or presentations
Show Old Background
Old background style (not recommended):
Green background - STRONG BULLISH
Pink background - STRONG BEARISH
Blue background - Bullish
Red background - Bearish
Not recommended - use new Gradient Clouds and Pulsing Bar
Info Table
Show Info Table - table with indicator information
Parameters:
Position: Top Left / Top Right (recommended) / Bottom Left / Bottom Right
Size: Tiny / Small (recommended) / Normal / Large
Table contents:
EMA list - periods and current values of all active EMAs
Effects - active visual effects
TREND - current trend state:
STRONG UP - strong bullish
STRONG DOWN - strong bearish
Bullish - regular bullish
Bearish - regular bearish
Neutral - neutral
Momentum % - percentage deviation of price from Fast EMA
Setup - current Fast/Slow/Mid configuration
Trading Signals
Show Golden/Death Cross
Golden Cross - Fast EMA crosses Slow EMA from below (bullish signal) Death Cross - Fast EMA crosses Slow EMA from above (bearish signal)
Symbols:
Yellow dot "GC" below - Golden Cross
Dark red dot "DC" above - Death Cross
Show STRONG Signals
STRONG BUY and STRONG SELL - the most powerful indicator signals
Conditions for STRONG BULLISH:
EMA Alignment: Fast > Mid > Slow (all EMAs aligned)
Trend: Fast > Slow (clear uptrend)
Distance: EMAs separated by minimum 0.15%
Price Position: Price above Fast EMA
Fast Slope: Fast EMA rising
Slow Slope: Slow EMA rising
Mid Trending: Mid EMA also rising (if enabled)
Conditions for STRONG BEARISH:
Same but in reverse
Visual display:
Green label "STRONG BUY" below bar
Pink label "STRONG SELL" above bar
Difference from Golden/Death Cross:
Golden/Death Cross = crossing moment (1 bar)
STRONG signal = sustained trend (lasts several bars)
IMPORTANT: After fixes, STRONG signals now:
Work on all timeframes (M1 to MN)
Don't break on small retracements
Work with any Fast/Mid/Slow combination
Automatically adapt thanks to EMA sorting
Show Stop Loss/Take Profit
Automatic SL/TP level calculation on STRONG signal
Parameters:
Stop Loss (ATR) (0.5-5.0): ATR multiplier for stop loss
1.5 (recommended) - standard
1.0 - tight stop
2.0-3.0 - wide stop
Take Profit R:R (1.0-5.0): Risk/reward ratio
2.0 (recommended) - standard (risk 1.5 ATR, profit 3.0 ATR)
1.5 - conservative
3.0-5.0 - aggressive
Formulas:
LONG:
Stop Loss = Entry - (ATR × Stop Loss ATR)
Take Profit = Entry + (ATR × Stop Loss ATR × Take Profit R:R)
SHORT:
Stop Loss = Entry + (ATR × Stop Loss ATR)
Take Profit = Entry - (ATR × Stop Loss ATR × Take Profit R:R)
Visualization:
Red X - Stop Loss
Green X - Take Profit
Levels remain active while STRONG signal persists
Trading Signals
Signal Types
1. Golden Cross
Description: Fast EMA crosses Slow EMA from below
Signal: Beginning of bullish trend
How to trade:
ENTRY: On bar close with Golden Cross
STOP: Below local low or below Slow EMA
TARGET: Next resistance level or 2:1 R:R
Strengths:
Simple and clear
Works well on trending markets
Clear entry point
Weaknesses:
Lags (signal after movement starts)
Many false signals in ranging markets
May be late on fast moves
Optimal timeframes: H1, H4, D1
2. Death Cross
Description: Fast EMA crosses Slow EMA from above
Signal: Beginning of bearish trend
How to trade:
ENTRY: On bar close with Death Cross
STOP: Above local high or above Slow EMA
TARGET: Next support level or 2:1 R:R
Application: Mirror of Golden Cross
3. STRONG BUY
Description: All EMAs aligned + trend + all EMAs rising
Signal: Powerful bullish trend
How to trade:
ENTRY: On bar close with STRONG BUY or on pullback to Fast EMA
STOP: Below Fast EMA or automatic SL (if enabled)
TARGET: Automatic TP (if enabled) or by levels
TRAILING: Follow Fast EMA
Entry strategies:
Aggressive: Enter immediately on signal
Conservative: Wait for pullback to Fast EMA, then enter on bounce
Pyramiding: Add positions on pullbacks to Mid EMA
Position management:
Hold while STRONG signal active
Exit on STRONG SELL or Death Cross appearance
Move stop behind Fast EMA
Strengths:
Most reliable indicator signal
Doesn't break on pullbacks
Catches large moves
Works on all timeframes
Weaknesses:
Appears less frequently than other signals
Requires confirmation (multiple conditions)
Optimal timeframes: All (M5 - D1)
4. STRONG SELL
Description: All EMAs aligned down + downtrend + all EMAs falling
Signal: Powerful bearish trend
How to trade: Mirror of STRONG BUY
Visual Signals
Pulsing Ribbon Bar
Quick market assessment at a glance:
Symbol Color State
Filled square Green STRONG BULLISH
Filled square Pink STRONG BEARISH
Hollow square Blue Bullish
Hollow square Red Bearish
Rectangle Purple Neutral
Pulsation: Sinusoidal, creates living effect
Signal Bar Highlights
Bars with signals are highlighted:
Green highlight: STRONG BUY or Golden Cross
Pink highlight: STRONG SELL or Death Cross
Gradient Clouds
Colored space between EMAs shows trend strength:
Wide clouds - strong trend
Narrow clouds - weak trend or consolidation
Color change - trend change
Info Table
Quick reference in corner:
TREND: Current state (STRONG UP, Bullish, Neutral, Bearish, STRONG DOWN)
Momentum %: Movement strength
Effects: Active visual effects
Setup: Fast/Slow/Mid configuration
Usage Strategies
Strategy 1: "Golden Trailing"
Idea: Follow STRONG signals using Fast EMA as trailing stop
Settings:
Fast: Phi Golden (Phi³)
Mid: Pi Circular (2Pi)
Slow: e Natural (e²)
Base Multiplier: 10
Timeframe: H1, H4
Entry rules:
Wait for STRONG BUY
Enter on bar close or on pullback to Fast EMA
Stop below Fast EMA
Management:
Hold position while STRONG signal active
Move stop behind Fast EMA daily
Exit on STRONG SELL or Death Cross
Take Profit:
Partially close at +2R
Trail remainder until exit signal
For whom: Swing traders, trend followers
Pros:
Catches large moves
Simple rules
Emotionally comfortable
Cons:
Requires patience
Possible extended drawdowns on pullbacks
Strategy 2: "Scalping Bounces"
Idea: Scalp bounces from Fast EMA during STRONG trend
Settings:
Fast: Delta Adaptive (Base 15, Sensitivity 2.0)
Mid: Phi Golden (Phi²)
Slow: Pi Circular (2Pi)
Base Multiplier: 5
Timeframe: M5, M15
Entry rules:
STRONG signal must be active
Wait for price pullback to Fast EMA
Enter on bounce (candle closes above/below Fast EMA)
Stop behind local extreme (15-20 pips)
Take Profit:
+1.5R or to Mid EMA
Or to next level
For whom: Active day traders
Pros:
Many signals
Clear entry point
Quick profits
Cons:
Requires constant monitoring
Not all bounces work
Requires discipline for frequent trading
Strategy 3: "Triple Filter"
Idea: Enter only when all 3 EMAs and price perfectly aligned
Settings:
Fast: Phi Golden (Phi³)
Mid: e Natural (e²)
Slow: Pi Circular (3Pi)
Base Multiplier: 15
Timeframe: H4, D1
Entry rules (LONG):
STRONG BUY active
Price above all three EMAs
Fast > Mid > Slow (all aligned)
All EMAs rising (slope up)
Gradient Clouds wide and bright
Entry:
On bar close meeting all conditions
Or on next pullback to Fast EMA
Stop:
Below Mid EMA or -1.5 ATR
Take Profit:
First target: +3R
Second target: next major level
Trailing: Mid EMA
For whom: Conservative swing traders, investors
Pros:
Very reliable signals
Minimum false entries
Large profit potential
Cons:
Rare signals (2-5 per month)
Requires patience
Strategy 4: "Adaptive Scalper"
Idea: Use only Delta Adaptive EMA for quick volatility reaction
Settings:
Fast: Delta Adaptive (Base 10, Sensitivity 3.0)
Mid: None
Slow: Delta Adaptive (Base 30, Sensitivity 2.0)
Base Multiplier: 3
Timeframe: M1, M5
Feature: Two different Delta EMAs with different settings
Entry rules:
Golden Cross between two Delta EMAs
Both Delta EMAs must be rising/falling
Enter on next bar
Stop:
10-15 pips or below Slow Delta EMA
Take Profit:
+1R to +2R
Or Death Cross
For whom: Scalpers on cryptocurrencies and forex
Pros:
Instant volatility adaptation
Many signals on volatile markets
Quick results
Cons:
Much noise on calm markets
Requires fast execution
High commissions may eat profits
Strategy 5: "Cyclical Trader"
Idea: Use Pi and Lambda for trading cyclical markets
Settings:
Fast: Pi Circular (1Pi)
Mid: Lambda Wave (Base 30, Amplitude 0.5, Frequency 50)
Slow: Pi Circular (3Pi)
Base Multiplier: 10
Timeframe: H1, H4
Entry rules:
STRONG signal active
Lambda Wave EMA synchronized with trend
Enter on bounce from Lambda Wave
For whom: Traders of cyclical assets (some altcoins, commodities)
Pros:
Catches cyclical movements
Lambda Wave provides additional entry points
Cons:
More complex to configure
Not for all markets
Lambda Wave may give false signals
Strategy 6: "Multi-Timeframe Confirmation"
Idea: Use multiple timeframes for confirmation
Scheme:
Higher TF (D1): Determine trend direction (STRONG signal)
Middle TF (H4): Wait for STRONG signal in same direction
Lower TF (M15): Look for entry point (Golden Cross or bounce from Fast EMA)
Settings for all TFs:
Fast: Phi Golden (Phi³)
Mid: e Natural (e²)
Slow: Pi Circular (2Pi)
Base Multiplier: 10
Rules:
All 3 TFs must show one trend
Entry on lower TF
Stop by lower TF
Target by higher TF
For whom: Serious traders and investors
Pros:
Maximum reliability
Large profit targets
Minimum false signals
Cons:
Rare setups
Requires analysis of multiple charts
Experience needed
Practical Tips
DOs
Use STRONG signals as primary - they're most reliable
Let signals develop - don't exit on first pullback
Use trailing stop - follow Fast EMA
Combine with levels - S/R, Fibonacci, volumes
Test on demo before real
Adjust Base Multiplier for your timeframe
Enable visual effects - they help see the picture
Use Info Table - quick situation assessment
Watch Pulsing Bar - instant state indicator
Trust auto-sorting of Fast/Mid/Slow
DON'Ts
Don't trade against STRONG signal - trend is your friend
Don't ignore Mid EMA - it adds reliability
Don't use too small Base Multiplier on higher TFs
Don't enter on Golden Cross in range - check for trend
Don't change settings during open position
Don't forget risk management - 1-2% per trade
Don't trade all signals in row - choose best ones
Don't use indicator in isolation - combine with Price Action
Don't set too tight stops - let trade breathe
Don't over-optimize - simplicity = reliability
Optimal Settings by Asset
US Stocks (SPY, AAPL, TSLA)
Recommendation:
Fast: Phi Golden (Phi³)
Mid: e Natural (e²)
Slow: Pi Circular (2Pi)
Base: 10-15
Timeframe: H4, D1
Features:
Use on daily for swing
STRONG signals very reliable
Works well on trending stocks
Forex (EUR/USD, GBP/USD)
Recommendation:
Fast: Delta Adaptive (Base 15, Sens 2.0)
Mid: Phi Golden (Phi²)
Slow: Pi Circular (2Pi)
Base: 8-12
Timeframe: M15, H1, H4
Features:
Delta Adaptive works excellently on news
Many signals on M15-H1
Consider spreads
Cryptocurrencies (BTC, ETH, altcoins)
Recommendation:
Fast: Delta Adaptive (Base 10, Sens 3.0)
Mid: Pi Circular (2Pi)
Slow: e Natural (e²)
Base: 5-10
Timeframe: M5, M15, H1
Features:
High volatility - adaptation needed
STRONG signals can last days
Be careful with scalping on M1-M5
Commodities (Gold, Oil)
Recommendation:
Fast: Pi Circular (1Pi)
Mid: Phi Golden (Phi³)
Slow: Pi Circular (3Pi)
Base: 12-18
Timeframe: H4, D1
Features:
Pi works excellently on cyclical commodities
Gold responds especially well to Phi
Oil volatile - use wide stops
Indices (S&P500, Nasdaq, DAX)
Recommendation:
Fast: Phi Golden (Phi³)
Mid: e Natural (e²)
Slow: Pi Circular (2Pi)
Base: 15-20
Timeframe: H4, D1, W1
Features:
Very trending instruments
STRONG signals last weeks
Good for position trading
Alerts
The indicator supports 6 alert types:
1. Golden Cross
Message: "Hellenic Matrix: GOLDEN CROSS - Fast EMA crossed above Slow EMA - Bullish trend starting!"
When: Fast EMA crosses Slow EMA from below
2. Death Cross
Message: "Hellenic Matrix: DEATH CROSS - Fast EMA crossed below Slow EMA - Bearish trend starting!"
When: Fast EMA crosses Slow EMA from above
3. STRONG BULLISH
Message: "Hellenic Matrix: STRONG BULLISH SIGNAL - All EMAs aligned for powerful uptrend!"
When: All conditions for STRONG BUY met (first bar)
4. STRONG BEARISH
Message: "Hellenic Matrix: STRONG BEARISH SIGNAL - All EMAs aligned for powerful downtrend!"
When: All conditions for STRONG SELL met (first bar)
5. Bullish Ribbon
Message: "Hellenic Matrix: BULLISH RIBBON - EMAs aligned for uptrend"
When: EMAs aligned bullish + price above Fast EMA (less strict condition)
6. Bearish Ribbon
Message: "Hellenic Matrix: BEARISH RIBBON - EMAs aligned for downtrend"
When: EMAs aligned bearish + price below Fast EMA (less strict condition)
How to Set Up Alerts:
Open indicator on chart
Click on three dots next to indicator name
Select "Create Alert"
In "Condition" field select needed alert:
Golden Cross
Death Cross
STRONG BULLISH
STRONG BEARISH
Bullish Ribbon
Bearish Ribbon
Configure notification method:
Pop-up in browser
Email
SMS (in Premium accounts)
Push notifications in mobile app
Webhook (for automation)
Select frequency:
Once Per Bar Close (recommended) - once on bar close
Once Per Bar - during bar formation
Only Once - only first time
Click "Create"
Tip: Create separate alerts for different timeframes and instruments
FAQ
1. Why don't STRONG signals appear?
Possible reasons:
Incorrect Fast/Mid/Slow order
Solution: Indicator automatically sorts EMAs by periods, but ensure selected EMAs have different periods
Base Multiplier too large
Solution: Reduce Base to 5-10 on lower timeframes
Market in range
Solution: STRONG signals appear only in trends - this is normal
Too strict EMA settings
Solution: Try classic combination: Phi³ / Pi×2 / e² with Base=10
Mid EMA too close to Fast or Slow
Solution: Select Mid EMA with period between Fast and Slow
2. How often should STRONG signals appear?
Normal frequency:
M1-M5: 5-15 signals per day (very active markets)
M15-H1: 2-8 signals per day
H4: 3-10 signals per week
D1: 2-5 signals per month
W1: 2-6 signals per year
If too many signals - market very volatile or Base too small
If too few signals - market in range or Base too large
4. What are the best settings for beginners?
Universal "out of the box" settings:
Matrix Core:
Base Multiplier: 10
Source: close
Phi Golden: Enabled, Power = 3
Pi Circular: Enabled, Multiple = 2
e Natural: Enabled, Power = 2
Delta Adaptive: Enabled, Base = 20, Sensitivity = 2.0
Manual Selection:
Fast: Phi Golden
Mid: e Natural
Slow: Pi Circular
Visualization:
Gradient Clouds: ON
Neon Glow: ON (Medium)
Pulsing Bar: ON (Medium)
Signal Highlights: ON (Light Fill)
Table: ON (Top Right, Small)
Signals:
Golden/Death Cross: ON
STRONG Signals: ON
Stop Loss: OFF (while learning)
Timeframe for learning: H1 or H4
5. Can I use only one EMA?
No, minimum 2 EMAs (Fast and Slow) for signal generation.
Mid EMA is optional:
With Mid EMA = more reliable but rarer signals
Without Mid EMA = more signals but less strict filtering
Recommendation: Start with 3 EMAs (Fast/Mid/Slow), then experiment
6. Does the indicator work on cryptocurrencies?
Yes, works excellently! Especially good on:
Bitcoin (BTC)
Ethereum (ETH)
Major altcoins (SOL, BNB, XRP)
Recommended settings for crypto:
Fast: Delta Adaptive (Base 10-15, Sensitivity 2.5-3.0)
Mid: Pi Circular (2Pi)
Slow: e Natural (e²)
Base: 5-10
Timeframe: M15, H1, H4
Crypto market features:
High volatility → use Delta Adaptive
24/7 trading → set alerts
Sharp movements → wide stops
7. Can I trade only with this indicator?
Technically yes, but NOT recommended.
Best approach - combine with:
Price Action - support/resistance levels, candle patterns
Volume - movement strength confirmation
Fibonacci - retracement and extension levels
RSI/MACD - divergences and overbought/oversold
Fundamental analysis - news, company reports
Hellenic Matrix:
Excellently determines trend and its strength
Provides clear entry/exit points
Doesn't consider fundamentals
Doesn't see major levels
8. Why do Gradient Clouds change color?
Color depends on EMA order:
Phi-Pi Cloud:
Blue - Pi EMA above Phi EMA (bullish alignment)
Gold - Phi EMA above Pi EMA (bearish alignment)
Pi-e Cloud:
Green - e EMA above Pi EMA (bullish alignment)
Blue - Pi EMA above e EMA (bearish alignment)
Color change = EMA order change = possible trend change
9. What is Momentum % in the table?
Momentum % = percentage deviation of price from Fast EMA
Formula:
Momentum = ((Close - Fast EMA) / Fast EMA) × 100
Interpretation:
+0.5% to +2% - normal bullish momentum
+2% to +5% - strong bullish momentum
+5% and above - overheating (correction possible)
-0.5% to -2% - normal bearish momentum
-2% to -5% - strong bearish momentum
-5% and below - oversold (bounce possible)
Usage:
Monitor momentum during STRONG signals
Large momentum = don't enter (wait for pullback)
Small momentum = good entry point
10. How to configure for scalping?
Settings for scalping (M1-M5):
Base Multiplier: 3-5
Source: close or hlc3 (smoother)
Fast: Delta Adaptive (Base 8-12, Sensitivity 3.0)
Mid: None (for more signals)
Slow: Phi Golden (Phi²) or Pi Circular (1Pi)
Visualization:
- Gradient Clouds: ON (helps see strength)
- Neon Glow: OFF (doesn't clutter chart)
- Pulsing Bar: ON (quick assessment)
- Signal Highlights: ON
Signals:
- Golden/Death Cross: ON
- STRONG Signals: ON
- Stop Loss: ON (1.0-1.5 ATR, R:R 1.5-2.0)
Scalping rules:
Trade only STRONG signals
Enter on bounce from Fast EMA
Tight stops (10-20 pips)
Quick take profit (+1R to +2R)
Don't hold through news
11. How to configure for long-term investing?
Settings for investing (D1-W1):
Base Multiplier: 20-30
Source: close
Fast: Phi Golden (Phi³ or Phi⁴)
Mid: e Natural (e²)
Slow: Pi Circular (3Pi or 4Pi)
Visualization:
- Gradient Clouds: ON
- Neon Glow: ON (Medium)
- Everything else - to taste
Signals:
- Golden/Death Cross: ON
- STRONG Signals: ON
- Stop Loss: OFF (use percentage stop)
Investing rules:
Enter only on STRONG signals
Hold while STRONG active (weeks/months)
Stop below Slow EMA or -10%
Take profit: by company targets or +50-100%
Ignore short-term pullbacks
12. What if indicator slows down chart?
Indicator is optimized, but if it slows:
Disable unnecessary visual effects:
Neon Glow: OFF (saves 8 plots)
Gradient Clouds: ON but low quality
Lambda Wave EMA: OFF (if not using)
Reduce number of active EMAs:
Sigma Composite: OFF
Lambda Wave: OFF
Leave only Phi, Pi, e, Delta
Simplify settings:
Pulsing Bar: OFF
Greek Labels: OFF
Info Table: smaller size
13. Can I use on different timeframes simultaneously?
Yes! Multi-timeframe analysis is very powerful:
Classic scheme:
Higher TF (D1, W1) - determine global trend
Wait for STRONG signal
This is our trading direction
Middle TF (H4, H1) - look for confirmation
STRONG signal in same direction
Precise entry zone
Lower TF (M15, M5) - entry point
Golden Cross or bounce from Fast EMA
Precise stop loss
Example:
W1: STRONG BUY active (global uptrend)
H4: STRONG BUY appeared (confirmation)
M15: Wait for Golden Cross or bounce from Fast EMA → ENTRY
Advantages:
Maximum reliability
Clear timeframe hierarchy
Large targets
14. How does indicator work on news?
Delta Adaptive EMA adapts excellently to news:
Before news:
Low volatility → Delta EMA becomes fast → pulls to price
During news:
Sharp volatility spike → Delta EMA slows → filters noise
After news:
Volatility normalizes → Delta EMA returns to normal
Recommendations:
Don't trade at news release moment (spreads widen)
Wait for STRONG signal after news (2-5 bars)
Use Delta Adaptive as Fast EMA for quick reaction
Widen stops by 50-100% during important news
Advanced Techniques
Technique 1: "Divergences with EMA"
Idea: Look for discrepancies between price and Fast EMA
Bullish divergence:
Price makes lower low
Fast EMA makes higher low
= Possible reversal up
Bearish divergence:
Price makes higher high
Fast EMA makes lower high
= Possible reversal down
How to trade:
Find divergence
Wait for STRONG signal in divergence direction
Enter on confirmation
Technique 2: "EMA Tunnel"
Idea: Use space between Fast and Slow EMA as "tunnel"
Rules:
Wide tunnel - strong trend, hold position
Narrow tunnel - weak trend or consolidation, caution
Tunnel narrowing - trend weakening, prepare to exit
Tunnel widening - trend strengthening, can add
Visually: Gradient Clouds show this automatically!
Trading:
Enter on STRONG signal (tunnel starts widening)
Hold while tunnel wide
Exit when tunnel starts narrowing
Technique 3: "Wave Analysis with Lambda"
Idea: Lambda Wave EMA creates sinusoid matching market cycles
Setup:
Lambda Base Period: 30
Lambda Wave Amplitude: 0.5
Lambda Wave Frequency: 50 (adjusted to asset cycle)
How to find correct Frequency:
Look at historical cycles (distance between local highs)
Average distance = your Frequency
Example: if highs every 40-60 bars, set Frequency = 50
Trading:
Enter when Lambda Wave at bottom of sinusoid (growth potential)
Exit when Lambda Wave at top (fall potential)
Combine with STRONG signals
Technique 4: "Cluster Analysis"
Idea: When all EMAs gather in narrow cluster = powerful breakout soon
Cluster signs:
All EMAs (Phi, Pi, e, Delta) within 0.5-1% of each other
Gradient Clouds almost invisible
Price jumping around all EMAs
Trading:
Identify cluster (all EMAs close)
Determine breakout direction (where more volume, higher TFs direction)
Wait for breakout and STRONG signal
Enter on confirmation
Target = cluster size × 3-5
This is very powerful technique for big moves!
Technique 5: "Sigma as Dynamic Level"
Idea: Sigma Composite EMA = average of all EMAs = magnetic level
Usage:
Enable Sigma Composite (Weighted Average)
Sigma works as dynamic support/resistance
Price often returns to Sigma before trend continuation
Trading:
In trend: Enter on bounces from Sigma
In range: Fade moves from Sigma (trade return to Sigma)
On breakout: Sigma becomes support/resistance
Risk Management
Basic Rules
1. Position Size
Conservative: 1% of capital per trade
Moderate: 2% of capital per trade (recommended)
Aggressive: 3-5% (only for experienced)
Calculation formula:
Lot Size = (Capital × Risk%) / (Stop in pips × Pip value)
2. Risk/Reward Ratio
Minimum: 1:1.5
Standard: 1:2 (recommended)
Optimal: 1:3
Aggressive: 1:5+
3. Maximum Drawdown
Daily: -3% to -5%
Weekly: -7% to -10%
Monthly: -15% to -20%
Upon reaching limit → STOP trading until end of period
Position Management Strategies
1. Fixed Stop
Method:
Stop below/above Fast EMA or local extreme
DON'T move stop against position
Can move to breakeven
For whom: Beginners, conservative traders
2. Trailing by Fast EMA
Method:
Each day (or bar) move stop to Fast EMA level
Position closes when price breaks Fast EMA
Advantages:
Stay in trend as long as possible
Automatically exit on reversal
For whom: Trend followers, swing traders
3. Partial Exit
Method:
50% of position close at +2R
50% hold with trailing by Mid EMA or Slow EMA
Advantages:
Lock profit
Leave position for big move
Psychologically comfortable
For whom: Universal method (recommended)
4. Pyramiding
Method:
First entry on STRONG signal (50% of planned position)
Add 25% on pullback to Fast EMA
Add another 25% on pullback to Mid EMA
Overall stop below Slow EMA
Advantages:
Average entry price
Reduce risk
Increase profit in strong trends
Caution:
Works only in trends
In range leads to losses
For whom: Experienced traders
Trading Psychology
Correct Mindset
1. Indicator is a tool, not holy grail
Indicator shows probability, not guarantee
There will be losing trades - this is normal
Important is series statistics, not one trade
2. Trust the system
If STRONG signal appeared - enter
Don't search for "perfect" moment
Follow trading plan
3. Patience
STRONG signals don't appear every day
Better miss signal than enter against trend
Quality over quantity
4. Discipline
Always set stop loss
Don't move stop against position
Don't increase risk after losses
Beginner Mistakes
1. "I know better than indicator"
Indicator says STRONG BUY, but you think "too high, will wait for pullback"
Result: miss profitable move
Solution: Trust signals or don't use indicator
2. "Will reverse now for sure"
Trading against STRONG trend
Result: stops, stops, stops
Solution: Trend is your friend, trade with trend
3. "Will hold a bit more"
Don't exit when STRONG signal disappears
Greed eats profit
Solution: If signal gone - exit!
4. "I'll recover"
After losses double risk
Result: huge losses
Solution: Fixed % risk ALWAYS
5. "I don't like this signal"
Skip signals because of "feeling"
Result: inconsistency, no statistics
Solution: Trade ALL signals or clearly define filters
Trading Journal
What to Record
For each trade:
1. Entry/exit date and time
2. Instrument and timeframe
3. Signal type
Golden Cross
STRONG BUY
STRONG SELL
Death Cross
4. Indicator settings
Fast/Mid/Slow EMA
Base Multiplier
Other parameters
5. Chart screenshot
Entry moment
Exit moment
6. Trade parameters
Position size
Stop loss
Take Profit
R:R
7. Result
Profit/Loss in $
Profit/Loss in %
Profit/Loss in R
8. Notes
What was right
What was wrong
Emotions during trade
Lessons
Journal Analysis
Analyze weekly:
1. Win Rate
Win Rate = (Profitable trades / All trades) × 100%
Good: 50-60%
Excellent: 60-70%
Exceptional: 70%+
2. Average R
Average R = Sum of all R / Number of trades
Good: +0.5R
Excellent: +1.0R
Exceptional: +1.5R+
3. Profit Factor
Profit Factor = Total profit / Total losses
Good: 1.5+
Excellent: 2.0+
Exceptional: 3.0+
4. Maximum Drawdown
Track consecutive losses
If more than 5 in row - stop, check system
5. Best/Worst Trades
What was common in best trades? (do more)
What was common in worst trades? (avoid)
Pre-Trade Checklist
Technical Analysis
STRONG signal active (BUY or SELL)
All EMAs properly aligned (Fast > Mid > Slow or reverse)
Price on correct side of Fast EMA
Gradient Clouds confirm trend
Pulsing Bar shows STRONG state
Momentum % in normal range (not overheated)
No close strong levels against direction
Higher timeframe doesn't contradict
Risk Management
Position size calculated (1-2% risk)
Stop loss set
Take profit calculated (minimum 1:2)
R:R satisfactory
Daily/weekly risk limit not exceeded
No other open correlated positions
Fundamental Analysis
No important news in coming hours
Market session appropriate (liquidity)
No contradicting fundamentals
Understand why asset is moving
Psychology
Calm and thinking clearly
No emotions from previous trades
Ready to accept loss at stop
Following trading plan
Not revenging market for past losses
If at least one point is NO - think twice before entering!
Learning Roadmap
Week 1: Familiarization
Goals:
Install and configure indicator
Study all EMA types
Understand visualization
Tasks:
Add indicator to chart
Test all Fast/Mid/Slow settings
Play with Base Multiplier on different timeframes
Observe Gradient Clouds and Pulsing Bar
Study Info Table
Result: Comfort with indicator interface
Week 2: Signals
Goals:
Learn to recognize all signal types
Understand difference between Golden Cross and STRONG
Tasks:
Find 10 Golden Cross examples in history
Find 10 STRONG BUY examples in history
Compare their results (which worked better)
Set up alerts
Get 5 real alerts
Result: Understanding signals
Week 3: Demo Trading
Goals:
Start trading signals on demo account
Gather statistics
Tasks:
Open demo account
Trade ONLY STRONG signals
Keep journal (minimum 20 trades)
Don't change indicator settings
Strictly follow stop losses
Result: 20+ documented trades
Week 4: Analysis
Goals:
Analyze demo trading results
Optimize approach
Tasks:
Calculate win rate and average R
Find patterns in profitable trades
Find patterns in losing trades
Adjust approach (not indicator!)
Write trading plan
Result: Trading plan on 1 page
Month 2: Improvement
Goals:
Deepen understanding
Add additional techniques
Tasks:
Study multi-timeframe analysis
Test combinations with Price Action
Try advanced techniques (divergences, tunnels)
Continue demo trading (minimum 50 trades)
Achieve stable profitability on demo
Result: Win rate 55%+ and Profit Factor 1.5+
Month 3: Real Trading
Goals:
Transition to real account
Maintain discipline
Tasks:
Open small real account
Trade minimum lots
Strictly follow trading plan
DON'T increase risk
Focus on process, not profit
Result: Psychological comfort on real
Month 4+: Scaling
Goals:
Increase account
Become consistently profitable
Tasks:
With 60%+ win rate can increase risk to 2%
Upon doubling account can add capital
Continue keeping journal
Periodically review and improve strategy
Share experience with community
Result: Stable profitability month after month
Additional Resources
Recommended Reading
Technical Analysis:
"Technical Analysis of Financial Markets" - John Murphy
"Trading in the Zone" - Mark Douglas (psychology)
"Market Wizards" - Jack Schwager (trader interviews)
EMA and Moving Averages:
"Moving Averages 101" - Steve Burns
Articles on Investopedia about EMA
Risk Management:
"The Mathematics of Money Management" - Ralph Vince
"Trade Your Way to Financial Freedom" - Van K. Tharp
Trading Journals:
Edgewonk (paid, very powerful)
Tradervue (free version + premium)
Excel/Google Sheets (free)
Screeners:
TradingView Stock Screener
Finviz (stocks)
CoinMarketCap (crypto)
Conclusion
Hellenic EMA Matrix is a powerful tool based on universal mathematical constants of nature. The indicator combines:
Mathematical elegance - Phi, Pi, e instead of arbitrary numbers
Premium visualization - Neon Glow, Gradient Clouds, Pulsing Bar
Reliable signals - STRONG BUY/SELL work on all timeframes
Flexibility - 6 EMA types, adaptation to any trading style
Automation - auto-sorting EMAs, SL/TP calculation, alerts
Key Success Principles:
Simplicity - start with basic settings (Phi/Pi/e, Base=10)
Discipline - follow STRONG signals strictly
Patience - wait for quality setups
Risk Management - 1-2% per trade, ALWAYS
Journal - document every trade
Learning - constantly improve skills
Remember:
Indicator shows probability, not guarantee
Important is series statistics, not one trade
Psychology more important than technique
Quality more important than quantity
Process more important than result
Acknowledgments
Thank you for using Hellenic EMA Matrix - Alpha Omega Premium!
The indicator was created with love for mathematics, markets, and beautiful visualization.
Wishing you profitable trading!
Guide Version: 1.0
Date: 2025
Compatibility: Pine Script v6, TradingView
"In the simplicity of mathematical constants lies the complexity of market movements"

Power RSI Segment Runner [CHE] Power RSI Segment Runner — Tracks RSI momentum across higher timeframe segments to detect directional switches for trend confirmation.
Summary
This indicator calculates a running Relative Strength Index adapted to segments defined by changes in a higher timeframe, such as daily closes, providing a smoothed view of momentum within each period. It distinguishes between completed segments, which fix the final RSI value, and ongoing ones, which update in real time with an exponential moving average filter. Directional switches between bullish and bearish momentum trigger visual alerts, including overlay lines and emojis, while a compact table displays current trend strength as a progress bar. This segmented approach reduces noise from intra-period fluctuations, offering clearer signals for trend persistence compared to standard RSI on lower timeframes.
Motivation: Why this design?
Standard RSI often generates erratic signals in choppy markets due to constant recalculation over fixed lookback periods, leading to false reversals that mislead traders during range-bound or volatile phases. By resetting the RSI accumulation at higher timeframe boundaries, this indicator aligns momentum assessment with broader market cycles, capturing sustained directional bias more reliably. It addresses the gap between short-term noise and long-term trends, helping users filter entries without over-relying on absolute overbought or oversold thresholds.
What’s different vs. standard approaches?
- Baseline Reference: Diverges from the classic Wilder RSI, which uses a fixed-length exponential moving average of gains and losses across all bars.
- Architecture Differences:
- Segments momentum resets at higher timeframe changes, isolating calculations per period instead of continuous history.
- Employs persistent sums for ups and downs within segments, with on-the-fly RSI derivation and EMA smoothing.
- Integrates switch detection logic that clears prior visuals on reversal, preventing clutter from outdated alerts.
- Adds overlay projections like horizontal price lines and dynamic percent change trackers for immediate trade context.
- Practical Effect: Charts show discrete RSI endpoints for past segments alongside a curved running trace, making momentum evolution visually intuitive. Switches appear as clean, extendable overlays, reducing alert fatigue and highlighting only confirmed directional shifts, which aids in avoiding whipsaws during minor pullbacks.
How it works (technical)
The indicator begins by detecting changes in the specified higher timeframe, such as a new daily bar, to define segment boundaries. At each boundary, it finalizes the prior segment's RSI by summing positive and negative price changes over that period and derives the value from the ratio of those sums, then applies an exponential moving average for smoothing. Within the active segment, it accumulates ongoing ups and downs from price changes relative to the source, recalculating the running RSI similarly and smoothing it with the same EMA length.
Points for the running RSI are collected into an array starting from the segment's onset, forming a curved polyline once sufficient bars accumulate. Comparisons between the running RSI and the last completed segment's value determine the current direction as long, short, or neutral, with switches triggering deletions of old visuals and creation of new ones: a label at the RSI pane, a vertical dashed line across the RSI range, an emoji positioned via ATR offset on the price chart, a solid horizontal line at the switch price, a dashed line tracking current close, and a midpoint label for percent change from the switch.
Initialization occurs on the first bar by resetting accumulators, and visualization gates behind a minimum bar count since the segment start to avoid early instability. The trend strength table builds vertically with filled cells proportional to the rounded RSI value, colored by direction. All drawing objects update or extend on subsequent bars to reflect live progress.
Parameter Guide
EMA Length — Controls the smoothing applied to the running RSI; higher values increase lag but reduce noise. Default: 10. Trade-offs: Shorter settings heighten sensitivity for fast markets but risk more false switches; longer ones suit trending conditions for stability.
Source — Selects the price data for change calculations, typically close for standard momentum. Default: close. Trade-offs: Open or high/low may emphasize gaps, altering segment intensity.
Segment Timeframe — Defines the higher timeframe for segment resets, like daily for intraday charts. Default: D. Trade-offs: Shorter frames create more frequent but shorter segments; longer ones align with major cycles but delay resets.
Overbought Level — Sets the upper threshold for potential overbought conditions (currently unused in visuals). Default: 70. Trade-offs: Adjust for asset volatility; higher values delay bearish warnings.
Oversold Level — Sets the lower threshold for potential oversold conditions (currently unused in visuals). Default: 30. Trade-offs: Lower values permit deeper dips before signaling bullish potential.
Show Completed Label — Toggles labels at segment ends displaying final RSI. Default: true. Trade-offs: Enables historical review but can crowd charts on dense timeframes.
Plot Running Segment — Enables the curved polyline for live RSI trace. Default: true. Trade-offs: Visualizes intra-segment flow; disable for cleaner panes.
Running RSI as Label — Displays current running RSI as a forward-projected label on the last bar. Default: false. Trade-offs: Useful for quick reads; may overlap in tight scales.
Show Switch Label — Activates RSI pane labels on directional switches. Default: true. Trade-offs: Provides context; omit to minimize pane clutter.
Show Switch Line (RSI) — Draws vertical dashed lines across the RSI range at switches. Default: true. Trade-offs: Marks reversal bars clearly; extends both ways for reference.
Show Solid Overlay Line — Projects a horizontal line from switch price forward. Default: true. Trade-offs: Acts as dynamic support/resistance; wider lines enhance visibility.
Show Dashed Overlay Line — Tracks a dashed line from switch to current close. Default: true. Trade-offs: Shows price deviation; thinner for subtlety.
Show Percent Change Label — Midpoint label tracking percent move from switch. Default: true. Trade-offs: Quantifies progress; centers dynamically.
Show Trend Strength Table — Displays right-side table with direction header and RSI bar. Default: true. Trade-offs: Instant strength gauge; fixed position avoids overlap.
Activate Visualization After N Bars — Delays signals until this many bars into a segment. Default: 3. Trade-offs: Filters immature readings; higher values miss early momentum.
Segment End Label — Color for completed RSI labels. Default: 7E57C2. Trade-offs: Purple tones for finality.
Running RSI — Color for polyline and running elements. Default: yellow. Trade-offs: Bright for live tracking.
Long — Color for bullish switch visuals. Default: green. Trade-offs: Standard for uptrends.
Short — Color for bearish switch visuals. Default: red. Trade-offs: Standard for downtrends.
Solid Line Width — Thickness of horizontal overlay line. Default: 2. Trade-offs: Bolder for emphasis on key levels.
Dashed Line Width — Thickness of tracking and vertical lines. Default: 1. Trade-offs: Finer to avoid dominance.
Reading & Interpretation
Completed segment RSIs appear as static points or labels in purple, indicating the fixed momentum at period close—values drifting toward the upper half suggest building strength, while lower half implies weakness. The yellow curved polyline traces the live smoothed RSI within the current segment, rising for accumulating gains and falling for losses. Directional labels and lines in green or red flag switches: green for running momentum exceeding the prior segment's, signaling potential uptrend continuation; red for the opposite.
The right table's header colors green for long, red for short, or gray for neutral/wait, with filled purple bars scaling from bottom (low RSI) to top (high), topped by the numeric value. Overlay elements project from switch bars: the solid green/red line as a price anchor, dashed tracker showing pullback extent, and percent label quantifying deviation—positive for alignment with direction, negative for counter-moves. Emojis (up arrow for long, down for short) float above/below price via ATR spacing for quick chart scans.
Practical Workflows & Combinations
- Trend Following: Enter long on green switch confirmation after a higher high in structure; filter with table strength above midpoint for conviction. Pair with volume surge for added weight.
- Exits/Stops: Trail stops to the solid overlay line on pullbacks; exit if percent change reverses beyond 2 percent against direction. Use wait bars to confirm without chasing.
- Multi-Asset/Multi-TF: Defaults suit forex/stocks on 1H-4H with daily segments; for crypto, shorten EMA to 5 for volatility. Scale segment TF to weekly for daily charts across indices.
- Combinations: Overlay on EMA clouds for confluence—switch aligning with cloud break strengthens signal. Add volatility filters like ATR bands to debounce in low-volume regimes.
Behavior, Constraints & Performance
Signals confirm on bar close within segments, with running polyline updating live but gated by minimum bars to prevent flicker. Higher timeframe changes may introduce minor repaints on timeframe switches, mitigated by relying on confirmed HTF closes rather than intrabar peeks. Resource limits cap at 500 labels/lines and 50 polylines, pruning old objects on switches to stay efficient; no explicit loops, but array growth ties to segment length—suitable for up to 500-bar histories without lag.
Known limits include delayed visualization in short segments and insensitivity to overbought/oversold levels, as thresholds are inputted but not actively visualized. Gaps in source data reset accumulators prematurely, potentially skewing early RSI.
Sensible Defaults & Quick Tuning
Start with EMA length 10, daily segments, and 3-bar wait for balanced responsiveness on hourly charts. For excessive switches in ranging markets, increase wait bars to 5 or EMA to 14 to dampen noise. If signals lag in trends, drop EMA to 5 and use 1H segments. For stable assets like indices, widen to weekly segments; tune colors for dark/light themes without altering logic.
What this indicator is—and isn’t
This tool serves as a momentum visualization and switch detector layered over price action, aiding trend identification and confirmation in segmented contexts. It is not a standalone trading system, predictive model, or risk calculator—always integrate with broader analysis, position sizing, and stop-loss discipline. View it as an enhancement for discretionary setups, not automated alerts without validation.
Disclaimer
The content provided, including all code and materials, is strictly for educational and informational purposes only. It is not intended as, and should not be interpreted as, financial advice, a recommendation to buy or sell any financial instrument, or an offer of any financial product or service. All strategies, tools, and examples discussed are provided for illustrative purposes to demonstrate coding techniques and the functionality of Pine Script within a trading context.
Any results from strategies or tools provided are hypothetical, and past performance is not indicative of future results. Trading and investing involve high risk, including the potential loss of principal, and may not be suitable for all individuals. Before making any trading decisions, please consult with a qualified financial professional to understand the risks involved.
By using this script, you acknowledge and agree that any trading decisions are made solely at your discretion and risk.
Do not use this indicator on Heikin-Ashi, Renko, Kagi, Point-and-Figure, or Range charts, as these chart types can produce unrealistic results for signal markers and alerts.
Best regards and happy trading
Chervolino

Trend Strength Index [Alpha Extract]The Trend Strength Index leverages Volume Weighted Moving Average (VWMA) and Average True Range (ATR) to quantify trend intensity in cryptocurrency markets, particularly Bitcoin. The combination of VWMA and ATR is particularly powerful because VWMA provides a more accurate representation of the market's true average price by weighting periods of higher trading volume more heavily—capturing genuine momentum driven by increased participation rather than treating all price action equally, which is crucial in volatile assets like Bitcoin where volume spikes often signal institutional interest or market shifts.
Meanwhile, ATR normalizes this measurement for volatility, ensuring that trend strength readings remain comparable across different market conditions; without ATR's adjustment, raw price deviations from the mean could appear artificially inflated during high-volatility periods (like during news events or liquidations) or understated in low-volatility sideways markets, leading to misleading signals. Together, they create a volatility-adjusted, volume-sensitive metric that reliably distinguishes between meaningful trend developments and noise.
This indicator measures the normalized distance between price and its volume-weighted mean, providing a clear visualization of trend strength while accounting for market volatility. It helps traders identify periods of strong directional movement versus consolidation, with color-coded gradients for intuitive interpretation.
🔶 CALCULATION
The indicator processes price data through these analytical stages:
Volume Weighted Moving Average: Computes a smoothed average weighted by trading volume
Volatility Normalization: Uses ATR to account for market volatility
Distance Measurement: Calculates absolute deviation between current price and VWMA
Strength Normalization: Divides price deviation by ATR for a volatility-adjusted metric
Formula:
VWMA = Volume-Weighted Moving Average of Close over specified length
ATR = Average True Range over specified length
Price Distance = |Close - VWMA|
Trend Strength = Price Distance / ATR
🔶 DETAILS Visual Features:
VWMA Line: Blue line overlay on the price chart representing the volume-weighted mean
Trend Strength Area: Histogram-style area plot with dynamic color gradient (red for weak trends, transitioning through orange and yellow to green for strong trends)
Threshold Line: Horizontal red line at the customizable Trend Enter level
Background Highlight: Subtle green background when trend strength exceeds the enter threshold for strong trend visualization
Alert System: Triggers notifications for strong trend detection
Interpretation:
0-Weak (Red): Minimal trend strength, potential consolidation or ranging market
Mid-Range (Orange/Yellow): Building momentum, watch for breakout potential
At/Above Enter Threshold (Green): Strong trend conditions, potential for continued directional moves
Threshold Crossing: Trend strength crossing above the enter level signals increasing conviction in the current direction
Color Transitions: Gradual shifts from warm (red/orange) to cool (green) tones indicate strengthening trends
🔶 EXAMPLES
Strong Trend Entry: When trend strength crosses above the enter threshold (e.g., 1.2), it identifies the onset of a powerful move where price deviates significantly from the mean.
Example: During a rally, trend strength rising from yellow (around 1.0) to green (1.2+) often precedes sustained upward momentum, providing entry opportunities for trend followers.
Consolidation Detection: Low trend strength values in red shades (below 0.5) highlight periods of low volatility and mean reversion potential.
Example: After a sharp sell-off, persistent red values signal a likely sideways phase, allowing traders to avoid whipsaws and wait for orange/yellow transitions as a precursor to recovery.
Volatility-Adjusted Pullbacks: In volatile markets, the ATR component ensures trend strength remains accurate; a dip back to yellow from green during minor corrections can indicate healthy pullbacks within a strong trend.
Example: Trend strength briefly falling to yellow levels (e.g., 0.8-1.1) after hitting green provides profit-taking signals without invalidating the overall bullish bias if the VWMA holds as support.
Threshold Alert Integration: The alert condition combines strength value with the enter threshold for timely notifications.
Example: Receiving a "Strong Trend Detected" alert when the area plot turns green helps confirm Bitcoin's breakout from consolidation, aligning with increased volume for higher-probability trades.
🔶 SETTINGS
Customization Options:
Lengths: VWMA length (default 14), ATR length (default 14)
Thresholds: Trend enter (default 1.2, step 0.1), trend exit (default 1.15, for potential future signal enhancements)
Visuals: Automatic color scaling with red at 0, transitioning to green at/above enter threshold
Alert Conditions: Strong trend detection (when strength > enter)
The Trend Strength Index equips traders with a robust, easy-to-interpret tool for gauging trend intensity in volatile markets like Bitcoin. By normalizing price deviations against volatility, it delivers reliable signals for identifying high-momentum opportunities while the gradient coloring and alerts facilitate quick assessments in both trending and choppy conditions.

is_strategyCorrection-Adaptive Trend Strategy (Open-Source)
Core Advantage: Designed specifically for the is_correction indicator, with full transparency and customization options.
Key Features:
Open-Source Code:
✅ Full access to the strategy logic – study how every trade signal is generated.
✅ Freedom to customize – modify entry/exit rules, risk parameters, or add new indicators.
✅ No black boxes – understand and trust every decision the strategy makes.
Built for is_correction:
Filters out false signals during market noise.
Works only in confirmed trends (is_correction = false).
Adaptable for Your Needs:
Change Take Profit/Stop Loss ratios directly in the code.
Add alerts, notifications, or integrate with other tools (e.g., Volume Profile).
For Developers/Traders:
Use the code as a template for your own strategies.
Test modifications risk-free on historical data.
How the Strategy Works:
Main Goal:
Automatically buys when the price starts rising and sells when it starts falling, but only during confirmed trends (ignoring temporary pullbacks).
What You See on the Chart:
📈 Up arrows ▼ (below the candle) = Buy signal.
📉 Down arrows ▲ (above the candle) = Sell signal.
Gray background = Market is in a correction (no trades).
Key Mechanics:
Buy Condition:
Price closes higher than the previous candle + is_correction confirms the main trend (not a pullback).
Example: Red candle → green candle → ▼ arrow → buy.
Sell Condition:
Price closes lower than the previous candle + is_correction confirms the trend (optional: turn off short-selling in settings).
Exit Rules:
Closes trades automatically at:
+0.5% profit (adjustable in settings).
-0.5% loss (adjustable).
Or if a reverse signal appears (e.g., sell signal after a buy).
User-Friendly Settings:
Sell – On (default: ON):
ON → Allows short-selling (selling when price falls).
OFF → Strategy only buys and closes positions.
Revers (default: OFF):
ON → Inverts signals (▼ = sell, ▲ = buy).
%Profit & %Loss:
Adjust these values (0-30%) to increase/decrease profit targets and risk.
Example Scenario:
Buy Signal:
Price rises for 3 days → green ▼ arrow → strategy buys.
Stop loss set 0.5% below entry price.
If price keeps rising → trade closes at +0.5% profit.
Correction Phase:
After a rally, price drops for 1 day → gray background → strategy ignores the drop (no action).
Stop Loss Trigger:
If price drops 0.5% from entry → trade closes automatically.
Key Features:
Correction Filter (is_correction):
Acts as a “noise filter” → avoids trades during temporary pullbacks.
Flexibility:
Disable short-selling, flip signals, or tweak profit/loss levels in seconds.
Transparency:
Open-source code → see exactly how every signal is generated (click “Source” in TradingView).
Tips for Beginners:
Test First:
Run the strategy on historical data (click the “Chart” icon in TradingView).
See how it performed in the past.
Customize It:
Increase %Profit to 2-3% for volatile assets like crypto.
Turn off Sell – On if short-selling confuses you.
Trust the Stop Loss:
Even if you think the price will rebound, the strategy will close at -0.5% to protect your capital.
Where to Find Settings:
Click the strategy name on the top-left of your chart → adjust sliders/toggles in the menu.
Русская Версия
Трендовая стратегия с открытым кодом
Главное преимущество: Полная прозрачность логики и адаптация под ваши нужды.
Особенности:
Открытый исходный код:
✅ Видите всю «кухню» стратегии – как формируются сигналы, когда открываются сделки.
✅ Меняйте правила – корректируйте тейк-профит, стоп-лосс или добавляйте новые условия.
✅ Никаких секретов – вы контролируете каждое правило.
Заточка под is_correction:
Игнорирует ложные сигналы в коррекциях.
Работает только в сильных трендах (is_correction = false).
Гибкая настройка:
Подстройте параметры под свой риск-менеджмент.
Добавьте свои индикаторы или условия для входа.
Для трейдеров и разработчиков:
Используйте код как основу для своих стратегий.
Тестируйте изменения на истории перед реальной торговлей.
Простыми словами:
Почему это удобно:
Открытый код = полный контроль. Вы можете:
Увидеть, как именно стратегия решает купить или продать.
Изменить правила закрытия сделок (например, поставить TP=2% вместо 1.5%).
Добавить новые условия (например, торговать только при высоком объёме).
Примеры кастомизации:
Новички: Меняйте только TP/SL в настройках (без кодинга).
Продвинутые: Добавьте RSI-фильтр, чтобы избегать перекупленности.
Разработчики: Встройте стратегию в свою торговую систему.
Как начать:
Скачайте код из TradingView.
Изучите логику в разделе strategy.entry/exit.
Меняйте параметры в блоке input.* (безопасно!).
Тестируйте изменения и оптимизируйте под свои цели.
Как работает стратегия:
Главная задача:
Автоматически покупает, когда цена начинает расти, и продаёт, когда падает. Но делает это «умно» — только когда рынок в основном тренде, а не во временном откате (коррекции).
Что видно на графике:
📈 Стрелки вверх ▼ (под свечой) — сигнал на покупку.
📉 Стрелки вниз ▲ (над свечой) — сигнал на продажу.
Серый фон — рынок в коррекции (не торгуем).
Как это работает:
Когда покупаем:
Если цена закрылась выше предыдущей и индикатор is_correction показывает «основной тренд» (не коррекция).
Пример: Была красная свеча → стала зелёная → появилась стрелка ▼ → покупаем.
Когда продаём:
Если цена закрылась ниже предыдущей и is_correction подтверждает тренд (опционально, можно отключить в настройках).
Когда закрываем сделку:
Автоматически при достижении:
+0.5% прибыли (можно изменить в настройках).
-0.5% убытка (можно изменить).
Или если появился противоположный сигнал (например, после покупки пришла стрелка продажи).
Настройки для чайников:
«Sell – On» (включено по умолчанию):
Если включено → стратегия будет продавать в шорт.
Если выключено → только покупки и закрытие позиций.
«Revers» (выключено по умолчанию):
Если включить → стратегия будет работать наоборот (стрелки ▼ = продажа, ▲ = покупка).
«%Profit» и «%Loss»:
Меняйте эти цифры (от 0 до 30), чтобы увеличить/уменьшить прибыль и риски.
Пример работы:
Сигнал на покупку:
Цена 3 дня растет → появляется зелёная стрелка ▼ → стратегия покупает.
Стоп-лосс ставится на 0.5% ниже цены входа.
Если цена продолжает расти → сделка закрывается при +0.5% прибыли.
Коррекция:
После роста цена падает на 1 день → фон становится серым → стратегия игнорирует это падение (не закрывает сделку).
Стоп-лосс:
Если цена упала на 0.5% от точки входа → сделка закрывается автоматически.
Важные особенности:
Фильтр коррекций (is_correction):
Это «защита от шума» — стратегия не реагирует на мелкие откаты, работая только в сильных трендах.
Гибкие настройки:
Можно запретить шорты, перевернуть сигналы или изменить уровни прибыли/убытка за 2 клика.
Прозрачность:
Весь код открыт → вы можете увидеть, как формируется каждый сигнал (меню «Исходник» в TradingView).
Советы для новичков:
Начните с теста:
Запустите стратегию на исторических данных (кнопка «Свеча» в окне TradingView).
Посмотрите, как она работала в прошлом.
Настройте под себя:
Увеличьте %Profit до 2-3%, если торгуете валюты.
Отключите «Sell – On», если не понимаете шорты.
Доверяйте стоп-лоссу:
Даже если кажется, что цена развернётся — стратегия закроет сделку при -0.5%, защитив ваш депозит.
Где найти настройки:
Кликните на название стратегии в верхнем левом углу графика → откроется меню с ползунками и переключателями.
Важно: Стратегия предоставляет «рыбу» – чтобы она стала «уловистой», адаптируйте её под свой стиль торговли!

Combined Multi-Timeframe EMA OscillatorThis script aims to visualize the strength of bullish or bearish trends by utilizing a mix of 200 EMA across multiple timeframes. I've observed that when the multi-timeframe 200 EMA ribbon is aligned and expanding, the uptrend usually lasts longer and is safer to enter at a pullback for trend continuation. Similarly, when the bands are expanding in reverse order, the downtrend holds longer, making it easier to sell the pullbacks.
In this script, I apply a purely empirical and experimental method: a) Ranking the position of each of the above EMAs and turning it into an oscillator. b) Taking each 200 EMA on separate timeframes, turning it into a stochastic-like oscillator, and then averaging them to compute an overall stochastic.
To filter a bullish signal, I use the bullish crossover between these two aggregated oscillators (default: yellow and blue on the chart) which also plots a green shadow area on the screen and I look for buy opportunities/ ignore sell opportunities while this signal is bullish. Similarly, a bearish crossover gives us a bearish signal which also plots a red shadow area on the screen and I only look for sell opportunities/ ignore any buy opportunities while this signal is bearish.
Note that directly buying the signal as it prints can lead to suboptimal entries. The idea behind the above is that these crossovers point on average to a stronger trend; however, a trade should be initiated on the pullbacks with confirmation from momentum and volume indicators and in confluence with key areas of support and resistance and risk management should be used in order to protect your position.
Disclaimer: This script does not constitute certified financial advice, the current work is purely experimental, use at your own discretion.

Trend and RSI Bias FusionTrend and RSI Bias Fusion Indicator
This is my first ever indicator. I created this indicator for myself. I was inspired by the indicators created by Bjorgum, Duyck and QuantTherapy and decided to create multiple indicators that either work well combined with their indicators or something new that applies some of their indicator concepts. I decided to share this because I believe in learning and earing together as a community. I will later share the rest of the indicators I have created. This is my first time ever sharing any indicator so if you guys have any questions or suggestions write them.
Overview
The "Trend and RSI Bias Fusion" indicator is a versatile tool designed to help traders identify key market trends, potential reversals, momentum shifts, and RSI-based pullbacks. This indicator fuses trend analysis and RSI bias into a single, comprehensive visual, making it easier to make informed trading decisions across various timeframes and market conditions.
Features
Dual Timeframe Analysis: Combines trend analysis on a higher timeframe (e.g., Daily) with RSI analysis on a lower timeframe (e.g., 4-Hour), providing a more granular view of market conditions. You can, however, choose any timeframe you want for instance 12hr with trend and 2hr RSI analysis.
Trend and Momentum Visualization: The indicator uses Exponential Moving Averages (EMAs) to determine trend direction and colors the chart background to reflect bullish or bearish trends, along with momentum strength.
RSI Bias Detection: Automatically identifies overbought and oversold conditions using the RSI, providing a clear indication of potential market reversals or continuations.
Color-Coded Bars: Optionally color codes bars based on either trend direction or RSI bias, giving you a quick visual cue of the market's state.
Reversal Markers: Displays trend reversal markers on the chart when the short-term EMA crosses over or under the long-term EMA.
Calculation Details
Exponential Moving Averages (EMAs): The indicator calculates short-term and long-term EMAs using the closing prices.
The crossover between these EMAs is used to determine the trend direction:
Short-Term EMA: Typically a 14-period EMA.
Long-Term EMA: Typically a 50-period EMA.
Momentum: Calculated using the RSI and then centered around zero by subtracting 50. This allows the indicator to distinguish between positive and negative momentum.
RSI Bias: The RSI is calculated on a lower timeframe to detect overbought (above 60) and oversold (below 40) conditions, which are used to determine the bias:
RSI Above 60: Indicates potential overbought conditions (bearish bias).
RSI Below 40: Indicates potential oversold conditions (bullish bias).
How to Use the Indicator
Select Your Timeframes: Choose your preferred trend timeframe (e.g., Daily) and RSI timeframe (e.g., 4-2 Hour) in the indicator settings. These should match your trading strategy and the asset class you're analyzing.
Interpret Trend and Momentum
Background Color: The background color reflects the current trend direction:
Green/Lime: Uptrend, with lime indicating positive momentum.
Red/Maroon: Downtrend, with maroon indicating positive momentum within a downtrend.
Momentum Histogram: The histogram plot shows momentum, color-coded by the trend. A histogram above zero with green/lime indicates bullish momentum, while below zero with red/maroon indicates bearish momentum.
Image above: Both RSI and Trend are set to daily, uses RSI bar color
Read RSI Bias:
The RSI bias line helps identify the current market state relative to overbought or oversold levels. The RSI value is plotted on the chart, with lines at 60 and 40 to mark these levels.
When the RSI crosses above 60, it suggests a bearish bias; crossing below 40 suggests a bullish bias.
Use Reversal Markers: The indicator places small circles on the chart at points where the short-term EMA crosses the long-term EMA, signaling potential trend reversals.
Bar Color Customization:
You can choose to color the bars based on either the trend or the RSI bias in the indicator settings. In the Images below I have changed the colors to fit my personal style , Blue for uptrend and Pink for downtrend:
Trend-Based: Bars will reflect the trend direction (green for uptrend or in this case blue, red for downtrend or in this case pink).
RSI-Based: Bars will reflect RSI conditions (yellow for overbought, maroon for oversold).
Image above: RSI is set to 4hr and Trend is set to daily, uses RSI bar color
Image above: RSI is set to 4hr and Trend is set to daily, uses Trend bar color
Image above: Both RSI and Trend are set to daily, uses RSI bar color
Image above: Both RSI and Trend are set to daily, uses Trend bar color
Image above: Both RSI and Trend are set to daily, without bar color
Image above: Both RSI and Trend are set to daily, how it looks on a clean chart
Example Use Case Swing Traders:
For instance, if you're trading a 4-hour chart of USDCHF:
Set the trend timeframe to Daily and the RSI timeframe to 4-Hour.
Watch for background color shifts and reversal markers to determine trend direction.
Use RSI bias to time your entries and exits, especially around overbought/oversold levels.
Enable bar coloring to quickly see when conditions favor either trend continuation or reversal.
This indicator is particularly effective for swing traders and those who want to align their trades with higher timeframe trends while using momentum and RSI for entry and exit signals.
For Day Traders
Timeframe Selection:
Trend Timeframe: Set to a higher intraday timeframe such as the 1 or 2 Hour chart.
RSI Timeframe: Set to a shorter timeframe like 15-10 Minutes or 5-Minutes to capture finer details of intraday momentum shifts.
Using the Indicator:
Trend Identification: Day traders can use the background color to quickly identify whether the market is in a bullish or bearish trend on the 1-Hour chart. A green background suggests looking for long opportunities, while a red background suggests short opportunities.
Momentum Analysis: The histogram can help day traders gauge the strength of the current trend. For example, if the histogram is green and above zero, the trader may consider buying pullbacks within the trend.
RSI Bias: Monitor RSI levels on the lower timeframe (e.g., 15-Minutes). If the RSI crosses below 40, it indicates an oversold condition, potentially signaling a buying opportunity, especially if it aligns with a bullish trend on the higher timeframe.
Trade Execution:
Look for entries when the RSI shows a reversal or pullback in the direction of the higher timeframe trend.
Use the trend reversal markers to confirm potential intraday reversals, adding extra confidence to trade setups.
For Scalpers
Timeframe Selection:
Trend Timeframe: Set to a short intraday timeframe like 15-Minutes or 5-Minutes.
RSI Timeframe: Use an even shorter timeframe, such as 1-Minute, to capture rapid price movements.
Final Notes:
The "Trend and RSI Bias Fusion" indicator is a powerful tool that combines trend analysis, momentum assessment, and RSI insights into one cohesive package. By integrating these different aspects, the indicator helps traders navigate complex market environments with greater clarity and confidence. Customize the settings to fit your specific trading style and market and use it to stay ahead of market trends and potential reversals.
My Scripts/Indicators/Ideas /Systems that I share are only for educational purposes!

Luxy Super-Duper SuperTrend Predictor Engine and Buy/Sell signalA professional trend-following grading system that analyzes historical trend
patterns to provide statistical duration estimates using advanced similarity
matching and k-nearest neighbors analysis. Combines adaptive Supertrend with
intelligent duration statistics, multi-timeframe confluence, volume confirmation,
and quality scoring to identify high-probability setups with data-driven
target ranges across all timeframes.
Note: All duration estimates are statistical calculations based on historical data, not guarantees of future performance.
WHAT MAKES THIS DIFFERENT
Unlike traditional SuperTrend indicators that only tell you trend direction, this system answers the critical question: "What is the typical duration for trends like this?"
The Statistical Analysis Engine:
• Analyzes your chart's last 15+ completed SuperTrend trends (bullish and bearish separately)
• Uses k-nearest neighbors similarity matching to find historically similar setups
• Calculates statistical duration estimates based on current market conditions
• Learns from estimation errors and adapts over time (Advanced mode)
• Displays visual duration analysis box showing median, average, and range estimates
• Tracks Statistical accuracy with backtest statistics
Complete Trading System:
• Statistical trend duration analysis with three intelligence levels
• Adaptive Supertrend with dynamic ATR-based bands
• Multi-timeframe confluence analysis (6 timeframes: 5M to 1W)
• Volume confirmation with spike detection and momentum tracking
• Quality scoring system (0-70 points) rating each setup
• One-click preset optimization for all trading styles
• Anti-repaint guarantee on all signals and duration estimates
METHODOLOGY CREDITS
This indicator's approach is inspired by proven trading methodologies from respected market educators:
• Mark Minervini - Volatility Contraction Pattern (VCP) and pullback entry techniques
• William O'Neil - Volume confirmation principles and institutional buying patterns (CANSLIM methodology)
• Dan Zanger - Volatility expansion entries and momentum breakout strategies
Important: These are educational references only. This indicator does not guarantee any specific trading results. Always conduct your own analysis and risk management.
KEY FEATURES
1. TREND DURATION ANALYSIS SYSTEM - The Core Innovation
The statistical analysis engine is what sets this indicator apart from standard SuperTrend systems. It doesn't just identify trend changes - it provides statistical analysis of potential duration.
How It Works:
Step 1: Historical Tracking
• Automatically records every completed SuperTrend trend (duration in bars)
• Maintains separate databases for bullish trends and bearish trends
• Stores up to 15 most recent trends of each type
• Captures market conditions at each trend flip: volume ratio, ATR ratio, quality score, price distance from SuperTrend, proximity to support/resistance
Step 2: Similarity Matching (k-Nearest Neighbors)
• When new trend begins, system compares current conditions to ALL historical flips
• Calculates similarity score based on:
- Volume similarity (30% weight) - Is volume behaving similarly?
- Volatility similarity (30% weight) - Is ATR/volatility similar?
- Quality similarity (20% weight) - Is setup strength comparable?
- Distance similarity (10% weight) - Is price distance from ST similar?
- Support/Resistance proximity (10% weight) - Similar structural context?
• Selects the 15 MOST SIMILAR historical trends (not just all trends)
• This is like asking: "When conditions looked like this before, how long did trends last?"
Step 3: Statistical Analysis
• Calculates median duration (most common outcome)
• Calculates average duration (mean of similar trends)
• Determines realistic range (min to max of similar trends)
• Applies exponential weighting (recent trends weighted more heavily)
• Outputs confidence-weighted statistical estimate
Step 4: Advanced Intelligence (Advanced Mode Only)
The Advanced mode applies five sophisticated multipliers to refine estimates:
A) Market Structure Multiplier (±30%):
• Detects nearby support/resistance levels using pivot detection
• If flip occurs NEAR a key level: Estimate adjusted -30% (expect bounce/rejection)
• If flip occurs in open space: Estimate adjusted +30% (clear path for continuation)
• Uses configurable lookback period and ATR-based proximity threshold
B) Asset Type Multiplier (±40%):
• Adjusts duration estimates based on asset volatility characteristics
• Small Cap / Biotech: +40% (explosive, extended moves)
• Tech Growth: +20% (momentum-driven, longer trends)
• Blue Chip / Large Cap: 0% (baseline, steady trends)
• Dividend / Value: -20% (slower, grinding trends)
• Cyclical: Variable based on macro regime
• Crypto / High Volatility: +30% (parabolic potential)
C) Flip Strength Multiplier (±20%):
• Analyzes the QUALITY of the trend flip itself
• Strong flip (high volume + expanding ATR + quality score 60+): +20%
• Weak flip (low volume + contracting ATR + quality score under 40): -20%
• Logic: Historical data shows that powerful flips tend to be followed by longer trends
D) Error Learning Multiplier (±15%):
• Tracks Statistical accuracy over last 10 completed trends
• Calculates error ratio: (estimated duration / Actual Duration)
• If system consistently over-estimates: Apply -15% correction
• If system consistently under-estimates: Apply +15% correction
• Learns and adapts to current market regime
E) Regime Detection Multiplier (±20%):
• Analyzes last 3 trends of SAME TYPE (bull-to-bull or bear-to-bear)
• Compares recent trend durations to historical average
• If recent trends 20%+ longer than average: +20% adjustment (trending regime detected)
• If recent trends 20%+ shorter than average: -20% adjustment (choppy regime detected)
• Detects whether market is in trending or mean-reversion mode
Three analysis modes:
SIMPLE MODE - Basic Statistics
• Uses raw median of similar trends only
• No multipliers, no adjustments
• Best for: Beginners, clean trending markets
• Fastest calculations, minimal complexity
STANDARD MODE - Full Statistical Analysis
• Similarity matching with k-nearest neighbors
• Exponential weighting of recent trends
• Median, average, and range calculations
• Best for: Most traders, general market conditions
• Balance of accuracy and simplicity
ADVANCED MODE - Statistics + Intelligence
• Everything in Standard mode PLUS
• All 5 advanced multipliers (structure, asset type, flip strength, learning, regime)
• Highest Statistical accuracy in testing
• Best for: Experienced traders, volatile/complex markets
• Maximum intelligence, most adaptive
Visual Duration Analysis Box:
When a new trend begins (SuperTrend flip), a box appears on your chart showing:
• Analysis Mode (Simple / Standard / Advanced)
• Number of historical trends analyzed
• Median expected duration (most likely outcome)
• Average expected duration (mean of similar trends)
• Range (minimum to maximum from similar trends)
• Advanced multipliers breakdown (Advanced mode only)
• Backtest accuracy statistics (if available)
The box extends from the flip bar to the estimated endpoint based on historical data, giving you a visual target for trend duration. Box updates in real-time as trend progresses.
Backtest & Accuracy Tracking:
• System backtests its own duration estimates using historical data
• Shows accuracy metrics: how well duration estimates matched actual durations
• Tracks last 10 completed duration estimates separately
• Displays statistics in dashboard and duration analysis boxes
• Helps you understand statistical reliability on your specific symbol/timeframe
Anti-Repaint Guarantee:
• duration analysis boxes only appear AFTER bar close (barstate.isconfirmed)
• Historical duration estimates never disappear or change
• What you see in history is exactly what you would have seen real-time
• No future data leakage, no lookahead bias
2. INTELLIGENT PRESET CONFIGURATIONS - One-Click Optimization
Unlike indicators that require tedious parameter tweaking, this system includes professionally optimized presets for every trading style. Select your approach from the dropdown and ALL parameters auto-configure.
"AUTO (DETECT FROM TF)" - RECOMMENDED
The smartest option: automatically selects optimal settings based on your chart timeframe.
• 1m-5m charts → Scalping preset (ATR: 7, Mult: 2.0)
• 15m-1h charts → Day Trading preset (ATR: 10, Mult: 2.5)
• 2h-4h-D charts → Swing Trading preset (ATR: 14, Mult: 3.0)
• W-M charts → Position Trading preset (ATR: 21, Mult: 4.0)
Benefits:
• Zero configuration - works immediately
• Always matched to your timeframe
• Switch timeframe = automatic adjustment
• Perfect for traders who use multiple timeframes
"SCALPING (1-5M)" - Ultra-Fast Signals
Optimized for: 1-5 minute charts, high-frequency trading, quick profits
Target holding period: Minutes to 1-2 hours maximum
Best markets: High-volume stocks, major crypto pairs, active futures
Parameter Configuration:
• Supertrend: ATR 7, Multiplier 2.0 (very sensitive)
• Volume: MA 10, High 1.8x, Spike 3.0x (catches quick surges)
• Volume Momentum: AUTO-DISABLED (too restrictive for fast scalping)
• Quality minimum: 40 points (accepts more setups)
• Duration Analysis: Uses last 15 trends with heavy recent weighting
Trading Logic:
Speed over precision. Short ATR period and low multiplier create highly responsive SuperTrend. Volume momentum filter disabled to avoid missing fast moves. Quality threshold relaxed to catch more opportunities in rapid market conditions.
Signals per session: 5-15 typically
Hold time: Minutes to couple hours
Best for: Active traders with fast execution
"DAY TRADING (15M-1H)" - Balanced Approach
Optimized for: 15-minute to 1-hour charts, intraday moves, session-based trading
Target holding period: 30 minutes to 8 hours (within trading day)
Best markets: Large-cap stocks, major indices, established crypto
Parameter Configuration:
• Supertrend: ATR 10, Multiplier 2.5 (balanced)
• Volume: MA 20, High 1.5x, Spike 2.5x (standard detection)
• Volume Momentum: 5/20 periods (confirms intraday strength)
• Quality minimum: 50 points (good setups preferred)
• Duration Analysis: Balanced weighting of recent vs historical
Trading Logic:
The most balanced configuration. ATR 10 with multiplier 2.5 provides steady trend following that avoids noise while catching meaningful moves. Volume momentum confirms institutional participation without being overly restrictive.
Signals per session: 2-5 typically
Hold time: 30 minutes to full day
Best for: Part-time and full-time active traders
"SWING TRADING (4H-D)" - Trend Stability
Optimized for: 4-hour to Daily charts, multi-day holds, trend continuation
Target holding period: 2-15 days typically
Best markets: Growth stocks, sector ETFs, trending crypto, commodity futures
Parameter Configuration:
• Supertrend: ATR 14, Multiplier 3.0 (stable)
• Volume: MA 30, High 1.3x, Spike 2.2x (accumulation focus)
• Volume Momentum: 10/30 periods (trend stability)
• Quality minimum: 60 points (high-quality setups only)
• Duration Analysis: Favors consistent historical patterns
Trading Logic:
Designed for substantial trend moves while filtering short-term noise. Higher ATR period and multiplier create stable SuperTrend that won't flip on minor corrections. Stricter quality requirements ensure only strongest setups generate signals.
Signals per week: 2-5 typically
Hold time: Days to couple weeks
Best for: Part-time traders, swing style
"POSITION TRADING (D-W)" - Long-Term Trends
Optimized for: Daily to Weekly charts, major trend changes, portfolio allocation
Target holding period: Weeks to months
Best markets: Blue-chip stocks, major indices, established cryptocurrencies
Parameter Configuration:
• Supertrend: ATR 21, Multiplier 4.0 (very stable)
• Volume: MA 50, High 1.2x, Spike 2.0x (long-term accumulation)
• Volume Momentum: 20/50 periods (major trend confirmation)
• Quality minimum: 70 points (excellent setups only)
• Duration Analysis: Heavy emphasis on multi-year historical data
Trading Logic:
Conservative approach focusing on major trend changes. Extended ATR period and high multiplier create SuperTrend that only flips on significant reversals. Very strict quality filters ensure signals represent genuine long-term opportunities.
Signals per month: 1-2 typically
Hold time: Weeks to months
Best for: Long-term investors, set-and-forget approach
"CUSTOM" - Advanced Configuration
Purpose: Complete manual control for experienced traders
Use when: You understand the parameters and want specific optimization
Best for: Testing new approaches, unusual market conditions, specific instruments
Full control over:
• All SuperTrend parameters
• Volume thresholds and momentum periods
• Quality scoring weights
• analysis mode and multipliers
• Advanced features tuning
Preset Comparison Quick Reference:
Chart Timeframe: Scalping (1M-5M) | Day Trading (15M-1H) | Swing (4H-D) | Position (D-W)
Signals Frequency: Very High | High | Medium | Low
Hold Duration: Minutes | Hours | Days | Weeks-Months
Quality Threshold: 40 pts | 50 pts | 60 pts | 70 pts
ATR Sensitivity: Highest | Medium | Lower | Lowest
Time Investment: Highest | High | Medium | Lowest
Experience Level: Expert | Advanced | Intermediate | Beginner+
3. QUALITY SCORING SYSTEM (0-70 Points)
Every signal is rated in real-time across three dimensions:
Volume Confirmation (0-30 points):
• Volume Spike (2.5x+ average): 30 points
• High Volume (1.5x+ average): 20 points
• Above Average (1.0x+ average): 10 points
• Below Average: 0 points
Volatility Assessment (0-30 points):
• Expanding ATR (1.2x+ average): 30 points
• Rising ATR (1.0-1.2x average): 15 points
• Contracting/Stable ATR: 0 points
Volume Momentum (0-10 points):
• Strong Momentum (1.2x+ ratio): 10 points
• Rising Momentum (1.0-1.2x ratio): 5 points
• Weak/Neutral Momentum: 0 points
Score Interpretation:
60-70 points - EXCELLENT:
• All factors aligned
• High conviction setup
• Maximum position size (within risk limits)
• Primary trading opportunities
45-59 points - STRONG:
• Multiple confirmations present
• Above-average setup quality
• Standard position size
• Good trading opportunities
30-44 points - GOOD:
• Basic confirmations met
• Acceptable setup quality
• Reduced position size
• Wait for additional confirmation or trade smaller
Below 30 points - WEAK:
• Minimal confirmations
• Low probability setup
• Consider passing
• Only for aggressive traders in strong trends
Only signals meeting your minimum quality threshold (configurable per preset) generate alerts and labels.
4. MULTI-TIMEFRAME CONFLUENCE ANALYSIS
The system can simultaneously analyze trend alignment across 6 timeframes (optional feature):
Timeframes analyzed:
• 5-minute (scalping context)
• 15-minute (intraday momentum)
• 1-hour (day trading bias)
• 4-hour (swing context)
• Daily (primary trend)
• Weekly (macro trend)
Confluence Interpretation:
• 5-6/6 aligned - Very strong multi-timeframe agreement (highest confidence)
• 3-4/6 aligned - Moderate agreement (standard setup)
• 1-2/6 aligned - Weak agreement (caution advised)
Dashboard shows real-time alignment count with color-coding. Higher confluence typically correlates with longer, stronger trends.
5. VOLUME MOMENTUM FILTER - Institutional Money Flow
Unlike traditional volume indicators that just measure size, Volume Momentum tracks the RATE OF CHANGE in volume:
How it works:
• Compares short-term volume average (fast period) to long-term average (slow period)
• Ratio above 1.0 = Volume accelerating (money flowing IN)
• Ratio above 1.2 = Strong acceleration (institutional participation likely)
• Ratio below 0.8 = Volume decelerating (money flowing OUT)
Why it matters:
• Confirms trend with actual money flow, not just price
• Leading indicator (volume often leads price)
• Catches accumulation/distribution before breakouts
• More intuitive than complex mathematical filters
Integration with signals:
• Optional filter - can be enabled/disabled per preset
• When enabled: Only signals with rising volume momentum fire
• AUTO-DISABLED in Scalping mode (too restrictive for fast trading)
• Configurable fast/slow periods per trading style
6. ADAPTIVE SUPERTREND MULTIPLIER
Traditional SuperTrend uses fixed ATR multiplier. This system dynamically adjusts the multiplier (0.8x to 1.2x base) based on:
• Trend Strength: Price correlation over lookback period
• Volume Weight: Current volume relative to average
Benefits:
• Tighter bands in calm markets (less premature exits)
• Wider bands in volatile conditions (avoids whipsaws)
• Better adaptation to biotech, small-cap, and crypto volatility
• Optional - can be disabled for classic constant multiplier
7. VISUAL GRADIENT RIBBON
26-layer exponential gradient fill between price and SuperTrend line provides instant visual trend strength assessment:
Color System:
• Green shades - Bullish trend + volume confirmation (strongest)
• Blue shades - Bullish trend, normal volume
• Orange shades - Bearish trend + volume confirmation
• Red shades - Bearish trend (weakest)
Opacity varies based on:
• Distance from SuperTrend (farther = more opaque)
• Volume intensity (higher volume = stronger color)
The ribbon provides at-a-glance trend strength without cluttering your chart. Can be toggled on/off.
8. INTELLIGENT ALERT SYSTEM
Two-tier alert architecture for flexibility:
Automatic Alerts:
• Fire automatically on BUY and SELL signals
• Include full context: quality score, volume state, volume momentum
• One alert per bar close (alert.freq_once_per_bar_close)
• Message format: "BUY: Supertrend bullish + Quality: 65/70 | Volume: HIGH | Vol Momentum: STRONG (1.35x)"
Customizable Alert Conditions:
• Appear in TradingView's "Create Alert" dialog
• Three options: BUY Signal Only, SELL Signal Only, ANY Signal (BUY or SELL)
• Use TradingView placeholders: {{ticker}}, {{interval}}, {{close}}, {{time}}
• Fully customizable message templates
All alerts use barstate.isconfirmed - Zero repaint guarantee.
9. ANTI-REPAINT ARCHITECTURE
Every component guaranteed non-repainting:
• Entry signals: Only appear after bar close
• duration analysis boxes: Created only on confirmed SuperTrend flips
• Informative labels: Wait for bar confirmation
• Alerts: Fire once per closed bar
• Multi-timeframe data: Uses lookahead=barmerge.lookahead_off
What you see in history is exactly what you would have seen in real-time. No disappearing signals, no changed duration estimates.
HOW TO USE THE INDICATOR
QUICK START - 3 Steps to Trading:
Step 1: Select Your Trading Style
Open indicator settings → "Quick Setup" section → Trading Style Preset dropdown
Options:
• Auto (Detect from TF) - RECOMMENDED: Automatically configures based on your chart timeframe
• Scalping (1-5m) - For 1-5 minute charts, ultra-fast signals
• Day Trading (15m-1h) - For 15m-1h charts, balanced approach
• Swing Trading (4h-D) - For 4h-Daily charts, trend stability
• Position Trading (D-W) - For Daily-Weekly charts, long-term trends
• Custom - Manual configuration (advanced users only)
Choose "Auto" and you're done - all parameters optimize automatically.
Step 2: Understand the Signals
BUY Signal (Green Triangle Below Price):
• SuperTrend flipped bullish
• Quality score meets minimum threshold (varies by preset)
• Volume confirmation present (if filter enabled)
• Volume momentum rising (if filter enabled)
• duration analysis box shows expected trend duration
SELL Signal (Red Triangle Above Price):
• SuperTrend flipped bearish
• Quality score meets minimum threshold
• Volume confirmation present (if filter enabled)
• Volume momentum rising (if filter enabled)
• duration analysis box shows expected trend duration
Duration Analysis Box:
• Appears at SuperTrend flip (start of new trend)
• Shows median, average, and range duration estimates
• Extends to estimated endpoint based on historical data visually
• Updates mode-specific intelligence (Simple/Standard/Advanced)
Step 3: Use the Dashboard for Context
Dashboard (top-right corner) shows real-time metrics:
• Row 1 - Quality Score: Current setup rating (0-70)
• Row 2 - SuperTrend: Direction and current level
• Row 3 - Volume: Status (Spike/High/Normal/Low) with color
• Row 4 - Volatility: State (Expanding/Rising/Stable/Contracting)
• Row 5 - Volume Momentum: Ratio and trend
• Row 6 - Duration Statistics: Accuracy metrics and track record
Every cell has detailed tooltip - hover for full explanations.
SIGNAL INTERPRETATION BY QUALITY SCORE:
Excellent Setup (60-70 points):
• Quality Score: 60-70
• Volume: Spike or High
• Volatility: Expanding
• Volume Momentum: Strong (1.2x+)
• MTF Confluence (if enabled): 5-6/6
• Action: Primary trade - maximum position size (within risk limits)
• Statistical reliability: Highest - duration estimates most accurate
Strong Setup (45-59 points):
• Quality Score: 45-59
• Volume: High or Above Average
• Volatility: Rising
• Volume Momentum: Rising (1.0-1.2x)
• MTF Confluence (if enabled): 3-4/6
• Action: Standard trade - normal position size
• Statistical reliability: Good - duration estimates reliable
Good Setup (30-44 points):
• Quality Score: 30-44
• Volume: Above Average
• Volatility: Stable or Rising
• Volume Momentum: Neutral to Rising
• MTF Confluence (if enabled): 3-4/6
• Action: Cautious trade - reduced position size, wait for additional confirmation
• Statistical reliability: Moderate - duration estimates less certain
Weak Setup (Below 30 points):
• Quality Score: Below 30
• Volume: Low or Normal
• Volatility: Contracting or Stable
• Volume Momentum: Weak
• MTF Confluence (if enabled): 1-2/6
• Action: Pass or wait for improvement
• Statistical reliability: Low - duration estimates unreliable
USING duration analysis boxES FOR TRADE MANAGEMENT:
Entry Timing:
• Enter on SuperTrend flip (signal bar close)
• duration analysis box appears simultaneously
• Note the median duration - this is your expected hold time
Profit Targets:
• Conservative: Use MEDIAN duration as profit target (50% probability)
• Moderate: Use AVERAGE duration (mean of similar trends)
• Aggressive: Aim for MAX duration from range (best historical outcome)
Position Management:
• Scale out at median duration (take partial profits)
• Trail stop as trend extends beyond median
• Full exit at average duration or SuperTrend flip (whichever comes first)
• Re-evaluate if trend exceeds estimated range
analysis mode Selection:
• Simple: Clean trending markets, beginners, minimal complexity
• Standard: Most markets, most traders (recommended default)
• Advanced: Volatile markets, complex instruments, experienced traders seeking highest accuracy
Asset Type Configuration (Advanced Mode):
If using Advanced analysis mode, configure Asset Type for optimal accuracy:
• Small Cap: Stocks under $2B market cap, low liquidity
• Biotech / Speculative: Clinical-stage pharma, penny stocks, high-risk
• Blue Chip / Large Cap: S&P 500, mega-cap tech, stable large companies
• Tech Growth: High-growth tech (TSLA, NVDA, growth SaaS)
• Dividend / Value: Dividend aristocrats, value stocks, utilities
• Cyclical: Energy, materials, industrials (macro-driven)
• Crypto / High Volatility: Bitcoin, altcoins, highly volatile assets
Correct asset type selection improves Statistical accuracy by 15-20%.
RISK MANAGEMENT GUIDELINES:
1. Stop Loss Placement:
Long positions:
• Place stop below recent swing low OR
• Place stop below SuperTrend level (whichever is tighter)
• Use 1-2 ATR distance as guideline
• Recommended: SuperTrend level (built-in volatility adjustment)
Short positions:
• Place stop above recent swing high OR
• Place stop above SuperTrend level (whichever is tighter)
• Use 1-2 ATR distance as guideline
• Recommended: SuperTrend level
2. Position Sizing by Quality Score:
• Excellent (60-70): Maximum position size (2% risk per trade)
• Strong (45-59): Standard position size (1.5% risk per trade)
• Good (30-44): Reduced position size (1% risk per trade)
• Weak (Below 30): Pass or micro position (0.5% risk - learning trades only)
3. Exit Strategy Options:
Option A - Statistical Duration-Based Exit:
• Exit at median estimated duration (conservative)
• Exit at average estimated duration (moderate)
• Trail stop beyond average duration (aggressive)
Option B - Signal-Based Exit:
• Exit on opposite signal (SELL after BUY, or vice versa)
• Exit on SuperTrend flip (trend reversal)
• Exit if quality score drops below 30 mid-trend
Option C - Hybrid (Recommended):
• Take 50% profit at median estimated duration
• Trail stop on remaining 50% using SuperTrend as trailing level
• Full exit on SuperTrend flip or quality collapse
4. Trade Filtering:
For higher win-rate (fewer trades, better quality):
• Increase minimum quality score (try 60 for swing, 50 for day trading)
• Enable volume momentum filter (ensure institutional participation)
• Require higher MTF confluence (5-6/6 alignment)
• Use Advanced analysis mode with appropriate asset type
For more opportunities (more trades, lower quality threshold):
• Decrease minimum quality score (40 for day trading, 35 for scalping)
• Disable volume momentum filter
• Lower MTF confluence requirement
• Use Simple or Standard analysis mode
SETTINGS OVERVIEW
Quick Setup Section:
• Trading Style Preset: Auto / Scalping / Day Trading / Swing / Position / Custom
Dashboard & Display:
• Show Dashboard (ON/OFF)
• Dashboard Position (9 options: Top/Middle/Bottom + Left/Center/Right)
• Text Size (Auto/Tiny/Small/Normal/Large/Huge)
• Show Ribbon Fill (ON/OFF)
• Show SuperTrend Line (ON/OFF)
• Bullish Color (default: Green)
• Bearish Color (default: Red)
• Show Entry Labels - BUY/SELL signals (ON/OFF)
• Show Info Labels - Volume events (ON/OFF)
• Label Size (Auto/Tiny/Small/Normal/Large/Huge)
Supertrend Configuration:
• ATR Length (default varies by preset: 7-21)
• ATR Multiplier Base (default varies by preset: 2.0-4.0)
• Use Adaptive Multiplier (ON/OFF) - Dynamic 0.8x-1.2x adjustment
• Smoothing Factor (0.0-0.5) - EMA smoothing applied to bands
• Neutral Bars After Flip (0-10) - Hide ST immediately after flip
Volume Momentum:
• Enable Volume Momentum Filter (ON/OFF)
• Fast Period (default varies by preset: 3-20)
• Slow Period (default varies by preset: 10-50)
Volume Analysis:
• Volume MA Length (default varies by preset: 10-50)
• High Volume Threshold (default: 1.5x)
• Spike Threshold (default: 2.5x)
• Low Volume Threshold (default: 0.7x)
Quality Filters:
• Minimum Quality Score (0-70, varies by preset)
• Require Volume Confirmation (ON/OFF)
Trend Duration Analysis:
• Show Duration Analysis (ON/OFF) - Display duration analysis boxes
• analysis mode - Simple / Standard / Advanced
• Asset Type - 7 options (Small Cap, Biotech, Blue Chip, Tech Growth, Dividend, Cyclical, Crypto)
• Use Exponential Weighting (ON/OFF) - Recent trends weighted more
• Decay Factor (0.5-0.99) - How much more recent trends matter
• Structure Lookback (3-30) - Pivot detection period for support/resistance
• Proximity Threshold (xATR) - How close to level qualifies as "near"
• Enable Error Learning (ON/OFF) - System learns from estimation errors
• Memory Depth (3-20) - How many past errors to remember
Box Visual Settings:
• duration analysis box Border Color
• duration analysis box Background Color
• duration analysis box Text Color
• duration analysis box Border Width
• duration analysis box Transparency
Multi-Timeframe (Optional Feature):
• Enable MTF Confluence (ON/OFF)
• Minimum Alignment Required (0-6)
• Individual timeframe enable/disable toggles
• Custom timeframe selection options
All preset configurations override manual inputs except when "Custom" is selected.
ADVANCED FEATURES
1. Scalpel Mode (Optional)
Advanced pullback entry system that waits for healthy retracements within established trends before signaling entry:
• Monitors price distance from SuperTrend levels
• Requires pullback to configurable range (default: 30-50%)
• Ensures trend remains intact before entry signal
• Reduces whipsaw and false breakouts
• Inspired by Mark Minervini's VCP pullback entries
Best for: Swing traders and day traders seeking precision entries
Scalpers: Consider disabling for faster entries
2. Error Learning System (Advanced analysis mode Only)
The system learns from its own estimation errors:
• Tracks last 10-20 completed duration estimates (configurable memory depth)
• Calculates error ratio for each: estimated duration / Actual Duration
• If system consistently over-estimates: Applies negative correction (-15%)
• If system consistently under-estimates: Applies positive correction (+15%)
• Adapts to current market regime automatically
This self-correction mechanism improves accuracy over time as the system gathers more data on your specific symbol and timeframe.
3. Regime Detection (Advanced analysis mode Only)
Automatically detects whether market is in trending or choppy regime:
• Compares last 3 trends to historical average
• Recent trends 20%+ longer → Trending regime (+20% to estimates)
• Recent trends 20%+ shorter → Choppy regime (-20% to estimates)
• Applied separately to bullish and bearish trends
Helps duration estimates adapt to changing market conditions without manual intervention.
4. Exponential Weighting
Option to weight recent trends more heavily than distant history:
• Default decay factor: 0.9
• Recent trends get higher weight in statistical calculations
• Older trends gradually decay in importance
• Rationale: Recent market behavior more relevant than old data
• Can be disabled for equal weighting
5. Backtest Statistics
System backtests its own duration estimates using historical data:
• Walks through past trends chronologically
• Calculates what duration estimate WOULD have been at each flip
• Compares to actual duration that occurred
• Displays accuracy metrics in duration analysis boxes and dashboard
• Helps assess statistical reliability on your specific chart
Note: Backtest uses only data available AT THE TIME of each historical flip (no lookahead bias).
TECHNICAL SPECIFICATIONS
• Pine Script Version: v6
• Indicator Type: Overlay (draws on price chart)
• Max Boxes: 500 (for duration analysis box storage)
• Max Bars Back: 5000 (for comprehensive historical analysis)
• Security Calls: 1 (for MTF if enabled - optimized)
• Repainting: NO - All signals and duration estimates confirmed on bar close
• Lookahead Bias: NO - All HTF data properly offset, all duration estimates use only historical data
• Real-time Updates: YES - Dashboard and quality scores update live
• Alert Capable: YES - Both automatic alerts and customizable alert conditions
• Multi-Symbol: Works on stocks, crypto, forex, futures, indices
Performance Optimization:
• Conditional calculations (duration analysis can be disabled to reduce load)
• Efficient array management (circular buffers for trend storage)
• Streamlined gradient rendering (26 layers, can be toggled off)
• Smart label cooldown system (prevents label spam)
• Optimized similarity matching (analyzes only relevant trends)
Data Requirements:
• Minimum 50-100 bars for initial duration analysis (builds historical database)
• Optimal: 500+ bars for robust statistical analysis
• Longer history = more accurate duration estimates
• Works on any timeframe from 1 minute to monthly
KNOWN LIMITATIONS
• Trending Markets Only: Performs best in clear trends. May generate false signals in choppy/sideways markets (use quality score filtering and regime detection to mitigate)
• Lagging Nature: Like all trend-following systems, signals occur AFTER trend establishment, not at exact tops/bottoms. Use duration analysis boxes to set realistic profit targets.
• Initial Learning Period: Duration analysis system requires 10-15 completed trends to build reliable historical database. Early duration estimates less accurate (first few weeks on new symbol/timeframe).
• Visual Load: 26-layer gradient ribbon may slow performance on older devices. Disable ribbon if experiencing lag.
• Statistical accuracy Variables: Duration estimates are statistical estimates, not guarantees. Accuracy varies by:
- Market regime (trending vs choppy)
- Asset volatility characteristics
- Quality of historical pattern matches
- Timeframe traded (higher TF = more reliable)
• Not Best Suitable For:
- Ultra-short-term scalping (sub-1-minute charts)
- Mean-reversion strategies (designed for trend-following)
- Range-bound trading (requires trending conditions)
- News-driven spikes (estimates based on technical patterns, not fundamentals)
FREQUENTLY ASKED QUESTIONS
Q: Does this indicator repaint?
A: Absolutely not. All signals, duration analysis boxes, labels, and alerts use barstate.isconfirmed checks. They only appear after the bar closes. What you see in history is exactly what you would have seen in real-time. Zero repaint guarantee.
Q: How accurate are the trend duration estimates?
A: Accuracy varies by mode, market conditions, and historical data quality:
• Simple mode: 60-70% accuracy (within ±20% of actual duration)
• Standard mode: 70-80% accuracy (within ±20% of actual duration)
• Advanced mode: 75-85% accuracy (within ±20% of actual duration)
Best accuracy achieved on:
• Higher timeframes (4H, Daily, Weekly)
• Trending markets (not choppy/sideways)
• Assets with consistent behavior (Blue Chip, Large Cap)
• After 20+ historical trends analyzed (builds robust database)
Remember: All duration estimates are statistical calculations based on historical patterns, not guarantees.
Q: Which analysis mode should I use?
A:
• Simple: Beginners, clean trending markets, want minimal complexity
• Standard: Most traders, general market conditions (RECOMMENDED DEFAULT)
• Advanced: Experienced traders, volatile/complex markets (biotech, small-cap, crypto), seeking maximum accuracy
Advanced mode requires correct Asset Type configuration for optimal results.
Q: What's the difference between the trading style presets?
A: Each preset optimizes ALL parameters for a specific trading approach:
• Scalping: Ultra-sensitive (ATR 7, Mult 2.0), more signals, shorter holds
• Day Trading: Balanced (ATR 10, Mult 2.5), moderate signals, intraday holds
• Swing Trading: Stable (ATR 14, Mult 3.0), fewer signals, multi-day holds
• Position Trading: Very stable (ATR 21, Mult 4.0), rare signals, week/month holds
Auto mode automatically selects based on your chart timeframe.
Q: Should I use Auto mode or manually select a preset?
A: Auto mode is recommended for most traders. It automatically matches settings to your timeframe and re-optimizes if you switch charts. Only use manual preset selection if:
• You want scalping settings on a 15m chart (overriding auto-detection)
• You want swing settings on a 1h chart (more conservative than auto would give)
• You're testing different approaches on same timeframe
Q: Can I use this for scalping and day trading?
A: Absolutely! The preset system is specifically designed for all trading styles:
• Select "Scalping (1-5m)" for 1-5 minute charts
• Select "Day Trading (15m-1h)" for 15m-1h charts
• Or use "Auto" mode and it configures automatically
Volume momentum filter is auto-disabled in Scalping mode for faster signals.
Q: What is Volume Momentum and why does it matter?
A: Volume Momentum compares short-term volume (fast MA) to long-term volume (slow MA). It answers: "Is money flowing into this asset faster now than historically?"
Why it matters:
• Volume often leads price (early warning system)
• Confirms institutional participation (smart money)
• No lag like price-based indicators
• More intuitive than complex mathematical filters
When the ratio is above 1.2, you have strong evidence that institutions are accumulating (bullish) or distributing (bearish).
Q: How do I set up alerts?
A: Two options:
Option 1 - Automatic Alerts:
1. Right-click on chart → Add Alert
2. Condition: Select this indicator
3. Choose "Any alert() function call"
4. Configure notification method (app, email, webhook)
5. You'll receive detailed alerts on every BUY and SELL signal
Option 2 - Customizable Alert Conditions:
1. Right-click on chart → Add Alert
2. Condition: Select this indicator
3. You'll see three options in dropdown:
- "BUY Signal" (long signals only)
- "SELL Signal" (short signals only)
- "ANY Signal" (both BUY and SELL)
4. Choose desired option and customize message template
5. Uses TradingView placeholders: {{ticker}}, {{close}}, {{time}}, etc.
All alerts fire only on confirmed bar close (no repaint).
Q: What is Scalpel Mode and should I use it?
A: Scalpel Mode waits for healthy pullbacks within established trends before signaling entry. It reduces whipsaws and improves entry timing.
Recommended ON for:
• Swing traders (want precision entries on pullbacks)
• Day traders (willing to wait for better prices)
• Risk-averse traders (prefer fewer but higher-quality entries)
Recommended OFF for:
• Scalpers (need immediate entries, can't wait for pullbacks)
• Momentum traders (want to enter on breakout, not pullback)
• Aggressive traders (prefer more opportunities over precision)
Q: Why do some duration estimates show wider ranges than others?
A: Range width reflects historical trend variability:
• Narrow range: Similar historical trends had consistent durations (high confidence)
• Wide range: Similar historical trends had varying durations (lower confidence)
Wide ranges often occur:
• Early in analysis (fewer historical trends to learn from)
• In volatile/choppy markets (inconsistent trend behavior)
• On lower timeframes (more noise, less consistency)
The median and average still provide useful targets even when range is wide.
Q: Can I customize the dashboard position and appearance?
A: Yes! Dashboard settings include:
• Position: 9 options (Top/Middle/Bottom + Left/Center/Right)
• Text Size: Auto, Tiny, Small, Normal, Large, Huge
• Show/Hide: Toggle entire dashboard on/off
Choose position that doesn't overlap important price action on your specific chart.
Q: Which timeframe should I trade on?
A: Depends on your trading style and time availability:
• 1-5 minute: Active scalping, requires constant monitoring
• 15m-1h: Day trading, check few times per session
• 4h-Daily: Swing trading, check once or twice daily
• Daily-Weekly: Position trading, check weekly
General principle: Higher timeframes produce:
• Fewer signals (less frequent)
• Higher quality setups (stronger confirmations)
• More reliable duration estimates (better statistical data)
• Less noise (clearer trends)
Start with Daily chart if new to trading. Move to lower timeframes as you gain experience.
Q: Does this work on all markets (stocks, crypto, forex)?
A: Yes, it works on all markets with trending characteristics:
Excellent for:
• Stocks (especially growth and momentum names)
• Crypto (BTC, ETH, major altcoins)
• Futures (indices, commodities)
• Forex majors (EUR/USD, GBP/USD, etc.)
Best results on:
• Trending markets (not range-bound)
• Liquid instruments (tight spreads, good fills)
• Volatile assets (clear trend development)
Less effective on:
• Range-bound/sideways markets
• Ultra-low volatility instruments
• Illiquid small-caps (use caution)
Configure Asset Type (in Advanced analysis mode) to match your instrument for best accuracy.
Q: How many signals should I expect per day/week?
A: Highly variable based on:
By Timeframe:
• 1-5 minute: 5-15 signals per session
• 15m-1h: 2-5 signals per day
• 4h-Daily: 2-5 signals per week
• Daily-Weekly: 1-2 signals per month
By Market Volatility:
• High volatility = more SuperTrend flips = more signals
• Low volatility = fewer flips = fewer signals
By Quality Filter:
• Higher threshold (60-70) = fewer but better signals
• Lower threshold (30-40) = more signals, lower quality
By Volume Momentum Filter:
• Enabled = Fewer signals (only volume-confirmed)
• Disabled = More signals (all SuperTrend flips)
Adjust quality threshold and filters to match your desired signal frequency.
Q: What's the difference between entry labels and info labels?
A:
Entry Labels (BUY/SELL):
• Your primary trading signals
• Based on SuperTrend flip + all confirmations (quality, volume, momentum)
• Include quality score and confirmation icons
• These are actionable entry points
Info Labels (Volume Spike):
• Additional market context
• Show volume events that may support or contradict trend
• 8-bar cooldown to prevent spam
• NOT necessarily entry points - contextual information only
Control separately: Can show entry labels without info labels (recommended for clean charts).
Q: Can I combine this with other indicators?
A: Absolutely! This works well with:
• RSI: For divergences and overbought/oversold conditions
• Support/Resistance: Confluence with key levels
• Fibonacci Retracements: Pullback targets in Scalpel Mode
• Price Action Patterns: Flags, pennants, cup-and-handle
• MACD: Additional momentum confirmation
• Bollinger Bands: Volatility context
This indicator provides trend direction and duration estimates - complement with other tools for entry refinement and additional confluence.
Q: Why did I get a low-quality signal? Can I filter them out?
A: Yes! Increase the Minimum Quality Score in settings.
If you're seeing signals with quality below your preference:
• Day Trading: Set minimum to 50
• Swing Trading: Set minimum to 60
• Position Trading: Set minimum to 70
Only signals meeting the threshold will appear. This reduces frequency but improves win-rate.
Q: How do I interpret the MTF Confluence count?
A: Shows how many of 6 timeframes agree with current trend:
• 6/6 aligned: Perfect agreement (extremely rare, highest confidence)
• 5/6 aligned: Very strong alignment (high confidence)
• 4/6 aligned: Good alignment (standard quality setup)
• 3/6 aligned: Moderate alignment (acceptable)
• 2/6 aligned: Weak alignment (caution)
• 1/6 aligned: Very weak (likely counter-trend)
Higher confluence typically correlates with longer, stronger trends. However, MTF analysis is optional - you can disable it and rely solely on quality scoring.
Q: Is this suitable for beginners?
A: Yes, but requires foundational knowledge:
You should understand:
• Basic trend-following concepts (higher highs, higher lows)
• Risk management principles (position sizing, stop losses)
• How to read candlestick charts
• What volume and volatility mean
Beginner-friendly features:
• Auto preset mode (zero configuration)
• Quality scoring (tells you signal strength)
• Dashboard tooltips (hover for explanations)
• duration analysis boxes (visual profit targets)
Recommended for beginners:
1. Start with "Auto" or "Swing Trading" preset on Daily chart
2. Use Standard Analysis Mode (not Advanced)
3. Set minimum quality to 60 (fewer but better signals)
4. Paper trade first for 2-4 weeks
5. Study methodology references (Minervini, O'Neil, Zanger)
Q: What is the Asset Type setting and why does it matter?
A: Asset Type (in Advanced analysis mode) adjusts duration estimates based on volatility characteristics:
• Small Cap: Explosive moves, extended trends (+30-40%)
• Biotech / Speculative: Parabolic potential, news-driven (+40%)
• Blue Chip / Large Cap: Baseline, steady trends (0% adjustment)
• Tech Growth: Momentum-driven, longer trends (+20%)
• Dividend / Value: Slower, grinding trends (-20%)
• Cyclical: Macro-driven, variable (±10%)
• Crypto / High Volatility: Parabolic potential (+30%)
Correct configuration improves Statistical accuracy by 15-20%. Using Blue Chip settings on a biotech stock may underestimate trend length (you'll exit too early).
Q: Can I backtest this indicator?
A: Yes! TradingView's Strategy Tester works with this indicator's signals.
To backtest:
1. Note the entry conditions (SuperTrend flip + quality threshold + filters)
2. Create a strategy script using same logic
3. Run Strategy Tester on historical data
Additionally, the indicator includes BUILT-IN duration estimate validation:
• System backtests its own duration estimates
• Shows accuracy metrics in dashboard and duration analysis boxes
• Helps assess reliability on your specific symbol/timeframe
Q: Why does Volume Momentum auto-disable in Scalping mode?
A: Scalping requires ultra-fast entries to catch quick moves. Volume Momentum filter adds friction by requiring volume confirmation before signaling, which can cause missed opportunities in rapid scalping.
Scalping preset is optimized for speed and frequency - the filter is counterproductive for that style. It remains enabled for Day Trading, Swing Trading, and Position Trading presets where patience improves results.
You can manually enable it in Custom mode if desired.
Q: How much historical data do I need for accurate duration estimates?
A:
Minimum: 50-100 bars (indicator will function but duration estimates less reliable)
Recommended: 500+ bars (robust statistical database)
Optimal: 1000+ bars (maximum Statistical accuracy)
More history = more completed trends = better pattern matching = more accurate duration estimates.
New symbols or newly-switched timeframes will have lower Statistical accuracy initially. Allow 2-4 weeks for the system to build historical database.
IMPORTANT DISCLAIMERS
No Guarantee of Profit:
This indicator is an educational tool and does not guarantee any specific trading results. All trading involves substantial risk of loss. Duration estimates are statistical calculations based on historical patterns and are not guarantees of future performance.
Past Performance:
Historical backtest results and Statistical accuracy statistics do not guarantee future performance. Market conditions change constantly. What worked historically may not work in current or future markets.
Not Financial Advice:
This indicator provides technical analysis signals and statistical duration estimates only. It is not financial, investment, or trading advice. Always consult with a qualified financial advisor before making investment decisions.
Risk Warning:
Trading stocks, options, futures, forex, and cryptocurrencies involves significant risk. You can lose all of your invested capital. Never trade with money you cannot afford to lose. Only risk capital you can lose without affecting your lifestyle.
Testing Required:
Always test this indicator on a demo account or with paper trading before risking real capital. Understand how it works in different market conditions. Verify Statistical accuracy on your specific instruments and timeframes before trusting it with real money.
User Responsibility:
You are solely responsible for your trading decisions. The developer assumes no liability for trading losses, incorrect duration estimates, software errors, or any other damages incurred while using this indicator.
Statistical Estimation Limitations:
Trend Duration estimates are statistical estimates based on historical pattern matching. They are NOT guarantees. Actual trend durations may differ significantly from duration estimates due to unforeseen news events, market regime changes, or lack of historical precedent for current conditions.
CREDITS & ACKNOWLEDGMENTS
Methodology Inspiration:
• Mark Minervini - Volatility Contraction Pattern (VCP) concepts and pullback entry techniques
• William O'Neil - Volume analysis principles and CANSLIM institutional buying patterns
• Dan Zanger - Momentum breakout strategies and volatility expansion entries
Technical Components:
• SuperTrend calculation - Classic ATR-based trend indicator (public domain)
• Statistical analysis - Standard median, average, range calculations
• k-Nearest Neighbors - Classic machine learning similarity matching concept
• Multi-timeframe analysis - Standard request.security implementation in Pine Script
For questions, feedback, or support, please comment below or send a private message.
Happy Trading!

Equal Highs and Equal LowsA simple indicator that detects if two candles lows or highs are equal. The pattern simply indicates the possibility of a reversal. However, many traders also use the Equal highs/lows within a broader context of market analysis to provide insights for trend traders, especially to detect pullbacks.
Equal Highs/Lows are a pattern that can indicate a shift in a trend direction or to find pullbacks within an established trend. The idea behind the equal highs and lows is that the first candle shows a strong move in the current direction, and the second candle pauses the previous candlestick price action. It's a clear sign that the momentum is slowing down. This insight is valuable for traders and can detect a potential change in the trend direction.
Usage
Use the pattern to find reversals.
Use the pattern to find pullbacks.
Disclaimer: No financial advice, only for educational/entertainment purposes.
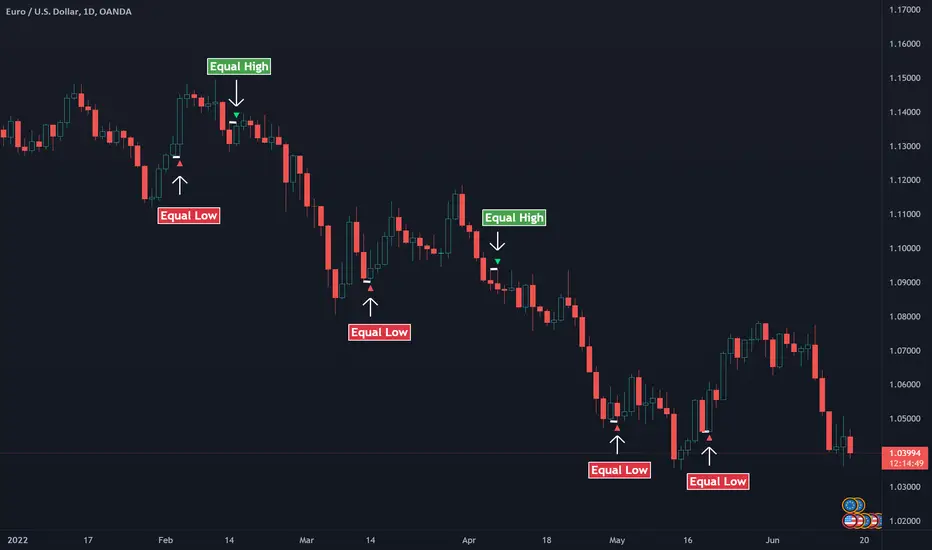
Yetty TradesTrading Strategy Guide
How to use this indicator for breakout trading with pullback entries
Phase 1
Identify Setup
Look for price consolidating near key levels (previous day H/L, session H/L)
Check if price is respecting EMAs (9, 21, or 200)
Note the opening range box boundaries
Watch for price approaching VWAP
Phase 2
Wait for Breakout
Wait for price to break above/below opening range
Look for breakout beyond session highs/lows
Confirm with volume and momentum
Watch for bullish/bearish hammer patterns at key levels
Phase 3
Enter on Pullback
After breakout, wait for price to pull back to EMAs
Look for price to retest the opening range boundary
Enter when price finds support/resistance at key levels
Use hammer patterns as entry confirmation signals
Clean Layout
• Daily Reset: All levels automatically reset each day - no historical clutter
• Current Day Only: Opening Range box only shows for today's session
• Clean Lines: Levels use lines instead of extending plots for cleaner charts
• Labels: CDH, CDL, PDH, PDL, PMH, PML labels for easy identification
• Pre-Market: Track pre-market high/low levels (04:00-09:30)
Trading Tips
• Risk Management: Always use stop losses below/above key levels
• Confirmation: Wait for multiple indicators to align before entering
• Time of Day: Breakouts during London/New York open tend to be more reliable
• Volume: Higher volume on breakouts increases probability of success
• False Breakouts: Opening range helps filter out early false moves
Example Trade Setup
1. Market Opens: Opening range box forms in first 15 minutes (9:30-9:45 AM)
2. Consolidation: Price trades within the OR box, respecting boundaries
3. Breakout: Price breaks above OR high with strong momentum, confirmed by volume
4. Pullback: Price pulls back to test the OR high (now support) and 21 EMA
5. Entry: Bullish hammer forms at the pullback level → Enter long
6. Target: Previous day high or session high
7. Stop Loss: Below the pullback low or below OR box

Intrabar Volume Flow IntelligenceIntrabar Volume Flow Intelligence: A Comprehensive Analysis:
The Intrabar Volume Flow Intelligence indicator represents a sophisticated approach to understanding market dynamics through the lens of volume analysis at a granular, intrabar level. This Pine Script version 5 indicator transcends traditional volume analysis by dissecting price action within individual bars to reveal the true nature of buying and selling pressure that often remains hidden when examining only the external characteristics of completed candlesticks. At its core, this indicator operates on the principle that volume is the fuel that drives price movement, and by understanding where volume is being applied within each bar—whether at higher prices indicating buying pressure or at lower prices indicating selling pressure—traders can gain a significant edge in anticipating future price movements before they become obvious to the broader market.
The foundational innovation of this indicator lies in its use of lower timeframe data to analyze what happens inside each bar on your chart timeframe. While most traders see only the open, high, low, and close of a five-minute candle, for example, this indicator requests data from a one-minute timeframe by default to see all the individual one-minute candles that comprise that five-minute bar. This intrabar analysis allows the indicator to calculate a weighted intensity score based on where the price closed within each sub-bar's range. If the close is near the high, that volume is attributed more heavily to buying pressure; if near the low, to selling pressure. This methodology is far more nuanced than simple tick volume analysis or even traditional volume delta calculations because it accounts for the actual price behavior and distribution of volume throughout the formation of each bar, providing a three-dimensional view of market participation.
The intensity calculation itself demonstrates the coding sophistication embedded in this indicator. For each intrabar segment, the indicator calculates a base intensity using the formula of close minus low divided by the range between high and low. This gives a value between zero and one, where values approaching one indicate closes near the high and values approaching zero indicate closes near the low. However, the indicator doesn't stop there—it applies an open adjustment factor that considers the relationship between the close and open positions within the overall range, adding up to twenty percent additional weighting based on directional movement. This adjustment ensures that strongly directional intrabar movement receives appropriate emphasis in the final volume allocation. The adjusted intensity is then bounded between zero and one to prevent extreme outliers from distorting the analysis, demonstrating careful consideration of edge cases and data integrity.
The volume flow calculation multiplies this intensity by the actual volume transacted in each intrabar segment, creating buy volume and sell volume figures that represent not just quantity but quality of market participation. These figures are accumulated across all intrabar segments within the parent bar, and simultaneously, a volume-weighted average price is calculated for the entire bar using the typical price of each segment multiplied by its volume. This intrabar VWAP becomes a critical reference point for understanding whether the overall bar is trading above or below its fair value as determined by actual transaction levels. The deviation from this intrabar VWAP is then used as a weighting mechanism—when the close is significantly above the intrabar VWAP, buying volume receives additional weight; when below, selling volume is emphasized. This creates a feedback loop where volume that moves price away from equilibrium is recognized as more significant than volume that keeps price near balance.
The imbalance filter represents another layer of analytical sophistication that separates meaningful volume flows from normal market noise. The indicator calculates the absolute difference between buy and sell volume as a percentage of total volume, and this imbalance must exceed a user-defined threshold—defaulted to twenty-five percent but adjustable from five to eighty percent—before the volume flow is considered significant enough to register on the indicator. This filtering mechanism ensures that only bars with clear directional conviction contribute to the cumulative flow measurements, while bars with balanced buying and selling are essentially ignored. This is crucial because markets spend considerable time in equilibrium states where volume is simply facilitating position exchanges without directional intent. By filtering out these neutral periods, the indicator focuses trader attention exclusively on moments when one side of the market is demonstrating clear dominance.
The decay factor implementation showcases advanced state management in Pine Script coding. Rather than allowing imbalanced volume to simply disappear after one bar, the indicator maintains decayed values using variable state that persists across bars. When a new significant imbalance occurs, it replaces the decayed value; when no significant imbalance is present, the previous value is multiplied by the decay factor, which defaults to zero point eight-five. This means that a large volume imbalance continues to influence the indicator for several bars afterward, gradually diminishing in impact unless reinforced by new imbalances. This decay mechanism creates persistence in the flow measurements, acknowledging that large institutional volume accumulation or distribution campaigns don't execute in single bars but rather unfold across multiple bars. The cumulative flow calculation then sums these decayed values over a lookback period, creating a running total that represents sustained directional pressure rather than momentary spikes.
The dual moving average crossover system applied to these volume flows creates actionable trading signals from the underlying data. The indicator calculates both a fast exponential moving average and a slower simple moving average of the buy flow, sell flow, and net flow values. The use of EMA for the fast line provides responsiveness to recent changes while the SMA for the slow line provides a more stable baseline, and the divergence or convergence between these averages signals shifts in volume flow momentum. When the buy flow EMA crosses above its SMA while volume is elevated, this indicates that buying pressure is not only present but accelerating, which is the foundation for the strong buy signal generation. The same logic applies inversely for selling pressure, creating a symmetrical approach to detecting both upside and downside momentum shifts based on volume characteristics rather than price characteristics.
The volume threshold filtering ensures that signals only generate during periods of statistically significant market participation. The indicator calculates a simple moving average of total volume over a user-defined period, defaulted to twenty bars, and then requires that current volume exceed this average by a multiplier, defaulted to one point two times. This ensures that signals occur during periods when the market is actively engaged rather than during quiet periods when a few large orders can create misleading volume patterns. The indicator even distinguishes between high volume—exceeding the threshold—and very high volume—exceeding one point five times the threshold—with the latter triggering background color changes to alert traders to exceptional participation levels. This tiered volume classification allows traders to calibrate their position sizing and conviction levels based on the strength of market participation supporting the signal.
The flow momentum calculation adds a velocity dimension to the volume analysis. By calculating the rate of change of the net flow EMA over a user-defined momentum length—defaulted to five bars—the indicator measures not just the direction of volume flow but the acceleration or deceleration of that flow. A positive and increasing flow momentum indicates that buying pressure is not only dominant but intensifying, which typically precedes significant upward price movements. Conversely, negative and decreasing flow momentum suggests selling pressure is building upon itself, often preceding breakdowns. The indicator even calculates a second derivative—the momentum of momentum, termed flow acceleration—which can identify very early turning points when the rate of change itself begins to shift, providing the most forward-looking signal available from this methodology.
The divergence detection system represents one of the most powerful features for identifying potential trend reversals and continuations. The indicator maintains separate tracking of price extremes and flow extremes over a lookback period defaulted to fourteen bars. A bearish divergence is identified when price makes a new high or equals the recent high, but the net flow EMA is significantly below its recent high—specifically less than eighty percent of that high—and is declining compared to its value at the divergence lookback distance. This pattern indicates that while price is pushing higher, the volume support for that movement is deteriorating, which frequently precedes reversals. Bullish divergences work inversely, identifying situations where price makes new lows without corresponding weakness in volume flow, suggesting that selling pressure is exhausted and a reversal higher is probable. These divergence signals are plotted as distinct diamond shapes on the indicator, making them visually prominent for trader attention.
The accumulation and distribution zone detection provides a longer-term context for understanding institutional positioning. The indicator uses the bars-since function to track consecutive periods where the net flow EMA has remained positive or negative. When buying pressure has persisted for at least five consecutive bars, average intensity exceeds zero point six indicating strong closes within bar ranges, and volume is elevated above the threshold, the indicator identifies an accumulation zone. These zones suggest that smart money is systematically building long positions across multiple bars despite potentially choppy or sideways price action. Distribution zones are identified through the inverse criteria, revealing periods when institutions are systematically exiting or building short positions. These zones are visualized through colored fills on the indicator pane, creating a backdrop that helps traders understand the broader volume flow context beyond individual bar signals.
The signal strength scoring system provides a quantitative measure of conviction for each buy or sell signal. Rather than treating all signals as equal, the indicator assigns point values to different signal components: twenty-five points for the buy flow EMA-SMA crossover, twenty-five points for the net flow EMA-SMA crossover, twenty points for high volume presence, fifteen points for positive flow momentum, and fifteen points for bullish divergence presence. These points are summed to create a buy score that can range from zero to one hundred percent, with higher scores indicating that multiple independent confirmation factors are aligned. The same methodology creates a sell score, and these scores are displayed in the information table, allowing traders to quickly assess whether a signal represents a tentative suggestion or a high-conviction setup. This scoring approach transforms the indicator from a binary signal generator into a nuanced probability assessment tool.
The visual presentation of the indicator demonstrates exceptional attention to user experience and information density. The primary display shows the net flow EMA as a thick colored line that transitions between green when above zero and above its SMA, indicating strong buying, to a lighter green when above zero but below the SMA, indicating weakening buying, to red when below zero and below the SMA, indicating strong selling, to a lighter red when below zero but above the SMA, indicating weakening selling. This color gradient provides immediate visual feedback about both direction and momentum of volume flows. The net flow SMA is overlaid in orange as a reference line, and a zero line is drawn to clearly delineate positive from negative territory. Behind these lines, a histogram representation of the raw net flow—scaled down by thirty percent for visibility—shows bar-by-bar flow with color intensity reflecting whether flow is strengthening or weakening compared to the previous bar. This layered visualization allows traders to simultaneously see the raw data, the smoothed trend, and the trend of the trend, accommodating both short-term and longer-term trading perspectives.
The cumulative delta line adds a macro perspective by maintaining a running sum of all volume deltas divided by one million for scale, plotted in purple as a separate series. This cumulative measure acts similar to an on-balance volume calculation but with the sophisticated volume attribution methodology of this indicator, creating a long-term sentiment gauge that can reveal whether an asset is under sustained accumulation or distribution across days, weeks, or months. Divergences between this cumulative delta and price can identify major trend exhaustion or reversal points that might not be visible in the shorter-term flow measurements.
The signal plotting uses shape-based markers rather than background colors or arrows to maximize clarity while preserving chart space. Strong buy signals—meeting multiple criteria including EMA-SMA crossover, high volume, and positive momentum—appear as full-size green triangle-up shapes at the bottom of the indicator pane. Strong sell signals appear as full-size red triangle-down shapes at the top. Regular buy and sell signals that meet fewer criteria appear as smaller, semi-transparent circles, indicating they warrant attention but lack the full confirmation of strong signals. Divergence-based signals appear as distinct diamond shapes in cyan for bullish divergences and orange for bearish divergences, ensuring these critical reversal indicators are immediately recognizable and don't get confused with momentum-based signals. This multi-tiered signal hierarchy helps traders prioritize their analysis and avoid signal overload.
The information table in the top-right corner of the indicator pane provides real-time quantitative feedback on all major calculation components. It displays the current bar's buy volume and sell volume in millions with appropriate color coding, the imbalance percentage with color indicating whether it exceeds the threshold, the average intensity score showing whether closes are generally near highs or lows, the flow momentum value, and the current buy and sell scores. This table transforms the indicator from a purely graphical tool into a quantitative dashboard, allowing discretionary traders to incorporate specific numerical thresholds into their decision frameworks. For example, a trader might require that buy score exceed seventy percent and intensity exceed zero point six-five before taking a long position, creating objective entry criteria from subjective chart reading.
The background shading that occurs during very high volume periods provides an ambient alert system that doesn't require focused attention on the indicator pane. When volume spikes to one point five times the threshold and net flow EMA is positive, a very light green background appears across the entire indicator pane; when volume spikes with negative net flow, a light red background appears. These backgrounds create a subliminal awareness of exceptional market participation moments, ensuring traders notice when the market is making important decisions even if they're focused on price action or other indicators at that moment.
The alert system built into the indicator allows traders to receive notifications for strong buy signals, strong sell signals, bullish divergences, bearish divergences, and very high volume events. These alerts can be configured in TradingView to send push notifications to mobile devices, emails, or webhook calls to automated trading systems. This functionality transforms the indicator from a passive analysis tool into an active monitoring system that can watch markets continuously and notify the trader only when significant volume flow developments occur. For traders monitoring multiple instruments, this alert capability is invaluable for efficient time allocation, allowing them to analyze other opportunities while being instantly notified when this indicator identifies high-probability setups on their watch list.
The coding implementation demonstrates advanced Pine Script techniques including the use of request.security_lower_tf to access intrabar data, array manipulation to process variable-length intrabar arrays, proper variable scoping with var keyword for persistent state management across bars, and efficient conditional logic that prevents unnecessary calculations. The code structure with clearly delineated sections for inputs, calculations, signal generation, plotting, and alerts makes it maintainable and educational for those studying Pine Script development. The use of input groups with custom headers creates an organized settings panel that doesn't overwhelm users with dozens of ungrouped parameters, while still providing substantial customization capability for advanced users who want to optimize the indicator for specific instruments or timeframes.
For practical trading application, this indicator excels in several specific use cases. Scalpers and day traders can use the intrabar analysis to identify accumulation or distribution happening within the bars of their entry timeframe, providing early entry signals before momentum indicators or price patterns complete. Swing traders can use the cumulative delta and accumulation-distribution zones to understand whether short-term pullbacks in an uptrend are being bought or sold, helping distinguish between healthy retracements and trend reversals. Position traders can use the divergence detection to identify major turning points where price extremes are not supported by volume, providing low-risk entry points for counter-trend positions or warnings to exit with-trend positions before significant reversals.
The indicator is particularly valuable in ranging markets where price-based indicators produce numerous false breakout signals. By requiring that breakouts be accompanied by volume flow imbalances, the indicator filters out failed breakouts driven by low participation. When price breaks a range boundary accompanied by a strong buy or sell signal with high buy or sell score and very high volume, the probability of successful breakout follow-through increases dramatically. Conversely, when price breaks a range but the indicator shows low imbalance, opposing flow direction, or low volume, traders can fade the breakout or at minimum avoid chasing it.
During trending markets, the indicator helps traders identify the healthiest entry points by revealing where pullbacks are being accumulated by smart money. A trending market will show the cumulative delta continuing in the trend direction even as price pulls back, and accumulation zones will form during these pullbacks. When price resumes the trend, the indicator will generate strong buy or sell signals with high scores, providing objective entry points with clear invalidation levels. The flow momentum component helps traders stay with trends longer by distinguishing between healthy momentum pauses—where momentum goes to zero but doesn't reverse—and actual momentum reversals where opposing pressure is building.
The VWAP deviation weighting adds particular value for traders of liquid instruments like major forex pairs, stock indices, and high-volume stocks where VWAP is widely watched by institutional participants. When price deviates significantly from the intrabar VWAP and volume flows in the direction of that deviation with elevated weighting, it indicates that the move away from fair value is being driven by conviction rather than mechanical order flow. This suggests the deviation will likely extend further, creating continuation trading opportunities. Conversely, when price deviates from intrabar VWAP but volume flow shows reduced intensity or opposing direction despite the weighting, it suggests the deviation will revert to VWAP, creating mean reversion opportunities.
The ATR normalization option makes the indicator values comparable across different volatility regimes and different instruments. Without normalization, a one-million share buy-sell imbalance might be significant for a low-volatility stock but trivial for a high-volatility cryptocurrency. By normalizing the delta by ATR, the indicator accounts for the typical price movement capacity of the instrument, making signal thresholds and comparison values meaningful across different trading contexts. This is particularly valuable for traders running the indicator on multiple instruments who want consistent signal quality regardless of the underlying instrument characteristics.
The configurable decay factor allows traders to adjust how persistent they want volume flows to remain influential. For very short-term scalping, a lower decay factor like zero point five will cause volume imbalances to dissipate quickly, keeping the indicator focused only on very recent flows. For longer-term position trading, a higher decay factor like zero point nine-five will allow significant volume events to influence the indicator for many bars, revealing longer-term accumulation and distribution patterns. This flexibility makes the single indicator adaptable to trading styles ranging from one-minute scalping to daily chart position trading simply by adjusting the decay parameter and the lookback bars.
The minimum imbalance percentage setting provides crucial noise filtering that can be optimized per instrument. Highly liquid instruments with tight spreads might show numerous small imbalances that are meaningless, requiring a higher threshold like thirty-five or forty percent to filter noise effectively. Thinly traded instruments might rarely show extreme imbalances, requiring a lower threshold like fifteen or twenty percent to generate adequate signals. By making this threshold user-configurable with a wide range, the indicator accommodates the full spectrum of market microstructure characteristics across different instruments and timeframes.
In conclusion, the Intrabar Volume Flow Intelligence indicator represents a comprehensive volume analysis system that combines intrabar data access, sophisticated volume attribution algorithms, multi-timeframe smoothing, statistical filtering, divergence detection, zone identification, and intelligent signal scoring into a cohesive analytical framework. It provides traders with visibility into market dynamics that are invisible to price-only analysis and even to conventional volume analysis, revealing the true intentions of market participants through their actual transaction behavior within each bar. The indicator's strength lies not in any single feature but in the integration of multiple analytical layers that confirm and validate each other, creating high-probability signal generation that can form the foundation of complete trading systems or provide powerful confirmation for discretionary analysis. For traders willing to invest time in understanding its components and optimizing its parameters for their specific instruments and timeframes, this indicator offers a significant informational advantage in increasingly competitive markets where edge is derived from seeing what others miss and acting on that information before it becomes consensus.

Gold Smart Scalper V3 - Clean ChartOverview
The Gold Smart Scalper V3 is a trend-following momentum strategy specifically optimized for XAU/USD (Gold). It focuses on catching "value pullbacks" within a strong trend, avoiding the noise of sideways markets. Unlike many scalpers that use lagging indicators for exits, this version uses fixed ATR-based targets to lock in profits during high-volatility moves common in Gold.
Core Methodology
The strategy operates on three layers of confirmation:
Macro Trend (HTF Filter): Uses a 50-period EMA to ensure trades are only taken in the direction of the higher-timeframe momentum.
The Value Zone: Instead of "chasing" green or red candles, the script waits for a pullback to the space between the 9 EMA and 21 EMA. This ensures a better risk-to-reward entry point.
The Trigger: A trade is only executed when price confirms the resumption of the trend by crossing back over the signal EMA after the pullback.
Key Features
Fixed Profit Targets: Replaced dynamic trailing stops with fixed Take Profit (TP) and Stop Loss (SL) levels based on ATR, ensuring exits aren't "hunted" by Gold's signature volatility spikes.
C lean Chart Interface : All moving average plots are hidden. The only visuals provided are the active TP/SL levels when a trade is live, keeping your workspace clutter-free.
Single-Trade Logic: The script includes a "One Trade Per Cross" gate, preventing the strategy from over-trading or "stacking" positions during choppy price action.
Settings & OptimizationATR Multipliers :
Stop Loss (SL): Default $2.0 \times ATR$. Protects against standard market noise.Take Profit (TP): Default $3.0 \times ATR$. Designed for a high Risk/Reward profile.Timeframe Recommendation: Optimized for 15m and 1H for swing scalping, or 5m for aggressive scalping.Instrument: Specifically tuned for Gold (XAU/USD), but applicable to other high-volatility pairs like GBP/JPY or NASDAQ.
Disclaimer
This script is for educational and backtesting purposes only. Past performance does not guarantee future results. Always practice proper risk management.

Alphabet Long Trigger (Björn)Alphabet Trigger Dezember 2025:
Kurs 267–269 €
grüne Kerze mit höherem Tief
Volumen-Lebenszeichen
Nasdaq nicht im Abwärtsmodus
Alphabet Momentum Pullback Strategy — Brief Description
This strategy targets high-quality pullbacks within a confirmed uptrend and enters a long position only when price, structure, volume, and market context align.
A trade is triggered when:
Price enters the buy zone between €267–€269, signaling a controlled pullback.
The chart forms the first green candle with a higher low, indicating buyers are returning.
Volume shows a positive uptick (at least above the recent average), confirming real demand.
The Nasdaq is not falling, ensuring the broader tech market is stable and not in risk-off mode.
The strategy avoids entries triggered solely by price and waits for multi-factor confirmation, reducing false breakouts and momentum traps. It is designed for disciplined swing traders who prioritize trend alignment, volume confirmation, and market context before entering a position.

macd sma20
### MACD_sma20 – Multi-Timeframe MACD Pullback & SMA20 Dashboard
This script is a complete trading toolkit built around a **MACD pullback strategy** combined with **multi-timeframe SMA20 filters**, volume analysis, and a compact information panel.
It is designed for traders who like to:
* Trade **MACD pullbacks above the moving average**
* Track **key SMA20 levels across multiple timeframes** (Daily, 3-Day, Weekly, Monthly)
* Quickly see whether **current price is above or below those reference levels**
* Use **clean visual signals** for entries and exits, instead of staring at raw indicator values
---
### Core Features
#### 1. MACD Pullback Long Signal (Green Triangle Up)
The script detects a **bullish MACD pullback** pattern:
* MACD line is still **above** the signal line
* Both MACD line and histogram **pull back** for several bars
* Then MACD turns back up again, with price trading **above the local SMA20**
When this “pullback and re-acceleration” is confirmed, a **green triangle below the bar** is plotted as a **long entry signal**.
There is also an optional filter:
* **Weekly SMA20 filter**:
If enabled, long signals are only triggered when **current price is above the Weekly SMA20**, helping you stay on the right side of the higher-timeframe trend.
---
#### 2. Bearish Pullback Confirmation Signal (Red Triangle Down)
On the short side, the script detects a **bearish pullback confirmation** based on:
* A recent **high-volume bearish candle** (large down bar with volume above a multiple of the 20-period volume average)
* At least a minimum number of **negative MACD histogram bars**
* MACD line moving closer to the signal line (loss of momentum)
* Price recovering back up near the **top of that high-volume bearish candle**, then starting to fall again while MACD stays positive
When all conditions align, the script prints a **red triangle above the bar**, indicating a **bearish pullback confirmation** – often a good area to take profits on longs or consider short/hedge setups.
---
#### 3. Signal History Tracking
For both long and short signals, the script internally tracks the **most recent three signals**:
* Timestamp of the signal
* Price at the signal
* Short-term percentage change into the signal
This is mainly for internal use and future expansion, but already gives you a structured signal history if you want to extend or connect the logic later.
---
### Multi-Timeframe SMA20 Dashboard (Bottom-Right Panel)
One of the most useful parts of this script is the **compact dashboard table** in the **bottom-right corner** of the chart. It updates in real time and shows:
1. **Current Price**
2. **Daily SMA20** – value + whether price is above/below
3. **3-Day SMA20** – value + whether price is above/below
4. **Weekly SMA20** – value + whether price is above/below
5. **Monthly SMA20** – value + whether price is above/below
6. **RSI** (current timeframe)
For each timeframe’s SMA20:
* If **price ≥ SMA20**, the status cell is **green** with a ✓
* If **price < SMA20**, the status cell is **red** with a ✗
This gives you, at a glance:
* Is the market in a **short-term uptrend or downtrend** (Daily SMA20)?
* Is the **swing / position trend** healthy (3D & Weekly SMA20)?
* Is the broader **macro structure** supportive (Monthly SMA20)?
You don’t need to manually switch timeframes or add multiple moving averages – the script does all of that for you automatically using `request.security`.
---
### Alerts
The script comes with two built-in alert conditions:
* **MACD回踩转多信号 (MACD pullback bullish signal)**
* **空头回抽确认信号 (Bearish pullback confirmation signal)**
You can attach TradingView alerts to these conditions to get notified whenever a new long or bearish-confirmation setup appears, even when you’re not watching the chart.
---
### How to Use It in Your Trading
1. **Choose your main trading timeframe**
* For intraday swing: 15m / 1h / 4h
* For swing / position: 4h / Daily
2. **Watch the bottom-right SMA20 panel**
* If most higher-timeframe SMA20 rows are **green**, you are trading **with the larger trend**.
* If they are **mixed or mostly red**, you’re either counter-trend or in a choppy transition zone.
3. **Use the green MACD pullback signals**
* Prefer long setups when:
* The **Weekly and Monthly SMA20 rows are green**, and
* The signal appears **above the Daily SMA20**
* This stacks multiple edges: trend + pullback + momentum re-acceleration.
4. **Use the red bearish confirmation signals for risk management**
* Take partial profits on longs when a red signal appears near resistance.
* Consider hedge/short opportunities if higher-timeframe SMA20 rows are already red or turning red.
5. **Use RSI as a context indicator**
* Combine with overbought/oversold zones or your own RSI thresholds for additional confirmation.
---
### Why This Script Is Useful
* **Trend awareness across timeframes**:
You always know where current price sits relative to the Daily / 3-Day / Weekly / Monthly SMA20 – without switching charts.
* **Clear, rule-based signals**:
The MACD logic is explicit and systematic, focused on **pullbacks within trends** rather than random crossovers.
* **Volume-aware bearish logic**:
High-volume bearish candles often mark important supply zones. The script builds this idea directly into the short-side confirmation logic.
* **Visual and intuitive**:
Green/Red triangles + Green/Red table cells make it easy to interpret even if you are not a heavy indicator user.
* **Flexible**:
All key parameters (MACD lengths, SMA length, volume threshold, lookback period, RSI length, weekly filter) are customizable, so you can adapt it to different markets (crypto, stocks, FX) and timeframes.
---
In short, this script is a **multi-timeframe MACD pullback system with an integrated SMA20 dashboard**, suitable for swing traders and position traders who want a structured, visually clean way to align entries with trend and momentum while keeping an eye on higher-timeframe levels.

Continuation Suite v1 — 5m/15mContinuation Suite v1 — 5m/15m (Non-Repainting, S/R + Trend Continuation)
What it does
Continuation Suite v1 is a practical intraday toolkit that combines non-repainting trend-continuation signals with auto-built Support/Resistance (S/R) from confirmed pivots. It’s designed for fast, liquid names on 5m charts with an optional 15m higher-timeframe (HTF) overlay. You get: stacked-EMA bias, disciplined pullback+reclaim entries, optional volume/volatility gates, a “Strong” signal tier, solid S/R lines or zones, and a compact dashboard for fast reads.
⸻
Why traders use it
• Clear bias using fast/mid/slow EMA stacking.
• Actionable entries that require a pullback, a reclaim, and (optionally) a minor break of prior extremes.
• Signal quality gates (volume vs SMA, ATR%, ADX/DI alignment, EMA spacing, slope).
• Non-repainting logic when “Confirm on Close” = ON. Intrabar previews show what’s forming, but confirmed signals only print on bar close.
• S/R that matters: confirmed-pivot lines or ATR-sized zones, optional HTF overlay, and auto de-dup to avoid clutter.
⸻
Signal construction (no magic, just rules)
Bullish continuation (base):
1. Trend: EMA fast > EMA mid > EMA slow
2. Pullback: price pulls into the stack (lowest low or close vs EMA fast/mid over a lookback)
3. Reclaim: close > EMA fast and close > open
4. Break filter (optional): current bar takes out the prior bar’s high
5. Filters: volume > SMA (if enabled) and ATR% ≤ max (if enabled)
6. Cooldown: a minimum bar gap between signals
Bearish continuation (base): mirror of the above.
Strong signals: base conditions plus ADX ≥ threshold, DI alignment (DI+>DI- for longs; DI->DI+ for shorts), minimum EMA-spacing %, and minimum fast-EMA slope.
Reference stops:
• Longs: lowest low over the pullback lookback
• Shorts: highest high over the pullback lookback
Alerts are included for: Bullish Continuation, Bearish Continuation, STRONG Bullish, STRONG Bearish.
⸻
S/R engine (current TF + optional HTF)
• Builds S/R from confirmed pivots only (left/right bars).
• Choose Lines (midlines) or Zones (ATR-sized).
• Zones merge when a new pivot lands near an existing zone’s mid (ATR-scaled epsilon).
• Touches counter tracks significance; you can require a minimum to draw.
• HTF overlay (default 15m) draws separate lines/zones with tiny TF tags on the right.
• De-dup option hides current-TF zones that sit too close to HTF zones (ATR-scaled), reducing overlap.
• Freeze on Close (optional) keeps arrays stable intrabar; snapshots show levels immediately as bars open.
⸻
Presets
• Auto: Detects QQQ-like tickers (QQQ, QLD, QID) or SoFi; else defaults to Custom.
• QQQ: Tighter ATR% and EMA settings geared to index-ETF behavior.
• SoFi: Wider ATR allowances and longer mid/slow for single-name behavior.
• Custom: Expose all key inputs to tune for your product.
⸻
Dashboard (top-right)
• Preset in use
• Bias (Bullish CONT / Bearish CONT / Neutral)
• Strong (Yes/No)
• Volatility (ATR% bucket)
• Trend (ADX bucket)
• HTF timeframe tag
• Volume (bucket or “off”)
• Signals mode (Close-Confirmed vs Intrabar)
⸻
Inputs you’ll actually adjust
Trend/Signals
• Fast/Mid/Slow EMA lengths
• Pullback lookback, Min bars between signals
• Volume filter (vol > SMA N)
• ATR% max filter (cap excessive volatility)
• Require break of prior bar’s high/low
• “Strong” gates: min EMA slope, min EMA spacing %, ADX length & threshold
Support/Resistance
• Lines vs Zones
• Pivot left/right bars
• Extend left/right (bars)
• Max pivots kept (current & HTF)
• Zone width (× ATR), Merge epsilon (× ATR), Min gap (× ATR)
• Min touches, Max zones per side near price
• De-dup current TF vs HTF (× ATR)
Repainting control
• Confirm on Close: when ON, signals/SR finalize on bar close (non-repainting)
• Freeze on Close: freeze S/R intrabar with snapshot updates
• Show previews: translucent intrabar labels for what’s forming
⸻
How to use it (straightforward)
1. Load on 5-minute chart (baseline). Keep Confirm on Close ON if you hate repainting.
2. Use Bias + Strong + S/R context. If a long prints into HTF resistance, you have information.
3. Manage risk off the reference stop (pullback extreme). If ATR% reads “Great,” widen expectations; if “Poor,” size down or pass.
4. Alerts: wire the four alert types to your workflow.
⸻
Notes and constraints
• Designed for liquid symbols. Thin books and synthetic “volume” will degrade the volume gate.
• S/R is pivot-based. On very choppy tape, touch counts help. Increase min touches or switch to Lines to declutter.
• If your chart timeframe isn’t 5m, behavior changes because lengths are in bars, not minutes. Tune lengths accordingly.
⸻
Disclaimers
This is a research tool. No signals are guaranteed. Markets change, outliers happen, slippage is real. Nothing here is financial advice—use your own judgment and risk management.
⸻
Author: DaddyScruff
License: MPL-2.0 (Mozilla Public License 2.0)
