RSI+CMO Hybrid StrategyThis strategy is based on the RSI+CMO Hybrid Index I created. I modified both the original RSI and CMO so that the RSI+CMO Index value ranges from -100 to +100 and defined as follows. When the RSI+CMO Hybrid Index values close above the Bull Level and below the Bear Level, the strategy will trigger long and short signals respectively. This newly defined hybrid RSI+CMO indicator showed better win rates and better profits than the original CMO strategy. The default setting for this strategy is optimized for an 8-hour candle. For candles at different times, try to find the optimal value yourself.
* I was going to open the script, but recently there was a case of stealing my script and publishing it without permission, so I decided not to disclose it.
▶ Modified RSI = Original RSI - 50
Therefore,
Original RSI (0 ~ 100) → Modified RSI (-50 ~ +50)
▶ Modified CMO = Original CMO * 0.5
Therefore,
Original CMO (-100 ~ +100) → Modified CMO (-50 ~ +50)
▶ RSI+CMO Hybrid Index = Modified RSI + Modified CMO
Therefore,
RSI+CMO Hybrid Index (-100 ~ +100)
________________________________________________________
이 전략은 기존의 RSI와 CMO 지표를 수정하여 새롭게 정의한 하이브리드 RSI+CMO 지표를 기반으로 만들어졌습니다. 지표 값의 범위가 -100에서 100의 범위를 가질 수 있도록 기존의 RSI와 CMO를 수정하여 만들었습니다. RSI+CMO Hybrid Index 값이 Bull Level 이상과 Bear Level 아래에서 봉마감을 하면 이 전략은 각각 롱과 숏 신호를 트리거합니다. 이렇게 새롭게 정의된 RSI+CMO 지표는 기존 CMO 전략 대비 승률과 수익이 더 우수합니다. 이 전략의 세팅 기본값은 8시간봉에 최적화 되어있습니다. 다른 시간대 봉에서는 최적값을 직접 찾아보십시오. 그리고 이전략은 RSI+CMO Hybrid Index와 함께 사용하면 Long과 Short 신호를 예측할 수 있어 편리합니다.
* 최근에 제 스크립트를 도용/표절하여 무단으로 퍼블리쉬한 사례가 발생하여 더 이상 스크립트는 공개하지 않기로 하였습니다.
Tìm kiếm tập lệnh với "range"

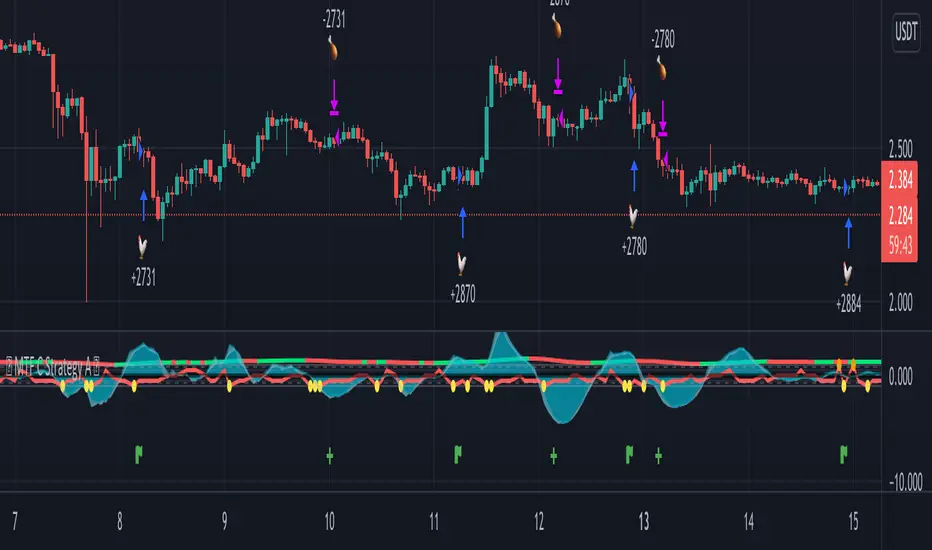
MTF C Strategy A
The Pearson coefficient is a type of correlation coefficient that represents the relationship between two variables that are measured on the same interval or ratio scale. It's a measure of the strength of the association between two continuous variables.
This script allows you to choose one or more sources as a curve, if several sources are chosen, their average is taken into account in an EMA or SMA of your choice. It is possible to have the average of all the curves and to add one or more other curves for an influence on the calculated average.
Then, on the basis of this curve a correlation is calculated from 8 time ranges which give 4 curves, it is on this basis that the conditions of entries in the trade and / or exits are based with the possibility of adding an RSI condition.
For some entries, it is possible to try the symmetrically opposite condition, ie the one that is used in shorts.
To make entry short work, you must activate an exit short option.
However, exit conditions are more flexible than entry conditions because they allow the inverse entry condition used and / or to use statistical indices such as CCI / RSI / ROC / BB as exit condition independently or combined way.
It should be noted that if a condition among those chosen is executed substantially first, it will predominate over the others (same for long / short entries).
In addition, it is possible to choose a stop loss as an exit condition, however, it is not possible to combine the other exit conditions with the stoploss at the same time. Credits to adolgov for the base of the stoploss script part.
You can combine several curves, just as it is possible to combine several types of trade entries / exits.
The strategy uses 100% of equity, it has not been configured in such a way that there is an order pyramid and the closings are done on a total equity basis.
You can configure a daily session interval, a limit of the number of daily trades, a limit of drawdown.
You can add comments for each execution of an opening / closing order respectively to the direction (long or short).
Each step of the configuration has a tip, a button that must be hovered over in order to have the information relating to the configuration.
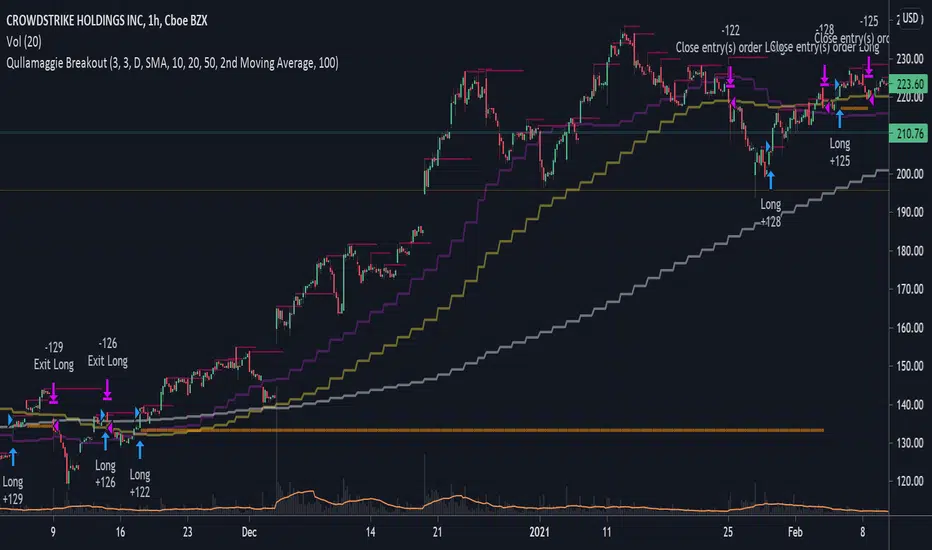
Qullamaggie BreakoutThe intent of this strategy is to buy breakouts with a tight stop on smaller timeframes in the direction of the longer term trend. Default longer term trend is the daily, but the user can choose any timeframe to use for the SMAs (which act as filters and trailing stops).
Exit the trade using a trailing stop of a close below either the 10 MA or 20 MA (user choice) on that larger timeframe as the position moves in your favor (i.e. whenever position price rises above the MA). This is one area where this script could use a little work or some human intervention - when the trade is entered right in the vicinity of the moving averages, you get some whipsaw. Not sure how to avoid that at this point though if you want to look at those longer term moving averages as your exit criteria.
Option of using daily ATR as a measure of finding contracting ranges and ensuring a decent risk/reward. (If the difference between the breakout point and your stop level is below a certain % of ATR, it could possibly find those consolidating periods.)
Heatmap - Multi-Timeframe Indicators - StrategyHeatmap - Multi-Timeframe Indicators - Strategy
▪ Main features :
- 19 Timeframes: 1m, 3m, 5m, 10m, 15m, 30m, 45m, 1h, 2h, 3h, 4h, 5h, 6h, 8h, 10h, 12h, 1D, 1W, 1M
- 6 indicators per timeframe
- choose specific timeframes for indicators (example - 1 hour)
- or choose specific timeframe ranges (example - 1 hour to 1 month)
The general idea is that the higher timeframe signals are stronger than the lower timeframe ones.
When a trend is starting, it is first visible on the lower timeframes.
The more time passes, the more the trend propagates through higher timeframes.
The default settings are meant to show all the available features. You may fine-tune it to your specific needs.
How to choose the timeframe for the chart : use the lowest of the choosen timeframes for indicators.
If the heatmap doesn't display correctly on your device, you may check the Heatmap Theme 🎨 setting.
It doesn't repaint.
"Repaint" version available though - good to check the past history, but very bad for real-time analysis.
▪ Indicators used for trend detection
1. MACD Cross
2. Stochastic Cross
3. Stochastic Cross and Overbought or Oversold
4. Moving Average
5. Parabolic SAR
6. Heikin Ashi
▪ Find the best Heatmap settings with the Strategy Tester version.
The signals generated by the Heatmap are considered to be valid at the bar open .
The Strategy Tester, however, uses the bar close in its calculations.
Therefore, the results may seem to be worse than they can be.
The Profitability, Profit Factor and other stats should be taken into consideration relatively to other configurations of the same Heatmap.
▪ Using a score system to consider a change in trend valid.
Example: consider the signal valid if 65% or more of all indicators (max 6) among all timeframes (max 19) hint at a change in trend.
The % percent value can be inserted in settings.
When using the default settings or when all timeframes and indicators are activated,
the ratio of 100% downtrend or 100% uptrend may be less occuring. Adjust accordingly.
The signals across timeframes and indicators are aggregated to show simple entry and exit signals.
▪ Combined Alerts, to be set to fire once per bar open :
0 - 📈 Long! - Heatmap - Multi-TFI
0 - 📈 Short! - Heatmap - Multi-TFI
0 - 📈 Long Exit! - Heatmap - Multi-TFI
0 - 📈 Short Exit! - Heatmap - Multi-TFI
1 *** BUY or SELL (single alert) ***
1 *** Entries or Exits (single alert) ***
▪ Note : The initial load may be slow. If something doesn't seem to work, you can try the following:
- wait more time for it to load
- hide & show or remove & add back to chart
- don't add the indicator to chart multiple times in a short amount of time, as you may be rate limited
▪ Related Studies :
- Heatmap - Multi-Timeframe Indicators - Alerts
- Risk Management System (Stop Loss, Take Profit, Trailing Stop Loss, Trailing Take Profit) - it can be connected to Heatmap - Multi-Timeframe Indicators - Alerts
▪ Layout example:

NYCOB Kill Zone StrategyI have now turned the NYCOB Kill zone into a stand alone strategy!
Fully customizable in regards to time of entry and levels of entry but the standard settings are the best all around.
Original NYCOB Kill Zone text below
This script plots the H and L of the first 2 hours of the NYC session and shades the space between in which i deem the NYC Order Block
It also maps out the First two hours on the chart as well so you can understand when the OB has formed
Over the past 3 years of trading cryptocurrency i have noticed a phenomena that has occurred nearly every day
The H or L will 90% of the time will be posted in the first two hours of this session
knowing this means you understand if you just wait til this time you can better your odds at not getting stop hunted due to poor entry
A few things to take from this study are these.
1. after the OB is formed
2. whichever side gets taken out first (H/L) will 90% define the bias for the day. I have found that using the m13-m15 TF will add some more confirmation with 1-2 closes outside of range H/L/
3. After general bias has formed 2 things can happen
A) PA just takes off and there is really nothing you can do about it unless you had other studies that told you that will happen
B) PA will dip back INTO the OB and create the OTE which is any retracement below the .5 Fibonacci of the shaded OB
4. Typically OTE happens after the session has ended
5. If you used OTE off of the past days NYCOB then you can use the new (forming or just formed) NYCOB to CONFIRM your initial bias presented from the previous days OTE and bias.
6. When PA cannot close outside the NYCOB it presents a range to range play where PA will visit the opposite side of the range to chase liquidity,
7. When the NYCOB is TIGHT then deviation is more likely to result in price expansion, when the NYCOB is WIDE then deviation tends to present more range to range plays.
8. After bias is formed and OTE has been made your stops should always be outside the NYCOB. I use the m30 or H1 ATR to get a slight cushion from the OB to ensure i dont get stop hunted.
Standard TP are all set at the same level but you can adjust them accordingly
Shout out to Elevate-Trading family member Boederzeng for helping me with the code!

Williams Alligator + RSI + T3CCIWilliams Alligator strategy is based on indicator developed by a legendary trader Bill Williams, an early pioneer of market psychology.
The strategy is based on a trend-following Alligator indicator, which follows the premise that financial markets and individual securities trend just 15% to 30% of the time while grinding through sideways ranges the other 70% to 85% of the time. Williams believed that individuals and institutions tend to collect most of their profits during strongly trending periods.
Although Alligator is a very strong tool it has a lot of weak signals and has lag span on entries and exits. We added RSI oscillator and T3CCI to clear market noises and weak signals. Moreover the approach we intoduced to the indicator allows to enter positions and close them earlier than orginal indicator which ensures stronger signals
The strategy supports traditional and cryptocurrency spot, futures, options and marginal trading exchanges. It works accurately with BTC, USD, USDT, ETH and BNB quote currencies. Best to use with 1D timeframe charts
The strategy can be and should be configured for each particular asset. You can change filters and risk management settings to receive the most advanced accurate alerts
Advantages of this script:
Good for long and Short positions
Produces strong long-term entries and closures of positions
Stable to short-term market fluctutions
Easy configuration with a user friendly interface
Backtests show high accuracy around 85.71%
High Net Profit percentage around 21.26%
High profit factor around 82.403
How to use?
1. Apply strategy to the trading pair your are interested in at 1D timeframe chart
2. Configure the strategy: change filters values and risk management settings until Strategy tester shows good results according to mathematical expectation
3. Set up a TradingView alert to trigger when strategy conditions are met
4. Strategy will send alerts when to enter and when to exit positions
Feel free to copy and use this script for your ideas and trading!

Ultimate Strategy TemplateHello Traders
As most of you know, I'm a member of the PineCoders community and I sometimes take freelance pine coding jobs for TradingView users.
Off the top of my head, users often want to:
- convert an indicator into a strategy, so as to get the backtesting statistics from TradingView
- add alerts to their indicator/strategy
- develop a generic strategy template which can be plugged into (almost) any indicator
My gift for the community today is my Ultimate Strategy Template
Step 1: Create your connector
Adapt your indicator with only 2 lines of code and then connect it to this strategy template.
For doing so:
1) Find in your indicator where are the conditions printing the long/buy and short/sell signals.
2) Create an additional plot as below
I'm giving an example with a Two moving averages cross.
Please replicate the same methodology for your indicator wether it's a MACD, ZigZag, Pivots, higher-highs, lower-lows or whatever indicator with clear buy and sell conditions
//@version=4
study(title='Moving Average Cross', shorttitle='Moving Average Cross', overlay=true, precision=6, max_labels_count=500, max_lines_count=500)
type_ma1 = input(title="MA1 type", defval="SMA", options= )
length_ma1 = input(10, title = " MA1 length", type=input.integer)
type_ma2 = input(title="MA2 type", defval="SMA", options= )
length_ma2 = input(100, title = " MA2 length", type=input.integer)
// MA
f_ma(smoothing, src, length) =>
iff(smoothing == "RMA", rma(src, length),
iff(smoothing == "SMA", sma(src, length),
iff(smoothing == "EMA", ema(src, length), src)))
MA1 = f_ma(type_ma1, close, length_ma1)
MA2 = f_ma(type_ma2, close, length_ma2)
// buy and sell conditions
buy = crossover(MA1, MA2)
sell = crossunder(MA1, MA2)
plot(MA1, color=color_ma1, title="Plot MA1", linewidth=3)
plot(MA2, color=color_ma2, title="Plot MA2", linewidth=3)
plotshape(buy, title='LONG SIGNAL', style=shape.circle, location=location.belowbar, color=color_ma1, size=size.normal)
plotshape(sell, title='SHORT SIGNAL', style=shape.circle, location=location.abovebar, color=color_ma2, size=size.normal)
/////////////////////////// SIGNAL FOR STRATEGY /////////////////////////
Signal = buy ? 1 : sell ? -1 : 0
plot(Signal, title="🔌Connector🔌", transp=100)
Basically, I identified my buy, sell conditions in the code and added this at the bottom of my indicator code
Signal = buy ? 1 : sell ? -1 : 0
plot(Signal, title="🔌Connector🔌", transp=100)
Important Notes
🔥 The Strategy Template expects the value to be exactly 1 for the bullish signal , and -1 for the bearish signal
Now you can connect your indicator to the Strategy Template using the method below or that one
Step 2: Connect the connector
1) Add your updated indicator to a TradingView chart
2) Add the Strategy Template as well to the SAME chart
3) Open the Strategy Template settings and in the Data Source field select your 🔌Connector🔌 (which comes from your indicator)
From then, you should start seeing the signals and plenty of other stuff on your chart
🔥 Note that whenever you'll update your indicator values, the strategy statistics and visual on your chart will update in real-time
Settings
- Color Candles : Color the candles based on the trade state (bullish, bearish, neutral)
- Close positions at market at the end of each session : useful for everything but cryptocurrencies
- Session time ranges : Take the signals from a starting time to an ending time
- Close Direction : Choose to close only the longs, shorts, or both
- Date Filter : Take the signals from a starting date to an ending date
- Set the maximum losing streak length with an input
- Set the maximum winning streak length with an input
- Set the maximum consecutive days with a loss
- Set the maximum drawdown (in % of strategy equity)
- Set the maximum intraday loss in percentage
- Limit the number of trades per day
- Limit the number of trades per week
- Stop-loss: None or Percentage or Trailing Stop Percentage or ATR
- Take-Profit: None or Percentage or ATR
- Risk-Reward based on ATR multiple for the Stop-Loss and Take-Profit
This script is open-source so feel free to use it, and optimize it as you want
Alerts
Maybe you didn't know it but alerts are available on strategy scripts.
I added them in this template - that's cool because:
- if you don't know how to code, now you can connect your indicator and get alerts
- you have now a cool template showing you how to create alerts for strategy scripts
Source: www.tradingview.com
I hope you'll like it, use it, optimize it and most importantly....make some optimizations to your indicators thanks to this Strategy template
Special Thanks
Special thanks to @JosKodify as I borrowed a few risk management snippets from his website: kodify.net
Additional features
I thought of plenty of extra filters that I'll add later on this week on this strategy template
Best
Dave

Retail Slayer StrategyRetail Slayer Strategy
Intended Markets: Forex, Indices, Cryptocurrencies, and metals (Gold, Silver)
Timeframe Use: 15 minutes only
Trailing Stop: 35-pips for Forex
The purpose of this strategy is to answer the question many retail traders have: Why does it feel like trades go against me immediately after placing a buy/sell? This strategy puts you into the position of taking trades against the majority of retail traders.
The underlying logic of this strategy involves the use of specific momentum, volatility, intra-week, and intra-day data to determine whether certain extremes that exist in common retail oscillators are truly indicative of a corrective move or a trend reversal. This strategy checks against those conditions to monitor whether certain breaks of certain price ranges are truly honest, or just fake-outs.
The 35-pip trail is intended for all of the Intended Markets listed above (ticks/points where necessary), and the 15-minute chart is also intended for all of the above-Intended Markets. There are options for you to adjust the trailing-stop, profit target, and stop(s) to fine-tune an instrument to your desired settings. However, I would recommend you stick with the 15-min, 35-pip default settings until you are more familiar with how this strategy works.
To utilize this strategy as an alert, simply add it to your chart then click on the Strategy Tester below. You will see a small alarm clock icon next to the cog-wheel - click the Alarm Icon and you can create the alert utilizing this strategy.
You will receive a notification warning you that this strategy can cause issues with repainting, and that is a known issue. However, with any strategy, it pays to confirm and do your own due diligence before committing to any trade. This strategy is intended to help identify and confirm entries in conjunction with your own analysis.
To inquire about access, please send me a PM. Please reach out if you have any questions.

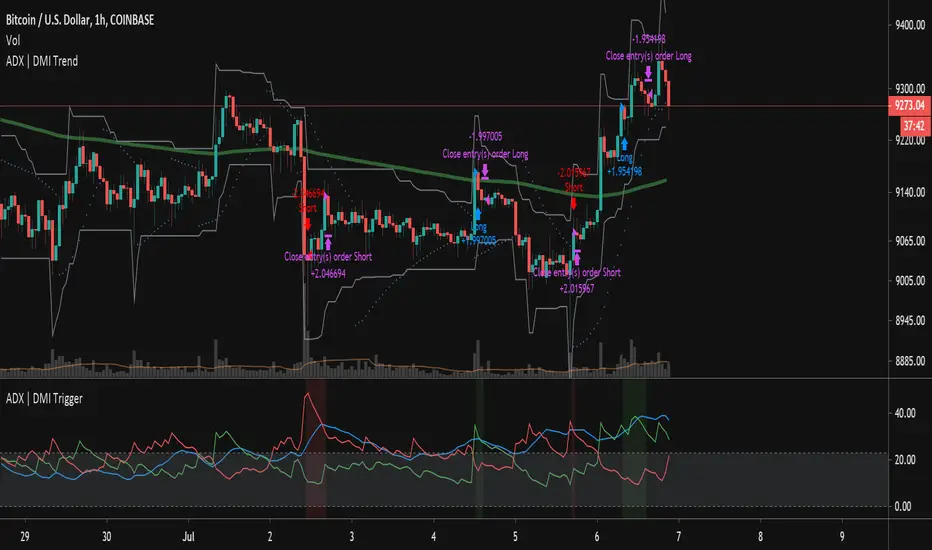
ADX | DMI Trend StrategyThis strategy takes the ADX Indicator I wrote and applies it to a strategy for back testing purposes.
I've also applied a date filter so you can back test specific date ranges and a moving average filter so you can choose whether to filter your longs/shorts based on a moving average.
tercanomics' pure alphaWithout considering trends, it’s a strategy which takes either long or short positions based on the volatility changes that happen on price actions.
Instead of being flat, the strategy tries to stay within the price ranges / trends and it keeps trying as long as it predicts that buyers and sellers keep making profit.
The “Take Profit” and “Close” conditions have not been added to the active version and the strategy does not have a static stop point.
Initial version has 63.64% success rate for 1-hour time frame in between the dates 01/01/2019 and 12/04/2020 for BitMEX: XBTUSD. Beside of the 5.894 Profit Factor, >1 Sharpe Ratio and 11.39% Max Drawdown, it has made 1156.82% Net Profit.
The backtest equations have been calculated with an assumption of the use of 100% of the equity and depending on the chosen exchange to trade, there will be market fee (commission) needed.
PM us to obtain access.

[astropark] Super RSI [strategy]Dear Followers,
today a new Scalper Tool , which works great on 3 minutes and 5 minutes timeframes , but also down to 1m and up to 30m!
I called it " Super RSI ", as it is based on RSI and inherits some basic functionality from it.
If you check its settings, you will see that you can have 3 different buy-sell sources (first two are active by default):
STRONG BUY/SELL : buy when white area deeply falls into oversold-red zone and sell when white area gets into overbought-green zone (you can set and edit at which level oversold and overbought zones start);
CROSSES : buy when the black RSI line in the middle between red and green area cross under the buy cross limit value and sell when it crosso over the sell cross limit value (you can set and edit specific cross ranges for both buy and sell);
WEAK BUY/SELL : buy when green area at least go below 50 level and sell when red area at least goes above 50 level (you can edit both levels); these conditions are highlighted as background color and are very useful for taking (at least partial) profits in trades.
By default the script will be placed as oscillator on a specific pane below the chart, but
> you can disable the oscillator plot by enabling the "hide all plot" option
> and place it as overlay on chart by clicking on the black arrow at then end on the indicator name in chart and selecting "move to -> existing pane above"
This strategy can trigger till 10 buy or 10 sell signals in a row before reverting, so use a proper money management .
Strategy results are calculated on 20 trading days using 1000$ as initial capital and working at 10x leverage.
The user who wants to use this strategy, especially via an automated bot, must always set a stoploss at 3-5% from entry point or use a proper risk management strategy .
This is not the "Holy Grail", so use it with caution.
This script will let you backtest the strategy and find best settings for your preferred market.
The alarms script version of this indicator, which will let you set all notifications you may need in order to be alerted on each triggered signals, can be found by searching for " Super RSI".
This is a premium indicator , so send me a private message in order to get access to this script .

[astropark] Super Stochastic RSI [strategy]Dear Followers,
today a new Scalper Tool , which works great on 3 minutes and 5 minutes timeframes !
I called it " Super Stochastic RSI ", as it is based on StochRSI and inherits some basic functionality from it.
If you check its settings, you will see that you can have 3 different buy-sell sources (first two are active by default):
STRONG BUY/SELL : buy when green area deeply falls into oversold zone and sell when red area gets into overbought zone (you can set and edit at which level oversold and overbought zones start);
K/D CROSSES : buy when k-line cross above d-line and sell viceversa (you can set and edit specific cross ranges for both buy and sell);
WEAK BUY/SELL : buy when green area at least go below 50 level and sell when red area at least goes above 50 level (you can edit both levels); these conditions are highlighted as background color and are very useful for taking (at least partial) profits in trades.
By default the script will be placed as oscillator on a specific pane below the chart, but
> you can disable the oscillator plot by enabling the "hide all plot" option
> and place it as overlay on chart by clicking on the black arrow at then end on the indicator name in chart and selecting "move to -> existing pane above"
This strategy can trigger till 10 buy or 10 sell signals in a row before reverting, so use a proper money management .
Strategy results are calculated on 20 trading days using 1000$ as initial capital and working at 10x leverage.
The user who wants to use this strategy, especially via an automated bot, must always set a stoploss at 3-5% from entry point or use a proper risk management strategy .
This is not the "Holy Grail", so use it with caution.
This script will let you backtest the strategy and find best settings for your preferred market.
The alarms script version of this indicator, which will let you set all notifications you may need in order to be alerted on each triggered signals, can be found here below:
This is a premium indicator , so send me a private message in order to get access to this script .

RePaNoCHa [Backtest]This is a very long script and adjusting the settings can be a bit slow so I share some settings. (these may be even better)
It has no security() and no Heikin Ashi so no repaint and Backtest is real.
It's important to adjust correctly the tics/pips correction.
All timeframes but good results at 2H
Default settings for ETHUSD (BITMEX) 2H
Alerts version coming soon...
Enjoy!!!
"Este script es la repanocha"
XBTUSD (BITMEX)
Timeframe = 2H
Position Side = BOTH
Source = hlc3
T3 == true
T3 Length = 8
T3 Volume Factor = 0.9
Range Filter+ADX == true
Sampling Period = 16
Range Multiplier = 1.3
Flat Market Trades == true
ADX lenght = 10
ADX Threshold = 20
Parabolic SAR == true
SAR start = 0.03
SAR inc = 0.02
SAR max = 0.3
Pyramiding = 15
Trailing Stop Activation % = 0.5
Trailing Stop Offset % (when profit=0.5 %) = 0.2
Trailing Stop Offset % (when profit=10 %) = 1.2
Stop Loss = 3.2
Tics/Pips Correction = 10
Initial Capital = 1000
Quantity = 100 %
Commission value = 0.075 %
ETHUSD (BITMEX)
Timeframe = 2H
Position Side = BOTH
Source = hlc3
T3 == true
T3 Length = 6
T3 Volume Factor = 0.7
Range Filter+ADX == true
Sampling Period = 10
Range Multiplier = 0.9
Flat Market Trades == true
ADX lenght = 11
ADX Threshold = 19
Parabolic SAR == true
SAR start = 0.06
SAR inc = 0.07
SAR max = 0.15
Pyramiding = 15
Trailing Stop Activation % = 0.5
Trailing Stop Offset % (when profit=0.5 %) = 0.25
Trailing Stop Offset % (when profit=10 %) = 1.5
Stop Loss = 3.2
Tics/Pips Correction = 100
Initial Capital = 1000
Quantity = 100 %
Commission value = 0.075 %
BNBUSDT (BINANCE)
Timeframe = 2H
Position Side = LONG
Source = hlc3
T3 == true
T3 Length = 6
T3 Volume Factor = 0.7
Range Filter+ADX == true
Sampling Period = 17
Range Multiplier = 1.3
Flat Market Trades == true
ADX lenght = 5
ADX Threshold = 18
Parabolic SAR == true
SAR start = 0.04
SAR inc = 0.03
SAR max = 0.25
Pyramiding = 15
Trailing Stop Activation % = 0.5
Trailing Stop Offset % (when profit=0.5 %) = 0.25
Trailing Stop Offset % (when profit=10 %) = 1.5
Stop Loss == false
Tics/Pips Correction = 10000
Initial Capital = 1000
Quantity = 100 %
Commission value = 0.075 %
LTCUSDT (BINANCE)
Timeframe = 2H
Position Side = LONG
Source = hlc3
T3 == true
T3 Length = 3
T3 Volume Factor = 1
Range Filter+ADX == true
Sampling Period = 11
Range Multiplier = 1.1
Flat Market Trades == true
ADX lenght = 6
ADX Threshold = 22
Parabolic SAR == true
SAR start = 0.07
SAR inc = 0.04
SAR max = 0.15
Pyramiding = 15
Trailing Stop Activation % = 0.5
Trailing Stop Offset % (when profit=0.5 %) = 0.25
Trailing Stop Offset % (when profit=10 %) = 1.5
Stop Loss == false
Tics/Pips Correction = 100
Initial Capital = 1000
Quantity = 100 %
Commission value = 0.075 %
TRXUSDT (BINANCE)
Timeframe = 2H
Position Side = LONG
Source = hlc3
T3 == true
T3 Length = 7
T3 Volume Factor = 1
Range Filter+ADX == true
Sampling Period = 8
Range Multiplier = 1.1
Flat Market Trades == true
ADX lenght = 4
ADX Threshold = 22
Parabolic SAR == true
SAR start = 0.07
SAR inc = 0.04
SAR max = 0.15
Pyramiding = 15
Trailing Stop Activation % = 0.5
Trailing Stop Offset % (when profit=0.5 %) = 0.25
Trailing Stop Offset % (when profit=10 %) = 1.5
Stop Loss == false
Tics/Pips Correction = 100000
Initial Capital = 1000
Quantity = 100 %
Commission value = 0.075 %
NAS100 (OANDA)
Timeframe = 2H
Position Side = BOTH
Source = hlc3
T3 == true
T3 Length = 3
T3 Volume Factor = 1
Range Filter+ADX == true
Sampling Period = 12
Range Multiplier = 1.3
Flat Market Trades == true
ADX lenght = 18
ADX Threshold = 21
Parabolic SAR == true
SAR start = 0.08
SAR inc = 0.06
SAR max = 0.25
Pyramiding = 15
Trailing Stop Activation % = 0.2
Trailing Stop Offset % (when profit=0.5 %) = 0.15
Trailing Stop Offset % (when profit=10 %) = 1
Stop Loss == false
Tics/Pips Correction = 10
Initial Capital = 1000
Quantity = 3 contracts
Commission value = 0.2 USD per contract
NATGAS(OANDA)
Timeframe = 2H
Position Side = BOTH
Source = hlc3
T3 == true
T3 Length = 3
T3 Volume Factor = 1
Range Filter+ADX == true
Sampling Period = 15
Range Multiplier = 1.3
Flat Market Trades == true
ADX lenght = 12
ADX Threshold = 21
Parabolic SAR == true
SAR start = 0.08
SAR inc = 0.06
SAR max = 0.4
Pyramiding = 15
Trailing Stop Activation % = 0.2
Trailing Stop Offset % (when profit=0.5 %) = 0.15
Trailing Stop Offset % (when profit=10 %) = 1
Stop Loss == false
Tics/Pips Correction = 1000
Initial Capital = 1000
Quantity = 4500 contracts
Commission value = 0.002 USD per contract
SPX500 (OANDA)
Timeframe = 2H
Position Side = BOTH
Source = hlc3
T3 == true
T3 Length = 4
T3 Volume Factor = 0.8
Range Filter+ADX == true
Sampling Period = 14
Range Multiplier = 1.3
Flat Market Trades == true
ADX lenght = 12
ADX Threshold = 17
Parabolic SAR == true
SAR start = 0.09
SAR inc = 0.04
SAR max = 0.2
Pyramiding = 15
Trailing Stop Activation % = 0.15
Trailing Stop Offset % (when profit=0.5 %) = 0.1
Trailing Stop Offset % (when profit=10 %) = 0.5
Stop Loss = 1.5
Tics/Pips Correction = 10
Initial Capital = 1000
Quantity = 8 contracts
Commission value = 0.2 USD per contract
US30 (OANDA)
Timeframe = 2H
Position Side = BOTH
Source = hlc3
T3 == true
T3 Length = 4
T3 Volume Factor = 0.9
Range Filter+ADX == true
Sampling Period = 11
Range Multiplier = 1.1
Flat Market Trades == true
ADX lenght = 16
ADX Threshold = 24
Parabolic SAR == true
SAR start = 0.08
SAR inc = 0.03
SAR max = 0.05
Pyramiding = 15
Trailing Stop Activation % = 0.15
Trailing Stop Offset % (when profit=0.5 %) = 0.075
Trailing Stop Offset % (when profit=10 %) = 0.5
Stop Loss = 1.5
Tics/Pips Correction = 10
Initial Capital = 1000
Quantity = 1 contracts
Commission value = 1.5 USD per contract
WHEAT (OANDA)
Timeframe = 2H
Position Side = BOTH
Source = hlc3
T3 == true
T3 Length = 3
T3 Volume Factor = 1.1
Range Filter+ADX == true
Sampling Period = 12
Range Multiplier = 0.9
Flat Market Trades == true
ADX lenght = 13
ADX Threshold = 21
Parabolic SAR == true
SAR start = 0.1
SAR inc = 0.05
SAR max = 0.15
Pyramiding = 15
Trailing Stop Activation % = 0.2
Trailing Stop Offset % (when profit=0.5 %) = 0.1
Trailing Stop Offset % (when profit=10 %) = 1
Stop Loss = 2.5
Tics/Pips Correction = 1000
Initial Capital = 1000
Quantity = 2500 contracts
Commission value = 0.003 USD per contract

Combo Backtest 123 Reversal and ADXR This is combo strategies for get
a cumulative signal. Result signal will return 1 if two strategies
is long, -1 if all strategies is short and 0 if signals of strategies is not equal.
First strategy
This System was created from the Book "How I Tripled My Money In The
Futures Market" by Ulf Jensen, Page 183. This is reverse type of strategies.
The strategy buys at market, if close price is higher than the previous close
during 2 days and the meaning of 9-days Stochastic Slow Oscillator is lower than 50.
The strategy sells at market, if close price is lower than the previous close price
during 2 days and the meaning of 9-days Stochastic Fast Oscillator is higher than 50.
Secon strategy
The Average Directional Movement Index Rating (ADXR) measures the strength
of the Average Directional Movement Index (ADX). It's calculated by taking
the average of the current ADX and the ADX from one time period before
(time periods can vary, but the most typical period used is 14 days).
Like the ADX, the ADXR ranges from values of 0 to 100 and reflects strengthening
and weakening trends. However, because it represents an average of ADX, values
don't fluctuate as dramatically and some analysts believe the indicator helps
better display trends in volatile markets.
WARNING:
- For purpose educate only
- This script to change bars colors.

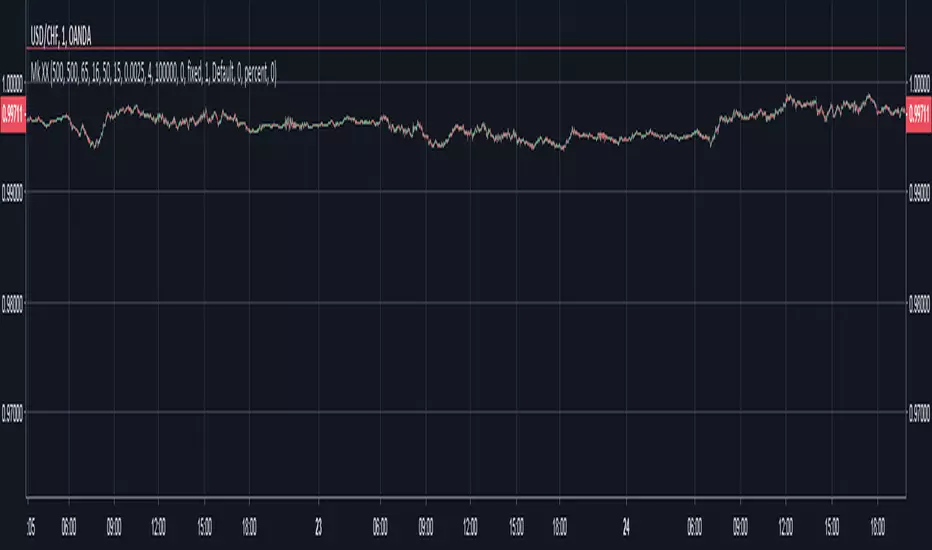
Mk XXIMPORTANT:
Use on 1m candles. Thick red/green lines are supp/res, thin are fibonacci.
Seems to work consistently on GBPUSD, EURUSD, USDCHF maybe AUDUSD, on NZDUSD it goes way out of the Fib lines. That's the main issue I have, no matter what I put the inputs at, won't work on all charts. I would customize it for each chart, but with 1m candles I can't backtest far enough to know whether it's reliable. I got it up to 300% or even 500% but it was never consistent. Here are some ranges I was using for the inputs:
Look-Back Res.: 50 - 500
Look-Back Sup.: 50 - 500
Time In Stage 1: 15 - 150
Readjust: 15 - 150
How Steep for a break: 15 - 150
Spacer: 5 - 25
TP: 0.0006 - 0.0025 (feel free to try higher)
Goals:
Consistency. You can try on other candle sizes, I was just using 1m because the buys/sells are more accurate
Drawdown under $50 ideally
Avg # Bars in Trades as low as possible, to get out quickly and enter trade on different coin pair
Note: Currently using $200,000 account and buying in with about $180k when all 4 trades are in. So results are using ridiculously high risk just so I can see max possible drawdown.
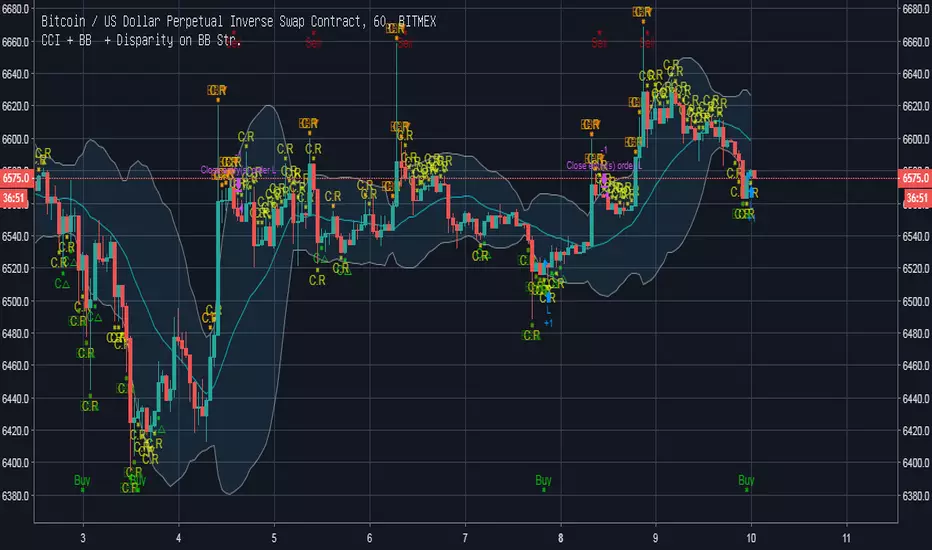
CCI + BB + Disparity on BB strategy ⓙThis script signals represents CCI and Bollinger Band Indicators.
Commodity Channel Index , called acronym CCI , represents over-sold or over-bought; ranges from -100 to +100.
This indicator provides a strategy be used for long-term or short-term trading plans.
CCI length is first set as 20 but it can be customized as 26, for example, which is used in Ichimoku Cloud deviation length.
RSI vs Stochastic vs Stochastic RSITo compare each indicator's performance toggle between the various buy and sell methods while watching results in the Strategy Tester pane.
OSC = Oscillates between crossing the chosen Lo or Hi levels for either RSI or Stochastic/Stochastic RSI.
CROSS = When the Stochastic or Stochastic RSI k crosses d.
Outer gray band equals Stochastic/StochasticRSI range.
Inner gray band equals RSI range.
NOTICE: This script does not require access from me, simply open Indicators on chart and search for "RSI vs Stochastic vs Stochastic RSI". By accessing this script you acknowledge that you have read and understood that this is for research purposes only and I am not responsible for any financial losses you may incur by using this script!

Average Directional Movement Index Rating Backtest The Average Directional Movement Index Rating (ADXR) measures the strength
of the Average Directional Movement Index (ADX). It's calculated by taking
the average of the current ADX and the ADX from one time period before
(time periods can vary, but the most typical period used is 14 days).
Like the ADX, the ADXR ranges from values of 0 to 100 and reflects strengthening
and weakening trends. However, because it represents an average of ADX, values
don't fluctuate as dramatically and some analysts believe the indicator helps
better display trends in volatile markets.
You can change long to short in the Input Settings
WARNING:
- For purpose educate only
- This script to change bars colors.

Parabolic SAR StrategyParabolic SAR strategy with a couple of extra features. Developed as a professional service and published for customer verification/approval.
Please visit the backtest-rookies (.com) website if you are interested in development services
Features
Parabolic SAR stop entry strategy.
Backtesting Ranges and dates for testing over specific regimes/periods
Long only or dual direction inputs

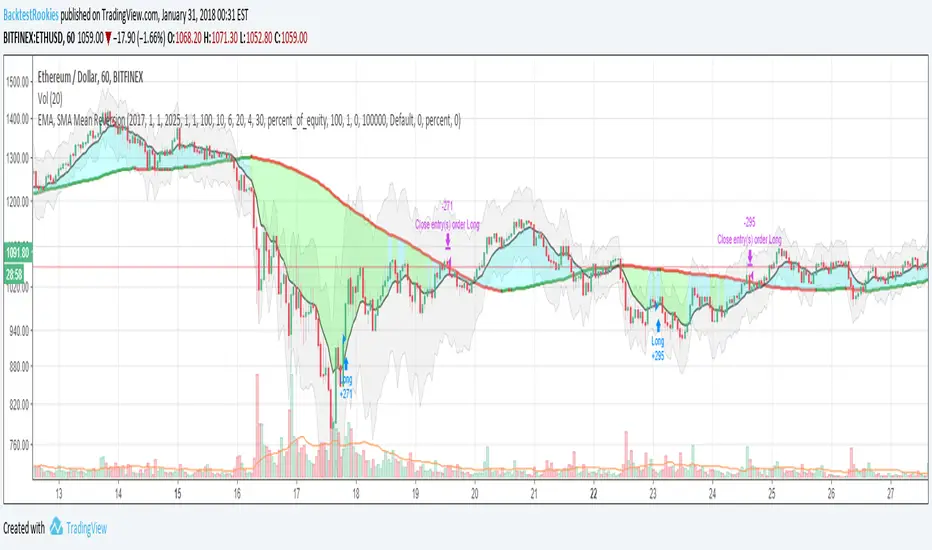
EMA, SMA Mean ReversionInvite Only: But everyone will be accepted
Invite-only in order to understand demand and interest in this type of strategy. All requests are welcome and will be accepted.
Full Source is available
A blog post containing full source code and commentary of the strategy is available on the backtest-rookies website. To comply with house rules, I cannot post a direct link here. (Hint add ".com" to backtest-rookies)
Overview
The strategy uses two moving averages to represent the historical mean and a slightly smoothed version of the current price action. It will place long or short trades when the fast EMA moves far away from the historical mean (the slow SMA).
Features
Set Backtest Date ranges
Enter when EMA is x% away from the mean
Independent inputs for the long and short side
Only enter when the EMA has started to reverse. (Input)
Optional Stop loss
Limit trades to a single direction to "Buy the dip" or "Sell the top"
POWER STRATEGY - Perfect for Meme Coins by OeZkAN📈 POWER STRATEGY - PRO EXTENDED FILTER (NO FIB ATR, TUNABLE)
This is a comprehensive, multi-layered trend-following strategy designed for Pine Script v5. It is built around a core EMA Re-Test entry logic, significantly enhanced by multiple, optional filters for Conviction, Volatility, Multi-Timeframe (MTF) Alignment, and Price Action Context (like FVAG, Divergence, Mobility, and LSOB), making it highly customizable and robust.
🌟 Core Logic & Trend Filtering
The strategy aims to trade pullbacks/re-tests toward a primary Exponential Moving Average (EMA).
Primary Trend Filter (EMA): An adjustable EMA (default 50) determines the dominant trend.
Long Condition: Price is above the EMA.
Short Condition: Price is below the EMA.
Re-Test Entry: An entry signal is generated when the price briefly touches or crosses the EMA (the "Re-Test") but immediately rejects it and closes back on the trend side (e.g., a candle's low hits the EMA, but it closes bullishly above it).
Confirmation (Optional): The useConfirmation setting enforces a waiting period (confirmationBars) after the initial re-test to ensure the price moves a minimum distance (confirmationThreshold, measured in multiples of ATR) away from the re-test low/high, confirming the bounce strength.
🎯 Advanced Filter Stack (The 'Extended Filter')
This strategy integrates multiple optional filters, providing a high degree of control over trade quality. All filters use the ATR (Average True Range) for dynamic, volatility-adjusted calculations.
Volatility Filter: Ensures the market is neither too calm (minVolatility) nor too excessively volatile (maxVolatility) by comparing the current ATR to a long-term SMA of the ATR.
Conviction Score & MTF Alignment:
Conviction Score: A weighted score (max 6 points) combining the primary EMA trend (2 points) and alignment across three user-defined Multi-Timeframes (MTF TF1, TF2, TF3, 1 point each).
MTF Agreement: Requires a minimum number of timeframes (minTFAgreement) to agree with the entry direction. The Entry Conviction Level (minConvictionEntry) then acts as the final quality gate.
FVAG Filter (Fair Value Area Gap): Uses an SMA and ATR-based bands to identify when the price is pulling back into a 'Fair Value Area' (similar to Mean Reversion context) to align entries with high-probability reversal zones.
Pro Mobility Score (Optional): Measures the size of the current bar range relative to the average bar range over a mobilityLength period. Used to ensure sufficient current market movement for an effective trade.
LSOB Filter (Last Stagnant Order Block - simplified): Tries to detect if the price is near a recent low-volatility consolidation zone, filtering for potential breakout/continuation trades from these areas.
Divergence Filter (Optional): Uses RSI to check for Bullish or Bearish Divergence, aiming to align entries with underlying momentum shifts.
🛡️ Risk Management & Controllers
Dynamic TP/SL: Take Profit (TP1, TP2, TP3) and Stop Loss (SL) levels are dynamically calculated as multiples of the current ATR value.
Minimum R:R Ratio: The strategy blocks entries where the calculated Risk-to-Reward ratio (based on SL to TP1) is below a user-defined threshold (minRiskReward).
Trailing Stop: When activated (useTrailing), the stop-loss is moved to Breakeven after TP1 is hit, with an additional buffer (beBuffer x ATR). The stop then trails the price by a defined trailingDistance x ATR.
Auto-Fix Controllers: A unique feature designed to increase stability. The controllers monitor for core anomalies (errorMonitor) and calculation issues (calcIntegrity). In auto_fix mode, they apply non-intrusive fixes (e.g., temporarily relaxing the minConvictionEntry or disabling trailing stop if errors are detected) and can block entries for severe issues (safetyBlock).
🛠️ Customization and Use
This strategy is highly tunable. Users can selectively enable/disable filters to adapt the logic to different market conditions or assets.
Grouped Inputs: Inputs are logically grouped for easy adjustment of Trend, Volatility, Confirmation, Entry, TP/SL, Trailing, and various Filter settings.
Debug Mode: Enables detailed on-chart labels for internal variables (Conviction Score, Volatility, etc.) to aid in backtesting and optimization.
📢 Check Out My Other Work!
If you find this strategy valuable, please take a moment to explore my profile on TradingView. I have developed several other unique and robust Pine Script strategies and indicators focused on combining multiple data layers (price action, volume, volatility, and order flow concepts) into high-probability trading models.
They are definitely worth a look for any serious trader!
Disclaimer
This script is for educational and testing purposes only. Trading involves significant risk, and past performance is not indicative of future results.

Simple Candle Strategy# Candle Pattern Strategy - Pine Script V6
## Overview
A TradingView trading strategy script (Pine Script V6) that identifies candlestick patterns over a configurable lookback period and generates trading signals based on pattern recognition rules.
## Strategy Logic
The strategy analyzes the most recent N candlesticks (default: 5) and classifies their patterns into three categories, then generates buy/sell signals based on specific pattern combinations.
### Candlestick Pattern Classification
Each candlestick is classified as one of three types:
| Pattern | Definition | Formula |
|---------|-----------|---------|
| **Close at High** | Close price near the highest price of the candle | `(high - close) / (high - low) ≤ (1 - threshold)` |
| **Close at Low** | Close price near the lowest price of the candle | `(close - low) / (high - low) ≤ (1 - threshold)` |
| **Doji** | Opening and closing prices very close; long upper/lower wicks | `abs(close - open) / (high - low) ≤ threshold` |
### Trading Rules
| Condition | Action | Signal |
|-----------|--------|--------|
| Number of Doji candles ≥ 3 | **SKIP** - Market is too chaotic | No trade |
| "Close at High" count ≥ 2 + Last candle closes at high | **LONG** - Bullish confirmation | Buy Signal |
| "Close at Low" count ≥ 2 + Last candle closes at low | **SHORT** - Bearish confirmation | Sell Signal |
## Configuration Parameters
All parameters are adjustable in TradingView's "Settings/Inputs" tab:
| Parameter | Default | Range | Description |
|-----------|---------|-------|-------------|
| **K-line Lookback Period** | 5 | 3-20 | Number of candlesticks to analyze |
| **Doji Threshold** | 0.1 | 0.0-1.0 | Body size / Total range ratio for doji identification |
| **Doji Count Limit** | 3 | 1-10 | Number of dojis that triggers skip signal |
| **Close at High Proximity** | 0.9 | 0.5-1.0 | Required proximity to highest price (0.9 = 90%) |
| **Close at Low Proximity** | 0.9 | 0.5-1.0 | Required proximity to lowest price (0.9 = 90%) |
### Parameter Tuning Guide
#### Proximity Thresholds (Close at High/Low)
- **0.95 or higher**: Stricter - only very strong candles qualify
- **0.90 (default)**: Balanced - good for most market conditions
- **0.80 or lower**: Looser - catches more patterns, higher false signals
#### Doji Threshold
- **0.05-0.10**: Strict doji identification
- **0.10-0.15**: Standard doji detection
- **0.15+**: Includes near-doji patterns
#### Lookback Period
- **3-5 bars**: Fast, sensitive to recent patterns
- **5-10 bars**: Balanced approach
- **10-20 bars**: Slower, filters out noise
## Visual Indicators
### Chart Markers
- **Green Up Arrow** ▲: Long entry signal triggered
- **Red Down Arrow** ▼: Short entry signal triggered
- **Gray X**: Skip signal (too many dojis detected)
### Statistics Table
Located at top-right corner, displays real-time pattern counts:
- **Close at High**: Count of candles closing near the high
- **Close at Low**: Count of candles closing near the low
- **Doji**: Count of doji/near-doji patterns
### Signal Labels
- Green label: "✓ Long condition met" - below entry bar
- Red label: "✓ Short condition met" - above entry bar
- Gray label: "⊠ Too many dojis, skip" - trade skipped
## Risk Management
### Exit Strategy
The strategy includes built-in exit rules based on ATR (Average True Range):
- **Stop Loss**: ATR × 2
- **Take Profit**: ATR × 3
Example: If ATR is $10, stop loss is at -$20 and take profit is at +$30
### Position Sizing
Default: 100% of equity per trade (adjustable in strategy properties)
**Recommendation**: Reduce to 10-25% of equity for safer capital allocation
## How to Use
### 1. Copy the Script
1. Open TradingView
2. Go to Pine Script Editor
3. Create a new indicator
4. Copy the entire `candle_pattern_strategy.pine` content
5. Click "Add to Chart"
### 2. Apply to Chart
- Select your preferred timeframe (1m, 5m, 15m, 1h, 4h, 1d)
- Choose a trading symbol (stocks, forex, crypto, etc.)
- The strategy will generate signals on all historical bars and in real-time
### 3. Configure Parameters
1. Right-click the strategy on chart → "Settings"
2. Adjust parameters in the "Inputs" tab
3. Strategy will recalculate automatically
4. Backtest results appear in the Strategy Tester panel
### 4. Backtesting
1. Click "Strategy Tester" (bottom panel)
2. Set date range for historical testing
3. Review performance metrics:
- Win rate
- Profit factor
- Drawdown
- Total returns
## Key Features
✅ **Execution Model Compliant** - Follows official Pine Script V6 standards
✅ **Global Scope** - All historical references in global scope for consistency
✅ **Adjustable Sensitivity** - Fine-tune all pattern detection thresholds
✅ **Real-time Updates** - Works on both historical and real-time bars
✅ **Visual Feedback** - Clear signals with labels and statistics table
✅ **Risk Management** - Built-in ATR-based stop loss and take profit
✅ **No Repainting** - Signals remain consistent after bar closes
## Important Notes
### Before Trading Live
1. **Backtest thoroughly**: Test on at least 6-12 months of historical data
2. **Paper trading first**: Practice with simulated trades
3. **Optimize parameters**: Find the best settings for your trading instrument
4. **Manage risk**: Never risk more than 1-2% per trade
5. **Monitor performance**: Review trades regularly and adjust as needed
### Market Conditions
The strategy works best in:
- Trending markets with clear directional bias
- Range-bound markets with defined support/resistance
- Markets with moderate volatility
The strategy may underperform in:
- Highly choppy/noisy markets (many false signals)
- Markets with gaps or overnight gaps
- Low liquidity periods
### Limitations
- Works on chart timeframes only (not intrabar analysis)
- Requires at least 5 bars of history (configurable)
- Fixed exit rules may not suit all trading styles
- No trend filtering (will trade both directions)
## Technical Details
### Historical Buffer Management
The strategy declares maximum bars back to ensure enough historical data:
```pine
max_bars_back(close, 20)
max_bars_back(open, 20)
max_bars_back(high, 20)
max_bars_back(low, 20)
```
This prevents runtime errors when accessing historical candlestick data.
### Pattern Detection Algorithm
```
For each bar in lookback period:
1. Calculate (high - close) / (high - low) → close_to_high_ratio
2. If close_to_high_ratio ≤ (1 - threshold) → count as "Close at High"
3. Calculate (close - low) / (high - low) → close_to_low_ratio
4. If close_to_low_ratio ≤ (1 - threshold) → count as "Close at Low"
5. Calculate abs(close - open) / (high - low) → body_ratio
6. If body_ratio ≤ doji_threshold → count as "Doji"
Signal Generation:
7. If doji_count ≥ cross_count_limit → SKIP_SIGNAL
8. If close_at_high_count ≥ 2 AND last_close_at_high → LONG_SIGNAL
9. If close_at_low_count ≥ 2 AND last_close_at_low → SHORT_SIGNAL
```
## Example Scenarios
### Scenario 1: Bullish Signal
```
Last 5 bars pattern:
Bar 1: Closes at high (95%) ✓
Bar 2: Closes at high (92%) ✓
Bar 3: Closes at mid (50%)
Bar 4: Closes at low (10%)
Bar 5: Closes at high (96%) ✓ (last bar)
Result:
- Close at high count: 3 (≥ 2) ✓
- Last closes at high: ✓
- Doji count: 0 (< 3) ✓
→ LONG SIGNAL ✓
```
### Scenario 2: Skip Signal
```
Last 5 bars pattern:
Bar 1: Doji pattern ✓
Bar 2: Doji pattern ✓
Bar 3: Closes at mid
Bar 4: Doji pattern ✓
Bar 5: Closes at high
Result:
- Doji count: 3 (≥ 3)
→ SKIP SIGNAL - Market too chaotic
```
## Performance Optimization
### Tips for Better Results
1. **Use Higher Timeframes**: 15m or higher reduces false signals
2. **Combine with Indicators**: Add volume or trend filters
3. **Seasonal Adjustment**: Different parameters for different seasons
4. **Instrument Selection**: Test on liquid, high-volume instruments
5. **Regular Rebalancing**: Adjust parameters quarterly based on performance
## Troubleshooting
### No Signals Generated
- Check if lookback period is too large
- Verify proximity thresholds aren't too strict (try 0.85 instead of 0.95)
- Ensure doji limit allows for trading (try 4-5 instead of 3)
### Too Many False Signals
- Increase proximity thresholds to 0.95+
- Reduce lookback period to 3-4 bars
- Increase doji limit to 3-4
- Test on higher timeframes
### Strategy Tester Shows Losses
- Review individual trades to identify patterns
- Adjust stop loss and take profit ratios
- Change lookback period and thresholds
- Test on different market conditions
## References
- (www.tradingview.com)
- (www.tradingview.com)
- (www.investopedia.com)
- (www.investopedia.com)
## Disclaimer
**This strategy is provided for educational and research purposes only.**
- Not financial advice
- Past performance does not guarantee future results
- Always conduct thorough backtesting before live trading
- Trading involves significant risk of loss
- Use proper risk management and position sizing
## License
Created: December 15, 2025
Version: 1.0
---
**For updates and modifications, refer to the accompanying documentation files.**

[SM-021] Gaussian Trend System [Optimized]This script is a comprehensive trend-following strategy centered around a Gaussian Channel. It is designed to capture significant market movements while filtering out noise during consolidation phases. This version (v2) introduces code optimizations using Pine Script v6 Arrays and a new Intraday Time Control feature.
1. Core Methodology & Math
The foundation of this strategy is the Gaussian Filter, originally conceptualized by @DonovanWall.
Gaussian Poles: Unlike standard moving averages (SMA/EMA), this filter uses "poles" (referencing signal processing logic) to reduce lag while maintaining smoothness.
Array Optimization: In this specific iteration, the f_pole function has been refactored to utilize Pine Script Arrays. This improves calculation efficiency and rendering speed compared to recursive variable calls, especially when calculating deep historical data.
Channel Logic: The strategy calculates a "Filtered True Range" to create High and Low bands around the main Gaussian line.
Long Entry: Price closes above the High Band.
Short Entry: Price closes below the Low Band.
2. Signal Filtering (Confluence)
To reduce false signals common in trend-following systems, the strategy employs a "confluence" approach using three additional layers:
Baseline Filter: A 200-period (customizable) EMA or SMA acts as a regime filter. Longs are only taken above the baseline; Shorts only below.
ADX Filter (Volatility): The Average Directional Index (ADX) is used to measure trend strength. If the ADX is below a user-defined threshold (default: 20), the market is considered "choppy," and new entries are blocked.
Momentum Check: A Stochastic RSI check ensures that momentum aligns with the breakout direction.
3. NEW: Intraday Session Filter
Per user requests, a time-based filter has been added to restrict trading activity to specific market sessions (e.g., the New York Open).
How it works: Users can toggle a checkbox to enable/disable the filter.
Configuration: You can define a specific time range (Default: 09:30 - 16:00) and a specific Timezone (Default: New York).
Logic: The strategy longCondition and shortCondition now check if the current bar's timestamp falls within this window. If outside the window, no new entries are generated, though existing trades are managed normally.
4. Risk Management
The strategy relies on volatility-based exits rather than fixed percentage stops:
ATR Stop Loss: A multiple of the Average True Range (ATR) is calculated at the moment of entry to set a dynamic Stop Loss.
ATR Take Profit: An optional Reward-to-Risk (RR) ratio can be set to place a Take Profit target relative to the Stop Loss distance.
Band Exit: If the trend reverses and price crosses the opposite band, the trade is closed immediately to prevent large drawdowns.
Credits & Attribution
Original Gaussian Logic: Developed by @DonovanWalll. This script utilizes his mathematical formula for the pole filters.
Strategy Wrapper & Array Refactor: Developed by @sebamarghella.
Community Request: The Intraday Session Filter was added to assist traders focusing on specific liquidity windows.
Disclaimer: This strategy is for educational purposes. Past performance is not indicative of future results. Please use the settings menu to adjust the Session Time and Risk parameters to fit your specific asset class.
