Average Daily Range by EleventradesThe Average Daily Range (ADR) indicator helps traders measure how much of the current day’s range has already been completed and how much movement may still be available.
This tool calculates the average range of previous daily candles and compares it with the current day’s price action. It displays how many points of the ADR have been consumed, how much remains, and the percentage of the daily range already covered. This allows traders to better judge whether price is still expanding or approaching exhaustion.
Key Features:
ADR Consumption Tracking
Shows how much of the daily range has already been used in both points and percentage terms.
Reversal Threshold
A customizable threshold that highlights when price exceeds a defined ADR value, signaling potential exhaustion or reversal zones.
Mean Reversion Logic
When price reaches a user-defined percentage of the ADR, the indicator helps identify areas where price may revert back toward the daily range.
ADR Exceeded Alert
Displays a message when price exceeds 100% of the average daily range.
Information Table
A clean table that summarizes ADR values, consumed range, remaining range, and percentage data for quick reference.
ADR Projection Levels
Projected upper and lower ADR levels are plotted using visual guide lines, helping traders see where the daily range may extend before exceeding typical limits.
Tìm kiếm tập lệnh với "range"

[turpsy] Midnight Opening Range-Fractal Midnight Open Range-Fractal Combined Trading System
Overview
This indicator combines Midnight Opening Range (MOR) analysis with HTF candle structure and fractal patterns to provide a comprehensive intraday trading framework. Unlike simple mashups, this system integrates three complementary methodologies that work together to identify high-probability trading zones.
Core Components & Synergy
1. MOR (Midnight Opening Range) Indicator
- Tracks the first 30 minutes of each trading day (00:00-00:30)
- Draws historical and current session boxes with quartile levels (25%, 50%, 75%)
- Custom opening price lines for key market times (NY Open 9:30, London Close, etc.)
- Concept:
Price tends to respect the opening range boundaries; quartiles act as support/resistance
2. HTF (Higher Timeframe) Candles
- Displays up to 6 higher timeframe candles alongside your chart
- Shows Fair Value Gaps (FVG) and Volume Imbalances (VI)
- Presents First Presented FVG (PFVG) - the initial gap after a fractal
- Concept:
HTF structure provides context for LTF entries; FVGs are magnetic price targets
3. Fractal Pattern Detection with CISD
- Identifies swing highs/lows using HTF candle structure
- CISD (Change in State of Delivery) lines mark confirmed fractal breaks
- Chart sweeps show liquidity grabs
- Concept: Fractals mark key market structure; CISD confirms directional bias
4. Killzones & Session Analysis
- Asia, London, NewYork AM/PM, and Lunch sessions
- Session highs/lows with pivot tracking
- Day/Week/Month opens and separators
- Concept: Specific sessions show characteristic volatility and directional behavior
5. ADR/CDR Analysis
- Average Daily Range and Current Daily Range tracking
- Shows percentage of ADR completed
- Concept: Helps gauge if there's room for continuation or if exhaustion is likely
How They Work Together
1. Context: It uses HTF candles and MOR boxes to identify the bigger picture structure
2. Timing: It uses Killzones to show when institutional activity is highest
3. Entry: It uses Fractals with CISD confirm structure breaks; FVGs provide entry zones
4. Risk Management: ADR/CDR helps set realistic profit targets and assess if move is extended
Original Contributions
This script significantly improves upon the base components by:
- Integrating 1-minute data feed for accurate Midnight Open Range calculations on all timeframes
- Adding PFVG detection synchronized with fractal patterns
- Creating logarithmic midpoint calculations between HTF candles
- Implementing chart sweep detection for liquidity analysis
- Adding CISD projection lines at 0.5, 1.0, 1.5, 2.0 extensions
How to Use
1. Enable desired HTF timeframes and MOR settings
2. Watch for PFVG formation after HTF candle closes
3. Look for CISD line breaks during killzone sessions
4. Enter at FVG mitigation zones aligned with MOR quartiles
5. Monitor ADR% to gauge move potential
Credits
- HTF Candles base structure: fadizeidan & tradeforopp
- Midnight opening range: trades-dont-lie
- I made the Significant modifications and integration

Session Range Control [PointAlgo]Session Range Control (SRC)
The Session Range Control (SRC) indicator provides a structured view of intraday price behavior by tracking where the current price sits within the session’s high–low range and how today’s volatility compares to the Average Daily Range (ADR). It combines range analytics, momentum context, volatility interpretation, and visual cues to help traders understand session strength and shifts in intraday conditions.
Core Concept
Every trading session forms a unique high and low. SRC continuously reads these values and calculates the Position in Range, expressed on a scale from 0% to 100%:
0% → Price at Day Low
100% → Price at Day High
50% → Mid-range equilibrium
By normalizing price into a percentage, traders can quickly interpret where market pressure is concentrated during the session.
Trend Zones and Market State
SRC divides the range into logical zones to show the likely sentiment of the session:
1. Strong Uptrend Zone (Above Threshold)
When price consistently holds above the user-defined upper threshold (e.g., 60%), the indicator marks a Strong Uptrend.
This typically reflects:
Persistent intraday buying pressure
Price acceptance near the upper part of the range
Reduced likelihood of deep pullbacks
2. Strong Downtrend Zone (Below Threshold)
When price remains below the lower threshold (e.g., 40%), SRC signals a Strong Downtrend, indicating:
Dominant intraday selling
Consistent pressure keeping price near session lows
3. Bullish / Bearish Zones
Between the midline and strong thresholds, SRC displays softer trend zones:
Above 50% = Bullish Zone
Below 50% = Bearish Zone
These zones help classify whether price is trending, balanced, or drifting.
4. Neutral Territory
When price hovers around the mid-level without conviction, the indicator treats it as a neutral or undecided phase.
Signal Logic :
SRC includes built-in momentum shift signals based on range transitions:
Long Signal
Triggered when price crosses upward through 50%, often showing:
A shift from intraday weakness to strength
Buyers gaining control of the session
Short Signal
Triggered when price crosses downward through 50%, suggesting:
Loss of intraday strength
Sellers taking control
These signals help highlight potential turning points inside the session.
Extreme Levels :
SRC highlights the top and bottom 10% of the range:
> 90% = Extreme High (Overbought intraday condition)
< 10% = Extreme Low (Oversold intraday condition)
These conditions can be useful for identifying overextended movements or potential reaction zones.
ADR Comparison and Volatility Context :
The indicator also measures how today’s price range compares to the Average Daily Range (ADR):
Range Expanding: Today’s range is significantly larger than the ADR
Indicates heightened volatility
Often associated with trending or breakout environments
Range Compressing: Today’s range is much smaller
Suggests low volatility
Common before breakout phases
Characteristic of consolidation or balanced markets
This volatility context helps traders assess whether the session is behaving within normal boundaries or deviating significantly.
Dashboard Overview :
When enabled, the dashboard summarizes key intraday metrics in a structured table:
Trend status (Strong Uptrend, Strong Downtrend, Bullish, Bearish, Neutral)
Range position (%)
Signal status (Long Cross, Short Cross, Extreme High/Low, or None)
Day range calculation
Range vs ADR (%)
Day High / Day Low
Current price level
Simplified action label based on current conditions
This provides a quick reference system to interpret both trend and volatility at a glance without analyzing the full chart visually.
Visual Elements
SRC includes:
Colored dynamic plot for easy trend recognition
Horizontal reference lines at key levels (0%, 50%, 100%, strong-trend thresholds)
Background shading during extreme zone conditions
A separate ADR comparison plot
These visuals ensure the indicator remains intuitive regardless of chart style or timeframe.
Alerts
The script includes alert conditions for:
Long cross
Short cross
Strong trend detection
Extreme high / extreme low
These allow users to automate notifications during key market events without manually monitoring the chart.
Customization Options
Users can configure:
ADR length
Strong trend thresholds
Dashboard visibility
Dashboard position on chart
This makes SRC adaptable to different trading instruments and intraday styles.
Usage Notes
Works best on intraday timeframes where session boundaries are clearly defined.
Designed for analytical interpretation—trend bias, volatility phase, and range structure.
Can complement other tools such as moving averages, volume, or market structure analysis.
Disclaimer :
This indicator is intended for chart analysis and educational purposes only.
It does not generate financial, investment, or trading advice.
Users should validate signals with additional research and apply proper risk management.

Forex Session TrackerForex Session Tracker - Professional Trading Session Indicator
The Forex Session Tracker is a comprehensive and visually intuitive indicator designed specifically for forex traders who need precise tracking of major global trading sessions. This powerful tool helps traders identify active market sessions, monitor session-specific price ranges, and capitalize on volatility patterns unique to each trading period.
Understanding when major financial centers are active is crucial for forex trading success. This indicator provides real-time visualization of the Tokyo, London, New York, and Sydney trading sessions, allowing traders to align their strategies with peak liquidity periods and avoid low-volatility trading windows.
---
Key Features
📊 Four Major Global Trading Sessions
The indicator tracks all four primary forex trading sessions with precision:
- Tokyo Session (Asian Market) - Captures the Asian trading hours, ideal for JPY, AUD, and NZD pairs
- London Session (European Market) - Monitors the most liquid trading period, perfect for EUR, GBP pairs
- New York Session (American Market) - Tracks US market hours, essential for USD-based currency pairs
- Sydney Session (Pacific Market) - Identifies the opening of the trading week and AUD/NZD activity
Each session is fully customizable with individual color schemes, making it easy to distinguish between different market periods at a glance.
🎯 Session Range Visualization
For each active trading session, the indicator automatically:
- Draws rectangular boxes that highlight the session's time period
- Tracks and displays session HIGH and LOW price levels in real-time
- Creates horizontal lines at session extremes for easy reference
- Positions session labels at the center of each trading period
- Updates dynamically as new highs or lows are formed within the session
This visual approach helps traders quickly identify:
- Session breakout opportunities
- Support and resistance zones formed during specific sessions
- Range-bound vs. trending session behavior
- Key price levels that institutional traders are watching
📱 Live Information Dashboard
A sleek, professional information panel displays:
- Real-time session status - Instantly see which sessions are currently active
- Color-coded indicators - Green dots for active sessions, gray for closed sessions
- Timezone information - Confirms your current timezone settings
- Customizable positioning - Place the dashboard anywhere on your chart (Top Left, Top Right, Bottom Left, Bottom Right)
- Adjustable size - Choose from Tiny, Small, Normal, or Large text sizes for optimal visibility
The dashboard provides at-a-glance awareness of market conditions without cluttering your chart analysis.
⚙️ Extensive Customization Options
Every aspect of the indicator can be tailored to your trading preferences:
Session-Specific Controls:
- Enable/disable individual sessions
- Customize colors for each trading period
- Adjust session times to match your broker's server time
- Toggle background highlighting on/off
- Show/hide session high/low lines independently
General Settings:
- UTC Offset Control - Adjust timezone from UTC-12 to UTC+14
- Exchange Timezone Option - Automatically use your chart's exchange timezone
- Background Transparency - Fine-tune the opacity of session highlighting (0-100%)
- Session Labels - Show or hide session name labels
- Information Panel - Toggle the live status dashboard on/off
Style Settings:
- Turn session backgrounds ON/OFF directly from the Style tab
- Maintain clean charts while keeping all analytical features active
🔔 Built-in Alert System
Stay informed about session openings with customizable alerts:
- Tokyo Session Started
- London Session Started
- New York Session Started
- Sydney Session Started
Set up notifications to never miss important market opening periods, even when you're away from your charts.
---
How to Use This Indicator
For Day Traders:
1. Identify High-Volatility Periods - Focus your trading during London and New York session overlaps for maximum liquidity
2. Monitor Session Breakouts - Watch for price breaks above/below session highs and lows
3. Avoid Low-Volume Periods - Recognize when major sessions are closed to avoid false signals
For Swing Traders:
1. Mark Key Levels - Use session highs and lows as support/resistance zones
2. Track Multi-Session Patterns - Observe how price behaves across different trading sessions
3. Plan Entry/Exit Points - Time your trades around session openings for better execution
For Currency-Specific Traders:
1. JPY Pairs - Focus on Tokyo session movements
2. EUR/GBP Pairs - Monitor London session activity
3. USD Pairs - Track New York session volatility
4. AUD/NZD Pairs - Watch Sydney and Tokyo sessions
---
Technical Specifications
- Pine Script Version: 5
- Overlay Indicator: Yes (displays directly on price chart)
- Maximum Bars Back: 500
- Drawing Objects: Up to 500 lines, boxes, and labels
- Performance: Optimized for real-time data processing
- Compatibility: Works on all timeframes (recommended: 5m to 1H for session tracking)
---
Installation & Setup
1. Add to Chart - Click "Add to Chart" after copying the script to Pine Editor
2. Configure Timezone - Set your UTC offset or enable "Use Exchange Timezone"
3. Customize Colors - Choose your preferred color scheme for each session
4. Adjust Display - Enable/disable features based on your trading style
5. Set Alerts - Create alert notifications for session starts
---
Best Practices
✅ Combine with Price Action - Use session ranges alongside candlestick patterns for confirmation
✅ Watch Session Overlaps - The London-New York overlap (1300-1600 UTC) typically shows highest volatility
✅ Respect Session Highs/Lows - These levels often act as intraday support and resistance
✅ Adjust for Your Broker - Verify session times match your broker's server clock
✅ Use Multiple Timeframes - View sessions on both lower (15m) and higher (1H) timeframes for context
---
Why Choose Forex Session Tracker Pro?
✨ Professional Grade Tool - Built with clean, efficient code following TradingView best practices
✨ Beginner Friendly - Intuitive design with clear visual cues
✨ Highly Customizable - Adapt every feature to match your trading style
✨ Performance Optimized - Lightweight code that won't slow down your charts
✨ Actively Maintained - Regular updates and improvements
✨ No Repainting - All visual elements are fixed once the session completes
---
Support & Updates
This indicator is designed to provide reliable, accurate session tracking for forex traders of all experience levels. Whether you're a scalper looking for high-volatility windows or a position trader marking key institutional levels, the Forex Session Tracker Pro delivers the insights you need to make informed trading decisions.
Happy Trading! 📈
---
Disclaimer
This indicator is a tool for technical analysis and should be used as part of a comprehensive trading strategy. Past performance does not guarantee future results. Always practice proper risk management and never risk more than you can afford to lose. Trading forex carries a high level of risk and may not be suitable for all investors.

CRT Full Checklist - Range Logic Trading📊 Professional Trading Dashboard for Range-Based Trading
A comprehensive, multi-column checklist designed for systematic traders who specialize in range trading across multiple currency pairs and instruments. This visual dashboard provides an organized workflow for the Range Logic Trading methodology.
🎯 KEY FEATURES
🔄 Multi-Instrument Range Monitoring
6 customizable columns for different instruments (EUR/USD, GBP/USD, USD/CAD, XAU/USD OA, XAU/USD FX, DXY)
Individual activation/deactivation for each column
Customizable instrument names and colors
📈 Range Trading Decision Framework
R Activa - Active range assessment (SI/NO/N/A)
Direction - Range breakout direction with color-coded options (Alcista/Bajista/Ambas)
Es para Obvio - Clear range setup qualification (SI/NO/N/A)
Rango Operativo - Operational timeframes for range analysis (2-1H to 11-2h)
FS 4H> - 4-hour frame structure within ranges (EUR/GBP/DXY)
⚡ Range Trading Entry System
Buscamos - Dual dropdown system for range levels (High/Low of 1H-4H, Direct Entry)
Objetivo - Range-based targets (Range/High 4H)
Entrada - Multiple range entry conditions (TS R Activa, TS 1H/4H RO)
🚨 Range Trading Risk Management
Red Flag System - Three range-specific warning flags:
Alto/Bajo Correlacionado
Alto/Bajo 4H Inhabilita
R/A Invalidado
🎨 CUSTOMIZATION
Fully customizable colors for all range levels and conditions
Adjustable text sizes (Tiny to Large)
Individual column colors for quick range identification
Professional color coding for range breakouts and rejections
💡 PRACTICAL BENEFITS
Streamlined range trading workflow across multiple instruments
Visual range assessment with color-coded levels
Systematic approach to range identification and breakout trading
Time-saving dashboard for range-bound market conditions
Customizable reminder section with range trading principles
🎯 PERFECT FOR
Range-bound market specialists
Multi-instrument range traders
Systematic breakout traders
Risk-conscious range traders
Traders using Range Logic Trading methodology
Master range trading across multiple instruments with this professional CRT dashboard designed specifically for Range Logic Trading systems!
Note: This indicator is for educational purposes and should be used as part of a comprehensive trading plan. Always practice proper risk management in range trading.

DRACO DateTime Range Box — DELTA📘 Title
DRACO DateTime Range Box — Stable Δ (Fixed Bottom, Extend-Right)
🔹 Short Description
A single stable range box from a custom start date and time.
The box locks its bottom to the first candle’s low, expands the top to the highest high, and accumulates Bars / Volume / Net Δ (buyers vs sellers).
Anchored to time (xloc.bar_time) so it stays stable and does not drift when zooming.
🔹 Full Description
What it does
DRACO DateTime Range Box — Stable Δ draws one clean, session-like box between any two dates and times you choose.
The bottom is fixed to the first in-range candle’s low (never moves).
The top expands dynamically to the highest high within the range.
The indicator accumulates:
• Bars – total candle count
• Volume – summed traded volume
• Net Δ (delta) – buyers vs sellers dominance
All geometry is anchored by real time (xloc.bar_time), ensuring perfect stability during zooming or resizing.
Optional extend-right mode continues the high and low levels into the future as guide lines.
Typical Use Cases
Accumulation / distribution analysis within a fixed time window.
Identifying who dominated the period — buyers (+) or sellers (−).
Spotting large-scale range phases or institutional accumulation.
Using the extended high/low as future support/resistance reference.
Delta Calculation (Proxy)
Δ
𝑏
𝑎
𝑟
≈
𝑉
𝑜
𝑙
𝑢
𝑚
𝑒
×
(
𝐶
𝑙
𝑜
𝑠
𝑒
−
𝑂
𝑝
𝑒
𝑛
)
max
(
𝐻
𝑖
𝑔
ℎ
−
𝐿
𝑜
𝑤
,
𝑡
𝑖
𝑐
𝑘
)
Δ
bar
≈Volume×
max(High−Low,tick)
(Close−Open)
Each bar’s Δ is clamped between −Volume and +Volume.
This provides a lightweight approximation of order-flow delta without needing raw tick data.
🔹 How to Use
Select your preferred Time Zone (Exchange / UTC / Europe/London).
Choose a precise From Date & Time.
Optionally enable Use End Date/Time to fix the end of the range.
Turn on Extend High/Low to the Right if you want future S/R lines.
Observe the bottom label:
Bars | Volume | Net Δ (+/−) (Buyers or Sellers)
🔹 Key Inputs
Date & Time Range
Time Zone — controls timestamp alignment
From — start date and time
Use End Date/Time — optional fixed range end
Box Settings
Border Color / Fill Color while active
Extend High/Low to Right — continues levels beyond the current bar
Bottom Label
Displays live metrics (Bars / Volume / Net Δ)
Customizable text color, background, and size
🔹 Notes & Limitations
Δ here is an approximate proxy, not real order-flow.
For educational and analytical use only — not financial advice.
If the selected range has no candles, the box will not appear.
Refresh the chart after changing the time zone or From/To dates.

ADR - Average Daily Range [KasTrades]This is an Average Daily Range (ADR) indicator.
There are two settings for ADR:
Two Look back period ADR range (e.g. 7 and 14 days)
One Look back period ADR (e.g. 5 days only)
Two day ADR ranges are typically used in equities and index futures whereas one day ADR is typically used in forex.
The opening time by default is 17:00 New York (Eastern) time. The ranges are always calculated from the opening price of the first bar on the respected timeframe.

Sessions [Trade Tribe HQ]Color-coded session ranges with ADR% labels to help you trade smarter, not harder.
This tool marks New York, London, Tokyo, and Sydney sessions, showing their ranges, highs/lows, VWAPs, and ADR%.
🔹 Key Features
Colored session boxes (NY, London, Tokyo, Sydney)
Session highs & lows, VWAP, and trendlines
Dashboard showing active sessions, volume, and %ADR
ADR% labels at session close
🔹 How It Helps
Spot session traps, moves, and reversals faster
Manage expectations using ADR% (no chasing over-extended moves)
Identify overlap zones (London → NY) for volatility spikes
Simplify cycle tracking across global markets
Market Sessions Marker—making it easy to see where the energy has been spent and where opportunity is building next.
Created with ❤️ by TraderChick – part of the Trade Tribe HQ community.
If you found this tool useful, check out my profile for more strategies, classes, and resources.

Monday's Range Superpowerkyu🔔 Settings
You can customize the colors and toggle ON/OFF in the indicator settings.
Works on daily, hourly, and minute charts.
Easily visualize Monday’s high, low, and mid-line range.
📌 1. Support & Resistance with Monday’s Range
Monday High: Acts as the first resistance of the week.
◽ Example: If price breaks above Monday’s high after Tuesday, it signals potential bullish continuation → long setup.
Monday Low: Acts as the first support of the week.
◽ Example: If price breaks below Monday’s low, it signals bearish continuation → short setup.
📌 2. Mid-Line Trend Confirmation
Monday Mid-Line = average price of Monday.
Price above mid-line → bullish bias.
Price below mid-line → bearish bias.
Use mid-line breaks as entry confirmation for long/short positions.
📌 3. Breakout Strategy
Break of Monday’s High = bullish breakout → long entry.
Break of Monday’s Low = bearish breakout → short entry.
Place stop-loss inside Monday’s range for a conservative approach.
📌 4. False Breakout Strategy
If price breaks Monday’s high/low but then falls back inside Monday’s range, it is a False Breakout.
Strategy: Trade in the opposite direction.
◽ False Breakout at High → short.
◽ False Breakout at Low → long.
Stop-loss at the wick (extreme point) of the failed breakout.
📌 5. Range-Based Scalping
Use Monday’s high and low as a trading range.
Sell near Monday’s High, buy near Monday’s Low, repeat until breakout occurs.
📌 6. Weekly Volatility Forecast
Narrow Monday range → higher chance of strong trend later in the week.
Wide Monday range → lower volatility expected during the week.
📌 7. Pattern & Trend Analysis within Monday Range
Look for candlestick patterns around Monday’s High/Low/Mid-Line.
◽ Example: Double Top near Monday’s High = short setup.
◽ Repeated bounce at Mid-Line = strong long opportunity.
✅ Summary
The Monday’s Range (Superpowerkyu) Indicator helps traders:
Identify weekly support & resistance
Confirm trend direction with Mid-Line
Trade breakouts & false breakouts
Apply range scalping strategies
Forecast weekly volatility
⚡ Especially, the False Breakout strategy is powerful as it captures failed moves and sudden sentiment reversals.

Objective Doji Highlight (Range-Relative)This indicator highlights Doji candles using an objective, mathematics-based rule: a bar is Doji when the absolute difference between its open and close is less than or equal to a user-defined fraction (x) of that bar’s high–low range.
How it works:
Compute body size as the absolute difference between open and close.
Compute the bar’s range as high minus low.
Classify as Doji when body size ≤ x × range.
Only Doji candles are colored; non-Doji bars remain unchanged.
Inputs
Doji threshold (x of range): tolerance (0–1) controlling how small the body must be relative to the range.
Doji Candle Color: visual color for detected Doji candles.
Example:
If x = 0.10 and a candle has high = 100 and low = 90 (range = 10), the maximum allowed body is 1.
If the difference between open and close is ≤ 1, the candle is marked as Doji.
Why it can be useful
Doji candles are often studied as signs of market indecision. This tool provides a clear, parameter-based way to identify them consistently across any timeframe, without discretionary interpretation.
Notes & limitations
Works with standard candlesticks (not Heikin Ashi, Renko, or other synthetic bar types).
Visualization and research only: it does not produce buy/sell signals and makes no performance claims.
No repainting from future data; the logic uses only the current bar’s prices.

Opening Range BreakoutOpen Range Breakout (ORB) – Trading Strategy Documentation
Definition:
The Open Range Breakout (ORB) is a short-term trading strategy that identifies the price range established during the initial period of market opening (typically the first 15 to 60 minutes) and uses the high and low of that range as key reference levels for potential breakout entries.
Components:
Open Range High: The highest price traded during the defined opening period.
Open Range Low: The lowest price traded during the same period.
Breakout Trigger: A price move above the Open Range High or below the Open Range Low, signaling potential continuation momentum.
How It Works:
Define the Opening Period: Select a time window (e.g., 30 minutes) at market open to establish the initial range.
Identify Range Boundaries: Record the high and low prices during this period.
Monitor for Breakout: Watch for price to break and close above the Open Range High (bullish breakout) or below the Open Range Low (bearish breakout).
Enter Trade: Enter long on a confirmed break above the Open Range High, or short on a break below the Open Range Low. Entry may be triggered on a retest of the broken level or with volume confirmation.
Set Stop-Loss and Target:
Stop-loss: Placed just inside the open range (e.g., below the high for long, above the low for short).
Profit target: Based on volatility (e.g., ATR multiple) or support/resistance levels.
Key Assumptions:
Early price action reflects initial market sentiment.
A breakout from this range indicates strong directional momentum likely to continue.
Best Conditions:
High liquidity markets (e.g., major indices, large-cap stocks).
Volatile or news-driven trading sessions.
Used primarily in intraday trading.
Limitations:
Prone to false breakouts during low-volume or choppy markets.
Requires strict risk management due to reliance on timing and confirmation.
Conclusion:
The ORB strategy capitalizes on early market momentum by trading breakouts from the initial price range. Its effectiveness depends on precise range definition, timely execution, and disciplined risk control.

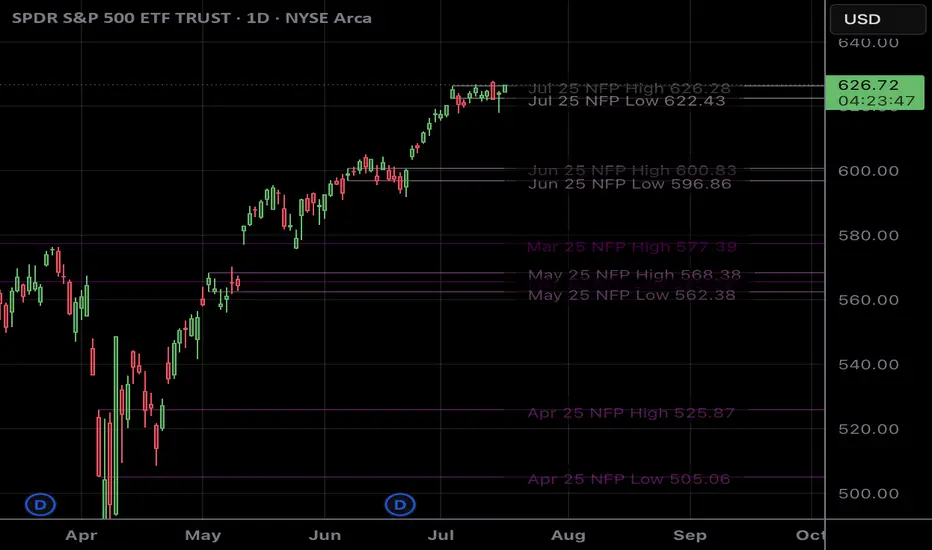
NFP RangesPlots the NFP daily ranges for NFP days. Includes extended hours ranges when the time frame is sub 1D, otherwise, only the daily range is taken.
NFP Dates are pre-populated through 2029 and historically through 2022. Will update script to include farther-out dates before they become necessary.
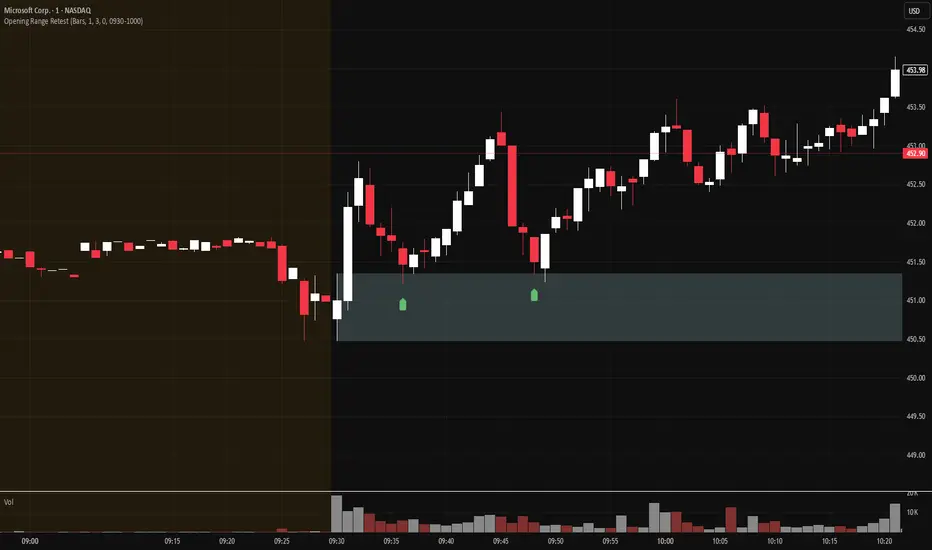
Opening Range Retest█ OVERVIEW
This indicator shows the opening range as a box. It also draws markers and triggers alerts when the opening range is retested. The opening range time is configurable, as is the period of time that must elapse before each return to the opening range is considered a retest.
█ FEATURES
Opening range time configurable in bars or minutes
Configurable "resting" period between the end of the opening range or since the last retest before a new retest is considered valid
Configurable tolerance so that a retest can trigger sooner
Active time range can be used to filter alerts and markers to a specific time window
Visual box showing the opening range, which can be optionally limited to the above-mentioned active time window
Well-documented, high-quality, open-source code for those interested
█ CONCEPTS
This indicator can be used for an opening range retest trading strategy, where long or short positions are taken on the retest of the opening range.
The opening range can be user-configured, so it is suitable for use with any opening range time period (e.g., 1-min, 5-min, 15-min, etc.).
The markers and alerts are equivalent, in the sense that whenever a marker appears, an alert will also trigger (assuming the user has set an alert up).
The alert active time range is simply used as a filter for markers and alerts, meaning that these will not draw or trigger outside of the specified time range.
█ LIMITATIONS
The indicator is intended for equities that have a highly active regular market open. For other security types, it will draw the opening range box from whenever TradingView specifies the market open time.
Open Range Candle [TradeWithRon]This Open Range Break indicator is a tool designed to help traders identify and visualize key price levels using the Opening Range Breakout (ORB) strategy. This indicator dynamically plots critical levels such as the high, low, and middle of a predefined range, along with Fibonacci retracement levels for further analysis. It also features several customization options to fit various trading styles.
Key Features:
Session Setup: Allows the user to set the time offset in GMT - or + to adjust the ORB session to their local time zone.
The default ORB session is set at 9:45 AM but can be adjusted based on user preferences.
Warning: Only supports 5-minute and 15-minute timeframes.
Visual Customization:
Line Styles: Users can choose from Solid, Dotted, or Dashed lines to represent key price levels.
Color Adjustments: Customizable colors for the high, middle, and low levels of the range, as well as Fibonacci levels and vertical lines.
Labeling Options: The labels can be customized in terms of size and color, helping to keep the chart clean and clear.
Fibonacci Retracement Levels: Fibonacci retracement levels are automatically drawn between the high and low of the range. Users can toggle these on or off and customize the offset to suit different trading instruments.
Time-Based Visuals: A vertical line is drawn at the start of the ORB session, providing a clear visual marker of where the breakout starts. This is useful for pinpointing key trade setups.
The indicator supports both 5-minute and 15-minute timeframes.
EMA Integration: The user can enable an Exponential Moving Average (EMA) on any chosen timeframe with adjustable parameters such as the length and color, providing additional trend context.
Dynamic Labeling: The indicator labels the high, middle, and low points of the ORB with custom text. These labels are updated in real-time as new data becomes available.
Limit on Lines and Labels: The indicator allows for a limit on the number of lines and labels drawn to maintain a clean chart, preventing unnecessary clutter as more ORB levels are plotted.
Daily Bias Information: The indicator assesses the daily trend bias (bullish or bearish) based on the relationship between the open and close prices for the last three daily candles, providing context for the current trading session.
Countdown Timer: The remaining time until the end of the current session is displayed in a countdown format, which helps traders to time their entries and exits more precisely.
How To Use:,
- Set the Timeframe to 15 minutes.
- Adjust the Time Zone Offset if needed, based on your local time zone.
- Enable the Show ORB feature for the first 15-minute candle to be drawn as the opening range. - The indicator will automatically mark the high, middle, and low points of the range.
Identify Breakout Points:
Bullish Breakout: If the price breaks above the high of the 15-minute opening range, this indicates a potential bullish breakout. The indicator will plot a vertical line marking the breakout point for further confirmation.
Bearish Breakout: If the price breaks below the low of the 15-minute opening range, this signals a potential bearish breakout. Again, the indicator will plot the breakout point with a vertical line for easy identification.
🔶 Disclaimer
Use with Caution: This indicator is provided for educational and informational purposes only and should not be considered as financial advice. Users should exercise caution and perform their own analysis before making trading decisions based on the indicator's signals.
Not Financial Advice: The information provided by this indicator does not constitute financial advice, and the creator (Tradewithron) shall not be held responsible for any trading losses incurred as a result of using this indicator.
Backtesting Recommended: Traders are encouraged to backtest the indicator thoroughly on historical data before using it in live trading to assess its performance and suitability for their trading strategies.
Risk Management: Trading involves inherent risks, and users should implement proper risk management strategies, including but not limited to stop-loss orders and position sizing, to mitigate potential losses.
No Guarantees: The accuracy and reliability of the indicator's signals cannot be guaranteed, as they are based on historical price data and past performance may not be indicative of future

Morning RangeOverview
The Morning Range Indicator highlights the high and low of the market session from 6 AM to 10AM, providing key levels for potential breakout trades. The box dynamically updates in real-time, extending until 4 PM, and adjusts color based on price action.
This tool is ideal for traders looking to identify breakout opportunities and visualize key intraday price ranges.
How It Works
Session High & Low (6 AM - 10 AM)
The indicator tracks the highest high and lowest low within this time window.
Once 10 AM passes, the high and low are locked in and will not change.
Box Extends Until 4 PM
The session box remains visible throughout the trading day.
It provides a visual reference for potential breakout zones.
Dynamic Box Coloring
Gray (Neutral): Neither high nor low is broken.
Green: Only the high is broken before 4 PM.
Red: Only the low is broken before 4 PM.
Yellow: Both high and low are broken before 4 PM.
Live Updating Box
The box appears as soon as the session begins at 6 AM.
It dynamically updates the high and low until 10 AM.
Alerts for Breakouts
This indicator includes built-in alert conditions, so you can set up TradingView alerts without modifying the script.
Morning Range High Broken → Triggers when price breaks above the morning high.
Morning Range Low Broken → Triggers when price breaks below the morning low.
To set alerts:
Click the Alerts (⏰) icon in TradingView.
Select Condition → "Morning Range High Broken" or "Morning Range Low Broken".
Choose your preferred notification method (popup, email, webhook, etc.).
Click Create to activate the alert.
Who This Is For
✔ Intraday & Scalp Traders – Identify key breakout levels for short-term trades.
✔ Futures & Forex Traders – Works great for markets like NQ, ES, Gold, and FX pairs.
✔ Breakout & Reversal Traders – Use the high/low boundaries as support & resistance levels.
Customization
This indicator automatically updates every day and requires no manual input.
You can change alert settings via TradingView’s built-in alert system.
How to Use This Indicator
Watch for breakouts above/below the morning range as potential trade opportunities.
Combine with volume, momentum indicators, or footprint charts for confirmation.
Use the box color to visually assess whether price action is bullish (green), bearish (red), or ranging (gray).

True Range & ATRDescription : This indicator plots both the True Range (TR) and the Average True Range (ATR) in a separate pane below the main chart.
- TR represents the absolute price movement range within each candle.
- ATR is a smoothed version of TR over a user-defined period (default: 14), providing insight into market volatility.
- TR is displayed as a histogram for a clearer view of individual candle ranges.
- ATR is plotted as a line to show the smoothed trend of volatility.
This indicator helps traders assess market volatility and potential price movements.

Liquitive Buy/Sell Dollar AveragerLiquitive Buy/Sell Dollar Averager Indicator
The "Liquitive Buy/Sell Dollar Averager" is a versatile trading tool designed for intraday and multi-timeframe analysis, combining advanced range-bound calculations, RSI normalization, volume spikes, and candle pattern recognition to identify optimal buy and sell conditions. This indicator is particularly suitable for traders employing strategies that focus on dollar-cost averaging, position scaling, and systematic buy/sell decision-making.
Key Features:
Adaptive RSI-Based Levels:
Dynamically calculates inner bounds (IB) and outer bounds (OB) using RSI and price ranges, helping to identify overbought and oversold conditions relative to the price action.
Normalizes RSI values to the price range for seamless visualization overlaid on the chart.
Volume and Candle Analysis:
Detects significant volume spikes relative to a moving average, signaling increased market activity.
Identifies spiking green/red candles to capture momentum-driven price movements.
Dynamic Support and Resistance:
Calculates and plots support and resistance levels based on recent swing highs and lows.
Median and boundary lines help visualize key price levels for decision-making.
Profitability Check:
Buy and Sell Signals:
Checks profitability thresholds based on percentage gains/losses.
Incorporates logic for "time to buy" and "time to sell" using target profit margins.
Implements average move percentage to define realistic thresholds for buy/sell actions.
Time-Based Trading Restrictions:
Configures trading logic to disallow trades after a specific time (e.g., 3:40 PM for intraday sessions).
Ensures logical entry and exit decisions are only made within active trading hours.
Color-Coded Visualization:
Background colors dynamically shift between green (bullish), red (bearish), and neutral, depending on RSI and price position relative to the inner bounds.
Opacity of the background adjusts based on normalized RSI differences to provide a visual cue of market strength.
Customizable Parameters:
Allows user input for key settings like lookback periods, RSI length, percent ranges, volume thresholds, and transparency levels, enabling flexible configuration tailored to individual strategies.
Actionable Alerts and Signals:
Plots "Open Position", "Add to Position", and "Close Position" markers directly on the chart, making it easy to follow systematic trading rules.
How It Works:
Buy Signals:
Triggered when price conditions, volume spikes, and RSI-based thresholds align with profitability metrics.
Designed for dollar-cost averaging, identifying opportunities to add to long positions or open new positions.
Sell Signals:
Evaluates profitability conditions to identify when to close or scale out of positions.
Incorporates real-time evaluation of market momentum and profitability.

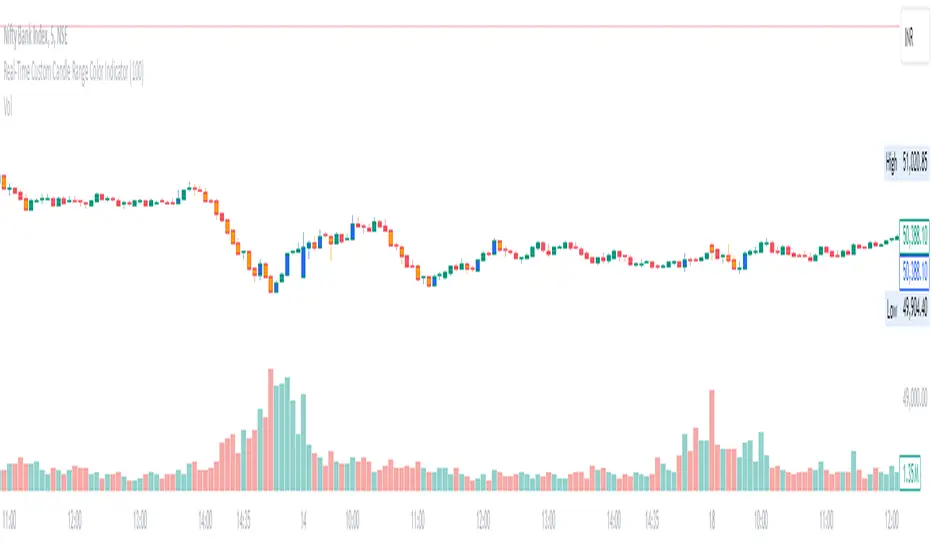
Real-Time Custom Candle Range Color Indicator
The script allows the user to input a custom range value (default set to 100 points) through the userDefinedRange variable. This value determines the minimum range required for a candle to change color.
Calculating Candle Range:
The script calculates the range of each candle by subtracting the low from the high price.
Determining Bullish or Bearish Candles:
It checks whether the close price is higher than the open price to determine if a candle is bullish (isBullish variable).
Coloring Candles:
Based on the custom range input, the script changes the color of the candles:
If the candle's range is greater than or equal to the custom range and it is bullish, the candle color is set to blue (bullishColor).
If the range condition is met and the candle is bearish, the color is set to orange (bearishColor).
If the range condition is not met, the color is set to na (not applicable).
Plotting Colored Candles:
The plotcandle function is used to plot candles with colors based on the custom range and bullish/bearish conditions. The candles will have a higher z-order to be displayed in front of default candles.
Displaying High and Low Price Points:
Triangular shapes are plotted at the high and low price levels using the plotshape function, with colors representing bullish (blue) and bearish (orange) conditions.
In trading, this indicator can help traders visually identify candles that meet a specific range criteria, potentially signaling strength or weakness in price movements. By customizing the range parameter, traders can adapt the indicator to different market conditions and trading strategies. It can be used in conjunction with other technical analysis tools to make informed trading decisions based on candlestick patterns and price movements.
Market Open Range Breakaway v1.2Script Name: Market Open Range Breakaway 1.2
This TradingView script, "Market Open Range Breakaway," highlights the market's opening range for a user-selected day of the week. It calculates the high and low prices during a specified period after the market opens, plots these levels, and tracks the opening price. The script dynamically adjusts for time zones and only displays data during market hours on the chosen day, with optional background shading for the defined range period.
Purpose: Identifies and highlights the market's opening range for a selected day of the week.
Features: Calculates and plots the high, low, and open price during the market's opening range.
Configurable range duration (e.g., 15, 30, or 60 minutes).
Automatically adjusts for different time zones.
Displays levels only during market hours on the target day.
Optional background shading for the opening range.
Inputs: Target day of the week.
Opening range duration.
Use Case: Ideal for traders looking to analyze breakout levels or price movements around the opening range.

Custom Time Range HighlighterCustom Time Range Highlighter
This versatile indicator allows traders to highlight specific time ranges on their charts, accommodating users worldwide by supporting customizable UTC offsets. Traders can define two distinct time ranges, setting start and end hours in their local time zone.
A toggle option enables the display of highlights for today only , ensuring focus on current trading conditions.
Ideal for day traders and those following specific market sessions, this tool enhances visibility of active trading periods and aids in effective trade management.

Austin's Range Filter with Trade SignalsAustin’s Range Filter with Trade Signals
Description:
Austin’s Range Filter with Trade Signals is a versatile indicator that combines a custom range filter with dynamic buy and sell signals based on EMA crossovers. This indicator is designed to help traders easily identify trend reversals and optimal trade entry/exit points.
Key Features:
• Range Filter Calculation: The indicator calculates the highest and lowest price over a user-defined period, then multiplies the difference by a customizable multiplier to establish a dynamic range. A combined middle band (average of the upper and lower bounds) is plotted for a clearer visual representation of the price trend.
• Exponential Moving Average (EMA): A user-configurable EMA is added, which acts as the primary signal line. You can adjust the length of the EMA to suit your trading style.
• Buy and Sell Signals:
• Buy Signal: Triggered when the price crosses above the EMA, indicating a potential upward trend.
• Sell Signal: Triggered when the price crosses below the EMA, indicating a potential downward trend.
• Alerts: Custom alert conditions for buy and sell signals allow you to set up real-time notifications when the signal changes, so you never miss an opportunity.
• Customizable Display: You can toggle the visibility of the combined band (purple) and the EMA (blue) for a cleaner chart.
How It Works:
• Buy when the price crosses above the EMA.
• Sell when the price crosses below the EMA.
• Background colors indicate whether the current price is above or below the calculated range, helping you visually identify bullish and bearish conditions.
Customization Options:
• Range Filter Length: The lookback period for the highest/lowest price calculation.
• Range Multiplier: Adjusts the size of the range.
• EMA Length: Set the length of the EMA to fine-tune the signal sensitivity.
• Toggle Lines: Show or hide the combined band and EMA for more flexibility.
This indicator is suitable for a variety of markets including stocks, forex, and crypto, and can be applied to any timeframe. Use it as part of your technical analysis to spot market trends and improve your decision-making process.
How to Use:
1. Apply the indicator to your chart and adjust the settings to suit your strategy.
2. Set up alerts for buy and sell signals to receive real-time notifications.
3. Monitor the price relative to the range and EMA to better time your trades.
This indicator is perfect for traders looking for an intuitive yet powerful tool to enhance their trading strategies with automatic signals and alerts.

Consolidation & Head and Shoulders ScannerHello Traders!
The Consolidation & Head and Shoulders Scanner utilizes a unique swing-based pattern recognition to pinpoint consolidation and (inverse) head and shoulders patterns in real-time with unparalleled precision.
The rectangle pattern, also known as a trading range or a consolidation pattern, is characterized by horizontal lines that act as support and resistance levels, creating a rectangular shape.
The head and shoulders chart pattern is a technical analysis pattern used to identify potential trend reversals in financial markets. It consists of three swing highs (peaks), with the middle peak being the highest and the two outside swing highs being slightly lower. The middle peak is referred to as the "head" and the two outside peaks are referred to as the "shoulders."
The pattern typically forms after an uptrend and is in most cases a bearish signal. The neckline is a support level that connects the lows of the two shoulders. Once the price breaks below the neckline, the pattern is confirmed, and a new down trend starts. Conversely, an "inverse head and shoulders" pattern forms after a downtrend and is a bullish signal.
The Consolidation & Head and Shoulders Scanner is designed to operate in a fully automated manner, detecting consolidation patterns, head and shoulders patterns and inverse head and shoulders patterns across the symbol and timeframe that you select. It grants you the ability to simultaneously scan for patterns across as many as 20 distinct symbols.
Feature List
Real-time consolidation and (inverse) head and shoulders pattern detection
Breakout alerts
Customizable pattern size and accuracy
Customizable look and feel
The value of this indicator is to support traders to easily identify consolidations and (inverse) head and shoulders patterns in an automated way and across many different markets at the same time. The special swing-based pattern recognition makes this indicator unique. The trader saves a lot of time scanning the markets for consolidation and head and shoulders patterns, since finding the pattern and alerting for a breakout is done automatically for the trader.
For a visualization of the detected patterns, you can add the TRN Consolidation and Range Pattern and the TRN Head and Shoulders Pattern indicators to your chart.
How does Consolidation & Head and Shoulders Scanner work?
On the right side of the chart, you can find a table displaying the symbols monitored by our scanner for pattern and breakout detection (first column). The table provides information on the status of each symbol.
ACTIVE – Pattern building up
UP – Upside Breakout
DN – Downside Breakout
UP CONF – Upside Breakout confirmed
DN CONF – Downside Breakout confirmed
FAILED – Pattern failed to get confirmed
This visual representation allows you to quickly identify the evolving pattern dynamics across different symbols, helping you stay informed and make timely trading decisions.
In the second and fifth column, the status of consolidation patterns with two different consolidation sizes gets displayed. In the third and fourth column, the status of detected long and short head and shoulders patterns is displayed. The same goes for column seven and eight but with a different head and shoulders size which is customizable in the settings.
The scanner operates specifically on the timeframe you have selected in TradingView, ensuring that the detected patterns and breakouts align precisely with your trading perspective. F If the scanner displays a pattern or a breakout, you just can switch to this instrument and start trading it if you like what you see.
Follow these instructions to discover how you can utilize the scanner for seamless and simplified chart pattern detection like never before:
Add Symbols
Go to indicator settings and scroll down to the "Symbols" section. The enabled symbols can be recognized by the check marks. Click on one of them and use the search function to add the symbol of your choice to the scanner. You can search for up to 20 different Symbols at the same time.
Use Alerts (optional but recommended)
You can also use the built-in alerts to easily get notified when a pattern occurs. In the indicator settings in the "Alerts" section you can choose whether you want to get notified when a pattern is
in the making (Pattern active),
confirms an up breakout (B/O Up Confirmed)
confirms a down breakout (B/O Down Confirmed)
(Unconfirmed) in case a pattern breakout occurs, even if the pattern is not yet confirmed
This allows you to stay informed about potential breakout opportunities that are still awaiting confirmation.
Customization and Settings
The indicator can scan for smaller and larger patterns at the same time. Adjust the consolidation and head and shoulders sizes in the indicator settings to align them with your preferences. A larger size results in larger patterns. Depending on the asset class, the market or the market phase, different sizes can be used for pattern detection.
To detect more patterns, increase the tolerance level, even though it may result in lower accuracy. However, be mindful that a higher tolerance level may result in more patterns hitting their stop-loss.
Risk Disclaimer
The content, tools, scripts, articles, and educational resources offered by TRN Trading are intended solely for informational and educational purposes. Remember, past performance does not ensure future outcomes.

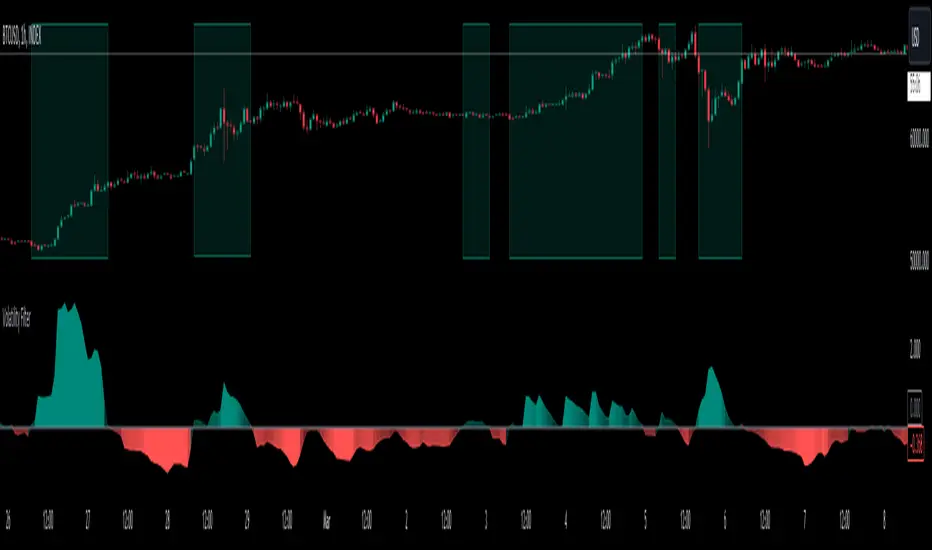
Volatility Filter v2VF v2 is a new iteration of my tool designed for traders who wish to gain a deeper understanding of market dynamics, specifically to distinguish periods of high volatility, which often correspond to strong market trends. By identifying these periods, traders can make more informed decisions, potentially leading to better trading outcomes.
Understanding Market Volatility:
At the heart of this script lies the concept of market volatility, a statistical measure reflecting the degree of variation in trading prices. Volatility is pivotal for traders; it provides insights into the market's emotional state, indicating periods of uncertainty or confidence. High volatility often correlates with strong trends, making it a critical indicator for trend-followers. By identifying when volatility crosses a certain threshold, traders can discern whether the market is likely to be in a trending phase or a more subdued, range-bound state.
How the Script Works:
The core functionality of the script revolves around a signal line that oscillates around a zero threshold. When the signal line is above zero, it indicates increased market volatility, suggesting the presence of a trend. The farther the oscillator deviates from zero, the stronger the implied trend. This mechanism enables traders to visually gauge market conditions and adjust their strategies accordingly.
Controlling the Indicator:
To cater to diverse trading styles and preferences, the script is equipped with several customizable settings:
Filter Threshold: This 'zero line' acts as the baseline for distinguishing between different volatility regimes. Crossing this threshold is a primary signal for changes in market volatility.
Moving Average Type: With over 30 types of moving averages to choose from, traders can select the one that best fits their analysis style. Each type offers a different perspective on price data, allowing for a tailored approach to trend identification.
Colorize Indicator: This feature enhances the visual representation of the indicator, making it easier to interpret. When enabled, the oscillator's color intensity varies with its proximity to the extremes, providing a quick visual cue about trend strength.
Advanced Settings – Length and Multiplier:
The script introduces an innovative approach to time frame analysis through its length and multiplier settings:
Length: This parameter sets the base period for all metrics within the script, similar to traditional indicators.
Multiplier: This unique feature differentiates the script by incorporating three distinct timeframes into the analysis: a lower timeframe, the main (current) timeframe, and a higher timeframe. The multiplier adjusts these timeframes relative to the main one. For instance, with a daily main timeframe and a multiplier of 2, the lower timeframe would be 12 hours, and the higher timeframe would be 2 days. This tri-timeframe approach aims to provide a more comprehensive volatility assessment.
Volatility Filter Indicators Section:
The script utilizes nine different, undisclosed metrics within its volatility filter. Traders have the flexibility to enable or disable these metrics based on their preferences, allowing for a customizable trading experience. Additionally, the script offers alert functionality for when the indicator crosses the threshold, either upwards or downwards, facilitating timely decision-making.
P.S
With better understanding of markets over time, I designed a new iteration of my volatility filter indicator. The second version provides faster, more precise way to analyze markets, but I also wanted to keep my first version untouched in case if some people find it better for their purposes. As I mentioned above, this version is calculated in a very different way from a previous one, so if you never tried it you can do it here