Wick Reversal Hi the given strategy is based on detecting hammer and shooting star patterns to trade early reversals. Chiến lược Pine Script®của OHM_INSTITUTIONAL_BROKING76
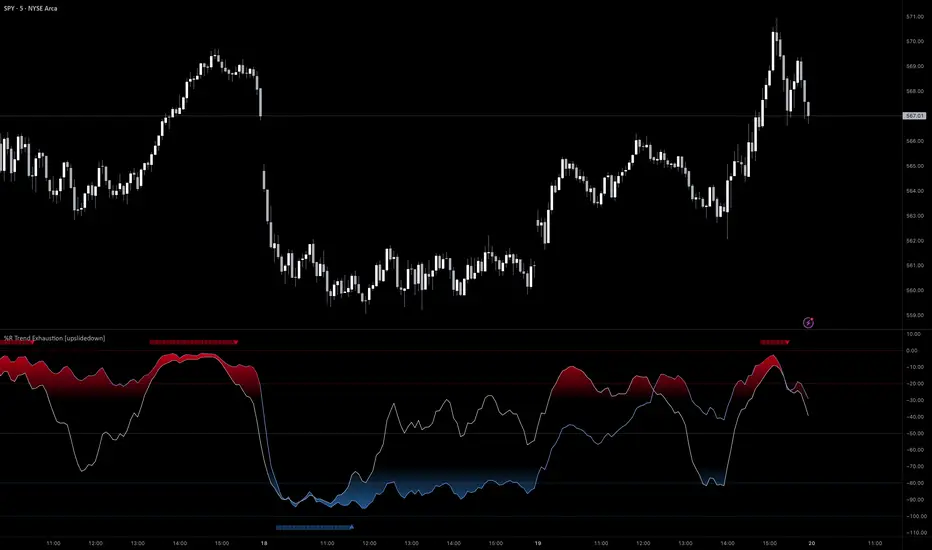
%R Trend Exhaustion [upslidedown]I love Williams %R! This indicator mixes two %R periods... a standard %R with a longer period %R. The longer period of 112 has interesting results for trend following strategies in the crypto market through backtesting. Alone these are fairly ordinary but together they provide a very interesting trend exhaustion/reversal system while filtering out some noise. I have highlighted key areas of interest with filled boxes. An "area of interest" is when there is confluence between the short and long period %R values along with being overbought or oversold. Once there is a break in the overbought or oversold trend, an arrow will print. This is one of my odder ideas that appears to have some merit and detects interesting tops or bottoms (or confirms a trend reversal) so I'm publicly publishing for the community to find. If you find this useful please reach out and let me know how you use it as it's fairly unique... and thus different than anything I've ever seen or used.Chỉ báo Pine Script®của upslidedownCập nhật 7171 5.2 K
Elder's Force Index Color BarBased on the Elder's Force Index (EFI) , +/- of the EFI and its ema is used to describe the rise, fall or possible reversal of the market, and finally shown by bar color. The green bar represents a strong bull and the red bar represents a strong bear; The blue bar indicates that the downtrend is exhausted and may rise. Likewise the yellow bar. Of course, it is difficult to buy the bottom and sell the top at any time. This indicator needs to be judged together with the pattern or other indicators that predict reversals in order to increase the win rate. Happy Trading. 根据Elder's Force Index修改而成,取消了幅图指标,仅用bar color来表现上涨,下跌和转折。 绿色k线代表上涨动能充足,红色k线表示下跌动能充足; 蓝色k线表示下跌力竭,可能会上涨; 黄色k线表示上涨力竭,可能会下跌。 当然,任何时候抄底摸顶都是困难的,该指标需要和形态或者其他预测反转的指标一起判断才能增加成功率。 祝交易愉快。 緑は上昇トレンドで、赤は下落トレンドです; 青は下落が尽きて上昇する可能性があることを示すことで、黄色は上昇が終わり、下落の可能性があることを示しています。 成功率を高めるためには、パターンや反転を予測する他の指標と合わせて判断する必要があります。 Happy Trading。Chỉ báo Pine Script®của salted-fish22129
Volume Pressure AnalysisVolume Pressure Analysis is a new concept I have been working on designed to show the effort required to move price. An ideal tool for confirming trends or locating reversals early. This indicator can highlight whale action and market manipulation. It calculates volume vs volatility and displays the results as a meter: Above 0 shows how easy price action is traveling, the bigger these bars the less volume and effort is required to push price. These are indicated with a teal or red arrows and can confirm the beginning or continuation of a trend. This is the natural direction the chart wants to travel at that time. Below 0 shows how hard price is to move. The bigger these bars the more volume and effort is required to push price. When whales and market makers push price against its will these bars will get bigger. Yellow arrows signal pressure in that direction and excessive amounts of volume is required to move price. These signals can lead to reversal/ pivot points as price action struggles to continue its trend. These signals can be turned on in settings or use the overlay version of this script to display signals on chart. This is a very powerful tool when used with relative volume. Chỉ báo Pine Script®của veryfidCập nhật 130130 3.4 K
Center Of Gravity OscillatorThe COG Oscillator (center of gravity) is an indicator based on statistics and the Fibonacci golden ratio. It uses ALMA as a trigger and LSMA as "zero line". The trigger is set tight by default but can be tweaked by adjusting the window size and sigma in settings. This is a great indicator for setting up trades and spotting reversals. There are 2 main strategies that come with this indicator: Strategy 1: Long positions are entered when current low point is higher than previous low. Short positions are entered as current high is lower than previous high. (Shown in image above) Strategy 2 : If market is bullish long trades are entered as COG line crosses over red LSMA line. Traders have the option of scalping the first crossover or even scaling out of trade to close on second exit. This works the opposite for shorts when market is bearish. Above shows different configurations of the indicator. Top shows length of 50, Middle has length of 21 and bottom is default 9. Chỉ báo Pine Script®của veryfidCập nhật 4949 1.5 K
Volatility OscillatorThis tool displays relative volatility and directional trend. Excellent way to pickup diversions and reversals. Length can be lowered to 11 or 13 in settings to show price range. Can be used to identify patterns such as parallel channels and likely direction of price action as pictured below. Chỉ báo Pine Script®của veryfid3131 1.7 K
Turbulence reversalGiven that the market turbulence tends to cluster, I developed a turbulence moving average system to reveal the unseen underlying structure of the least resistance path for trend following. Here, I used an SMA subset from the turbulence moving average system to determine the trend direction. This estimation is achieved by calculating the dynamic changes of SMA slope angle and distance between SMA. The former represents a possible reversal signal, and the latter shows the resistance from the intermediate-term SMA. When the short-term slope angle crossovers the intermediate-term slope angle, the indicator will give a star sign, indicating a possible trend reversal. Use this indicator together with the turbulence moving average system (Turbulence with direction). Chỉ báo Pine Script®của lockeyjCập nhật 11349
Market direction and pullback based on S&P 500.A simple indicator based on www.swing-trade-stocks.com The link is also the guide for how to use it. 0 - nothing. If the indicator is showing 0 for a prolonged amount of time, it is likely the market is in "momentum mode" (referred to in the link above). 1 - indicates an uptrend based on SMA and EMA and also a place where a reversal to the upside is likely to occur. You should look only for long trades in the stock market when you see a spike upwards and S&P 500 is showing an obvious uptrend. -1 - indicates a downtrend based on SMA and EMA and also a place where a reversal to the downside is likely to occur. You should look only for short trades in the stock market when you see a spike upwards and S&P 500 is showing an obvious uptrend.Chỉ báo Pine Script®của Hagvan1171
CMYK VRMI RAYS ◊ Introduction Introducing VRMI in this script, an RMI based on price movement and volume, to indicate bullish and bearish trends. This script marks the background depending on RMI <> VRMI , VRMI polarity and large buy/sell sprees. ◊ Origin Based on 'The Relative Momentum Index' by Roger Altman : February, 1993 issue of Technical Analysis of Stocks & Commodities magazine. While RSI counts up and down days from close to close, the Relative Momentum Index counts up and down days from the close relative to a close x number of days ago. This results in an RSI that is smoother. In addition VRMI reacts quick, it is used to cut off latency from RMI, and it's polarity indicates the beginning and end of a trend. Large buy sell sprees and detected in their proportion with an sma on the volume ◊ Adjustments CMYK color theme applied. ◊ Usage This indicator can be used to detect trends and mark reversals. ◊ Prospects ◊ ◊ ◊ ◊ ◊ ◊ ◊ ◊ ◊ ◊ ◊ ◊ ◊ ◊ ◊ ◊ ◊ ◊ ◊ ◊ ◊ ◊ ◊ ◊ ◊ ◊ ◊ ◊ ◊ ◊ ◊ ◊ ◊ ◊ ◊ ◊ ◊ ◊ ◊ ◊ ◊ ◊ ◊ ◊ ◊ ◊ ◊ ◊ ◊ ◊ ◊ ◊ ◊ ◊ ◊ ◊ ◊ ◊ ◊ ◊ ◊ ◊ ◊ ◊ ◊ ◊ ◊ ◊ ◊ ◊ ◊ ◊ ◊ ◊ ◊ ◊ ◊ ◊ ◊ ◊ ◊ ◊ ◊ ◊ ◊ ◊ ◊ ◊ ◊ ◊ ◊ ◊ ◊ ◊ ◊ ◊ ◊ ◊ ◊ ◊ ◊ ◊ ◊ ◊ ◊ ◊ Chỉ báo Pine Script®của MVPMCCập nhật 75
CODY BOT REVERSALFree Telegram Trading Community t.me What Is CODY BOT? CODY BOT is an easy-to-use trading tool that spots potential price reversals on your chart. It shows arrows when it detects certain candlestick patterns that often happen before the market changes direction. How It Works Green "Buy" Arrow Appears When: Current candle closes higher than yesterday's open Yesterday's candle closed lower than its own open This pattern often signals a possible upward move coming Red "Sell" Arrow Appears When: Current candle closes lower than yesterday's open Yesterday's candle closed higher than its own open This pattern often signals a possible downward move coming What You'll See on Your Chart Green up arrows below candles (buy signals) Red down arrows above candles (sell signals) You'll also get alerts if you set them up Best Ways to Use It Good For: Day trading (5-minute to 1-hour charts) Swing trading (4-hour to daily charts) All markets: stocks, forex, crypto Spotting quick trend changes Tips for Better Results: Wait for the candle to close before trading Use with support/resistance lines for confirmation Add volume to check if others are trading too Start with paper trading to practice Always use stop-loss to protect yourself What Makes It Special No lag - signals appear immediately Easy to understand - just follow the arrows Works on any timeframe Free to use No complicated settings Quick Start Guide Add CODY BOT to your TradingView chart Watch for green/red arrows at candle close Click the alert bell if you want notifications Test with fake money first Combine with what you already know about trading Remember: No indicator is perfect. Use CODY BOT as one tool in your toolbox, not the only tool. Always manage your risk and never trade more than you can afford to lose. Perfect for: Traders who like simple, clear signals without complicated math.Chỉ báo Pine Script®của tonewayclothing160
RSI Exhaustion Gate (Visual Flip)An RSI-based indicator that highlights potential overbought and oversold exhaustion points with visual dots. Provides clear signals when RSI reaches extreme levels and flips, helping traders identify short-term reversal opportunities. Includes customizable colors, RSI levels, and alerts for both long and short exhaustion triggers. Detailed Description (for Publishing): RSI Exhaustion Gate (Visual Flip) is designed to help traders identify potential overbought and oversold exhaustion levels on any timeframe. Key Features: Plots RSI with standard overbought (70) and oversold (30) levels. Visually flipped exhaustion dots appear when RSI crosses into extreme zones and reverses, signaling potential trade entries. Customizable colors for overbought and oversold dots. Option to toggle visibility of RSI levels and dots. Alerts for both long and short exhaustion points, so you can set TradingView notifications. Works on any chart timeframe. This tool is intended as a visual guide for spotting RSI-based exhaustion signals and can be used in conjunction with your trading strategy for improved timing and clarity.Chỉ báo Pine Script®của Nhmoore20103
StO Price Action - Daily Outside BarShort Summary - Outside Bar indicator with multiple range calculation algorithms - Highlights where the current range fully engulfs the previous - Works with Daily candles in Daily, H4, and H1 timeframes only - Highlights the current bar when it engulfs the previous bar according to the selected method Full Description Overview - Identifies bars where the current period's range fully engulfs the prior period's range - Offers three algorithms for defining the engulfing range: - High/Low: uses absolute high and low values - Open/Close: considers candle direction (bull/bear) and compares opens and closes - Open/Close II: stricter version with exclusive inequalities for engulfing - Engulfing behavior is detected automatically and highlighted for easy recognition - Works on multiple markets but restricted to D, H4, and H1 charts for accuracy Controls - Year lookback (YLB) configurable to filter older bars - Custom background color for highlighting Outside Bars - Simple toggle interface with minimal chart clutter Visual Representation - Highlights engulfing bars with configurable background color - Color transparency adjustable for clarity Usage - Use to identify strong market momentum or potential reversals - Helps spot high-probability setups based on engulfing price action Notes - Only compatible with Daily, H4, and H1 timeframes - Non-repainting: once an Outside Bar is drawn, it will not adjust retroactively - Best used as a market structure reference not a direct trade signalChỉ báo Pine Script®của sto_svcCập nhật 13
Hurst-Optimized Adaptive Channel [Kodexius]Hurst-Optimized Adaptive Channel (HOAC) is a regime-aware channel indicator that continuously adapts its centerline and volatility bands based on the market’s current behavior. Instead of using a single fixed channel model, HOAC evaluates whether price action is behaving more like a trend-following environment or a mean-reverting environment, then automatically selects the most suitable channel structure. At the core of the engine is a robust Hurst Exponent estimation using R/S (Rescaled Range) analysis. The Hurst value is smoothed and compared against user-defined thresholds to classify the market regime. In trending regimes, the script emphasizes stability by favoring a slower, smoother channel when it proves more accurate over time. In mean-reversion regimes, it deliberately prioritizes a faster model to react sooner to reversion opportunities, similar in spirit to how traders use Bollinger-style behavior. The result is a clean, professional adaptive channel with inner and outer bands, dynamic gradient fills, and an optional mean-reversion signal layer. A minimalist dashboard summarizes the detected regime, the current Hurst reading, and which internal model is currently preferred. 🔹 Features 🔸 Robust Regime Detection via Hurst Exponent (R/S Analysis) HOAC uses a robust Hurst Exponent estimate derived from log returns and Rescaled Range analysis. The Hurst value acts as a behavioral filter: - H > Trend Start threshold suggests trend persistence and directional continuation. - H < Mean Reversion threshold suggests anti-persistence and a higher likelihood of reverting toward a central value. Values between thresholds are treated as Neutral, allowing the channel to remain adaptive without forcing a hard bias. This regime framework is designed to make the channel selection context-aware rather than purely reactive to recent volatility. 🔸 Dual Channel Engine (Fast vs Slow Models) Instead of relying on one fixed channel, HOAC computes two independent channel candidates: Fast model: shorter WMA basis and standard deviation window, intended to respond quickly and fit more reactive environments. Slow model: longer WMA basis and standard deviation window, intended to reduce noise and better represent sustained directional flow. Each model produces: - A midline (basis) - Outer bands (wider deviation) - Inner bands (tighter deviation) This structure gives you a clear core zone and an outer envelope that better represents volatility expansion. 🔸 Rolling Optimization Memory (Model Selection by Error) HOAC includes an internal optimization layer that continuously measures how well each model fits current price action. On every bar, each model’s absolute deviation from the basis is recorded into a rolling memory window. The script then compares total accumulated error between fast and slow models and prefers the one with lower recent error. This approach does not attempt curve fitting on multiple parameters. It focuses on a simple, interpretable metric: “Which model has tracked price more accurately over the last X bars?” Additionally: If the regime is Mean Reversion, the script explicitly prioritizes the fast model, ensuring responsiveness when reversals matter most. 🔸 Optional Output Smoothing (User-Selectable) The final selected channel can be smoothed using your choice of: - SMA - EMA - HMA - RMA This affects the plotted midline and all band outputs, allowing you to tune visual stability and responsiveness without changing the underlying decision engine. 🔸 Premium Visualization Layer (Inner Core + Outer Fade) HOAC uses a layered band design: - Inner bands define the core equilibrium zone around the midline. - Outer bands define an extended volatility envelope for extremes. Gradient fills and line styling help separate the core from the extremes while staying visually clean. The midline includes a subtle glow effect for clarity. 🔸 Adaptive Bar Tinting Strength (Regime Intensity) Bar coloring dynamically adjusts transparency based on how far the Hurst value is from 0.5. When market behavior is more decisively trending or mean-reverting, the tint becomes more pronounced. When behavior is closer to random, the tint becomes more subtle. 🔸 Mean-Reversion Signal Layer Mean-reversion signals are enabled when the environment is not classified as Trending: - Buy when price crosses back above the lower outer band - Sell when price crosses back below the upper outer band This is intentionally a “return to channel” logic rather than a breakout logic, aligning signals with mean-reversion behavior and avoiding signals in strongly trending regimes by default. 🔸 Minimalist Dashboard (HUD) A compact table displays: - Current regime classification - Smoothed Hurst value - Which model is currently preferred (Fast or Slow) - Trend flow direction (based on midline slope) 🔹 Calculations 1) Robust Hurst Exponent (R/S Analysis) The script estimates Hurst using a Rescaled Range approach on log returns. It builds a returns array, computes mean, cumulative deviation range (R), standard deviation (S), then converts RS into a Hurst exponent. calc_robust_hurst(int length) => float r = math.log(close / close ) float returns = array.new_float(length) for i = 0 to length - 1 array.set(returns, i, r ) float mean = array.avg(returns) float cumDev = 0.0 float maxCD = -1.0e10 float minCD = 1.0e10 float sumSqDiff = 0.0 for i = 0 to length - 1 float val = array.get(returns, i) sumSqDiff += math.pow(val - mean, 2) cumDev += (val - mean) if cumDev > maxCD maxCD := cumDev if cumDev < minCD minCD := cumDev float R = maxCD - minCD float S = math.sqrt(sumSqDiff / length) float RS = (S == 0) ? 0.0 : (R / S) float hurst = (RS > 0) ? (math.log10(RS) / math.log10(length)) : 0.5 hurst This design avoids simplistic proxies and attempts to reflect persistence (trend tendency) vs anti-persistence (mean reversion tendency) from the underlying return structure. 2) Hurst Smoothing Raw Hurst values can be noisy, so the script applies EMA smoothing before regime decisions. float rawHurst = calc_robust_hurst(i_hurstLen) float hVal = ta.ema(rawHurst, i_smoothHurst) This stabilized hVal is the value used across regime classification, dynamic visuals, and the HUD display. 3) Regime Classification The smoothed Hurst reading is compared to user thresholds to label the environment. string regime = "NEUTRAL" if hVal > i_trendZone regime := "TRENDING" else if hVal < i_chopZone regime := "MEAN REV" Higher Hurst implies more persistence, so the indicator treats it as a trend environment. Lower Hurst implies more mean-reverting behavior, so the indicator enables MR logic and emphasizes faster adaptation. 4) Dual Channel Models (Fast and Slow) HOAC computes two candidate channel structures in parallel. Each model is a WMA basis with volatility envelopes derived from standard deviation. Inner and outer bands are created using different multipliers. Fast model (more reactive): float fastBasis = ta.wma(close, 20) float fastDev = ta.stdev(close, 20) ChannelObj fastM = ChannelObj.new(fastBasis, fastBasis + fastDev * 2.0, fastBasis - fastDev * 2.0, fastBasis + fastDev * 1.0, fastBasis - fastDev * 1.0, math.abs(close - fastBasis)) Slow model (more stable): float slowBasis = ta.wma(close, 50) float slowDev = ta.stdev(close, 50) ChannelObj slowM = ChannelObj.new(slowBasis, slowBasis + slowDev * 2.5, slowBasis - slowDev * 2.5, slowBasis + slowDev * 1.25, slowBasis - slowDev * 1.25, math.abs(close - slowBasis)) Both models store their structure in a ChannelObj type, including the instantaneous tracking error (abs(close - basis)). 5) Rolling Error Memory and Model Preference To decide which model fits current conditions better, the script stores recent errors into rolling arrays and compares cumulative error totals. var float errFast = array.new_float() var float errSlow = array.new_float() update_error(float errArr, float error, int maxLen) => errArr.unshift(error) if errArr.size() > maxLen errArr.pop() Each bar updates both error histories and computes which model has lower recent accumulated error. update_error(errFast, fastM.error, i_optLookback) update_error(errSlow, slowM.error, i_optLookback) bool preferFast = errFast.sum() < errSlow.sum() This is an interpretable optimization approach: it does not attempt to brute-force parameters, it simply prefers the model that has tracked price more closely over the last i_optLookback bars. 6) Winner Selection Logic (Regime-Aware Hybrid) The final model selection uses both regime and rolling error performance. ChannelObj winner = regime == "MEAN REV" ? fastM : (preferFast ? fastM : slowM) rawMid := winner.mid rawUp := winner.upper rawDn := winner.lower rawUpInner := winner.upper_inner rawDnInner := winner.lower_inner In Mean Reversion, the script forces the fast model to ensure responsiveness. Otherwise, it selects the lowest-error model between fast and slow. 7) Optional Output Smoothing After the winner is selected, the script optionally smooths the final channel outputs using the chosen moving average type. smooth(float src, string type, int len) => switch type "SMA" => ta.sma(src, len) "EMA" => ta.ema(src, len) "HMA" => ta.hma(src, len) "RMA" => ta.rma(src, len) => src float finalMid = i_enableSmooth ? smooth(rawMid, i_smoothType, i_smoothLen) : rawMid float finalUp = i_enableSmooth ? smooth(rawUp, i_smoothType, i_smoothLen) : rawUp float finalDn = i_enableSmooth ? smooth(rawDn, i_smoothType, i_smoothLen) : rawDn float finalUpInner = i_enableSmooth ? smooth(rawUpInner, i_smoothType, i_smoothLen) : rawUpInner float finalDnInner = i_enableSmooth ? smooth(rawDnInner, i_smoothType, i_smoothLen) : rawDnInner This preserves decision integrity since smoothing happens after model selection, not before. 8) Dynamic Visual Intensity From Hurst Transparency is derived from the distance of hVal to 0.5, so stronger behavioral regimes appear with clearer tints. int dynTrans = int(math.max(20, math.min(80, 100 - (math.abs(hVal - 0.5) * 200)))) Chỉ báo Pine Script®của UnknownUnicorn113699460Cập nhật 317
Box TheoryBox Theory – Description This indicator is based on the popular “Box Theory” concept, where the previous session’s High–Low range acts as the most important structure for the next session. Traders use this because the market often reacts to the same areas where liquidity, orders, and imbalances were created in the prior session. At every new session open, the indicator automatically records: Previous High Previous Low Middle (50% level) These three levels form a box, which becomes your roadmap for the new session. This method is widely used because it highlights where most reversals, sweeps, and reactions occur—without needing any extra indicators. How the Zones Are Calculated Previous High The highest price of the last session. This forms the top edge, which acts as resistance and the basis for the Sell Zone. Previous Low The lowest price of the last session. This forms the bottom edge, acting as support and the basis for the Buy Zone. Middle Line (50% Level) The exact midpoint between High and Low. This is the fair-value zone, where price often consolidates and becomes directionless. No signals are triggered near the middle, because trades taken here historically have low accuracy. Buy Zone (Green Area) The lower part of the box. Price often reacts here because this area held buyers in the previous session. When price enters this green zone inside the box, the indicator can show a Buy Zone label. Sell Zone (Red Area) The upper part of the box. Price commonly rejects here because this area acted as resistance previously. When price enters this red zone inside the box, the indicator can show a Sell Zone label. How Zone Size Is Set (Sensitivity %) You can adjust how big the Buy/Sell zones are using the Sensitivity (%) input. Lower % → Smaller zones → More precise signals Higher % → Larger zones → Signals appear earlier and from farther away Formula: Zone Size = (Previous High − Previous Low) × (Sensitivity % ÷ 100) This lets you customize how tight or how early your signals appear. Inside-Box Only Logic The indicator only works inside the previous session’s range. If price breaks above the previous High → No sell signal If price breaks below the previous Low → No buy signal This avoids false signals during breakouts or trending markets. Alerts The indicator includes two alerts: Buy Zone Alert → Triggers when price enters the Buy Zone Sell Zone Alert → Triggers when price enters the Sell Zone Just enable them in TradingView’s alert panel.Chỉ báo Pine Script®của ebecihalilCập nhật 22263
Continuation / Reversal Sweep (WMA trend)marks hh ll reversals continuiation htf analyisis to enter in ltf Chỉ báo Pine Script®của LGtz21
Pin Bar Fib Pullback + Engulfing + Pin Reversal (21 EMA + VWAP)Dear Traders Pin bar fib pullback continuation (in 0.50–0.618 zone) Bullish/Bearish engulfing Pin bar reversals (bottom/top) Then we ask: did the next candle move at least atrMult × ATR away from the signal close in the right direction? For a long signal: next high ≥ signal close + ATR * atrMult For a short signal: next low ≤ signal close − ATR * atrMult If yes, that signal gets a big circle with text: BIG ▲ for long BIG ▼ for short drawn on the original signal bar (using offset = -1 trick). You can tune how “big” you want: Increase ATR length for smoother ATR Increase ATR * (e.g., from 1.5 → 2.0) to only mark really strong moves.Chỉ báo Pine Script®của RAMESHRAJU8362
BTC BRD – Bullet-Proof Reversal DetectorThis indicator identifies true market reversals by analyzing raw price structure instead of traditional lagging indicators. It tracks how Bitcoin (and any crypto asset) naturally shifts direction by detecting confirmed swing points, followed by a structural break in the opposite direction. A bullish signal appears when price forms a higher low and then breaks above the previous structural high; a bearish signal forms when price creates a lower high followed by a break below the previous structural low. Because it uses pure market structure, every signal reflects an actual change in trend direction, not a temporary pullback or indicator noise. This makes the tool highly reliable across all timeframes — from 1 minute scalping to multi-hour swing setups. The result is a clean, noise-free view of where the market truly reverses, giving traders clear confirmation points to plan entries, exits, or risk management.Chỉ báo Pine Script®của neverstop_dd112
ORB Breakout Strategy with reversalORB 1,5,15,30,60min with reversals, its my first strategy Im not 100% sure it works well. Im not a programmer nor a profitable trader. Max stoploss in points sets maximum fixed stoploss Stop offset sets additional points below/above signal bar RR Ratio is pretty self explanatory, it sets target based on stoploss American session is time when positions can be opened ORB SessionIs basically almost the same but when the time runs it closes all positions\ ORB candle timeframe is the time which orb is measured Enable reverse position enables reversing positions on stoploss of first position, stoploss of reverse position is based on max stoploss and target is set by RR times max stoploss Im sharing this to share this with my friends, discuss some things and dont have to test it manually. I made it all myself and with help of AI Sorry for bad englishChiến lược Pine Script®của Ciuchers102
Momentum Reversal StrategyBEST USE IN 15MIN TIME FRAME EURUSD / XAUSUD 1. Strategy Overview This strategy hunts short-term momentum reversals at key levels during high-liquidity sessions. Timeframes: 5-minute for entries; 15-minute for trend context Sessions: London for EUR/USD & GBP/USD; New York for XAU/USD Pairs: EUR/USD, GBP/USD, XAU/USD Indicators (3 max): EMA(20) and EMA(50) (close) MACD (12, 26, 9) histogram Optional: RSI(14) (for divergence filter) 2. Entry Rules Trend Filter (15 min): Long only if EMA20 > EMA50; short only if EMA20 < EMA50. Price-Action Zone (5 min): Identify recent swing high/low within past 20 bars. Draw horizontal support (for longs) or resistance (for shorts). Indicator Alignment (5 min): MACD histogram crossing from negative to positive for longs, positive to negative for shorts. Candle close beyond EMA20 in direction of trade. Candle Confirmation: Bullish engulfing or hammer at support for longs; bearish engulfing or shooting star at resistance for shorts. Entry Execution: Place market order on candle close that meets all above. 3. Exit Rules Stop-Loss (SL): Long: 1.5× ATR(14) below entry candle low. Short: 1.5× ATR(14) above entry candle high. Take-Profit (TP): Set at 2× SL distance (RR 1:2). Trailing SL: After price moves 1× SL in profit, trail SL to breakeven. Partial Booking: Close 50% at 1× SL (50% of TP), move SL to entry. Close remaining at full TP. 4. Trade Management False Signal Filter: Skip trades when RSI(14) > 70 for longs or < 30 for shorts (avoids overbought/oversold extremes). One Trade at a Time: No multiple positions on same pair. Session Cutoff: Close any open trade 15 minutes before session end. 5. Risk Parameters Risk per Trade: 1% of account equity. Reward Target: ≥2% (1:2 RR) per trade. Win-Rate Expectancy: ≥75% based on indicator confluence and price-action confirmation. Chỉ báo Pine Script®của akc_11-11Cập nhật 111
Williams Fractals Ultimate (Donchian Adjusted)Williams Fractals Ultimate (Donchian Adjusted) Understanding Williams Fractals Williams Fractals are a simple yet powerful tool used to identify potential turning points in the market. They highlight local highs (up fractals) and local lows (down fractals) based on a set period. An up fractal appears when a price peak is higher than the surrounding prices. A down fractal appears when a price low is lower than the surrounding prices. Fractals help traders spot support and resistance levels, potential trend reversals, and price breakout zones. Why Adjust Fractals with the Donchian Channel? The standard Williams Fractals method identifies local highs and lows without considering broader market context. This script enhances fractal accuracy by integrating the Donchian Channel, which tracks the highest highs and lowest lows over a set period. - The Donchian Baseline is calculated as the average of the highest high and lowest low over a selected period. - Fractals are filtered based on this baseline: Up Fractals are only shown if they are above the Donchian baseline. Down Fractals are only shown if they are below the Donchian baseline. This filtering method removes weak signals and ensures that only relevant fractals aligned with market structure are displayed. Key Features of the Script Customizable Fractal & Donchian Periods – Allows traders to fine-tune fractal sensitivity. Donchian-Based Filtering – Reduces noise and highlights meaningful fractals. Fractal ZigZag Line (Optional) – Helps visualize price swings more clearly. Why Is This So Effective? Stronger trend signals – Filtering with the Donchian baseline eliminates unreliable fractals. Clearer price action – The optional ZigZag line visually connects significant highs and lows. Easy trend identification – Helps traders confirm breakout zones and key price levels. This script is a technical analysis tool and does not guarantee profitable trades. Always combine it with other indicators and risk management strategies before making trading decisions. Chỉ báo Pine Script®của Julien_Exe1414931
Wick Volume AlertThis indicator is intended to find a possible price reversal and is well suited for scalping in the smaller timeframes from 1 to 15min chart. It is important to use it in conjunction with other indicators such as order blocks or price levels. The advantage over other Wick indicators is that volume is also taken into account. Unfortunately, the markers on the chart do not work properly as they do not attach themselves when moving vertically. I would be happy if someone could fix the problem, as I am not a professional in Pine scripting.Chỉ báo Pine Script®của Shazam77Cập nhật 2278
Exponential Avg Body Size Green vs RedDescription : This indicator calculates and plots the Exponential Moving Average (EMA) of green and red candlestick body sizes, allowing traders to easily visualize market momentum and sentiment shifts. The script includes the following features: Customizable EMA Period: Users can set the number of candles to calculate the EMA through an input setting, with a default value of 21. Separate Green and Red Candle Averages: Differentiates between bullish (green) and bearish (red) candlestick movements, plotting them as distinct lines. Dynamic Range Control: Users can adjust the chart range (e.g., -50 to 50) for better visibility of the plotted lines. Baseline for Reference: A horizontal baseline at 0 serves as a visual aid for easier interpretation. Standalone Indicator Pane: The script is designed to display in a separate pane, preventing overlap with the price chart. Use Case: This indicator is ideal for traders seeking to analyze the relative strength of bullish versus bearish price movements over a specific period. The separation of green and red averages helps identify trends, potential reversals, or shifts in momentum.Chỉ báo Pine Script®của Maharshinotpro1118
VWAP Bands [UAlgo]The "VWAP Bands " indicator is designed to provide traders with valuable insights into market trends and potential support/resistance levels using Volume Weighted Average Price (VWAP) bands. This indicator integrates the core concepts of VWAP with additional trend analysis features, making it a versatile tool for both range trading and trend-following strategies. The VWAP bands are plotted based on the standard deviation multipliers, creating upper and lower bands around the VWAP. These bands serve as dynamic support and resistance levels. When the price approaches these bands, traders can anticipate potential reversals or continuations of the current trend. Additionally, the indicator provides visual cues for trend strength and potential trend changes, helping traders make informed decisions in various market conditions. 🔶 Settings Source (Data Source): The data source for VWAP calculations. The default setting is the typical price (HLC3), which is the average of the high, low, and close prices. Length: The number of bars used in the VWAP calculation. This determines the lookback period for the indicator. Standard Deviation Multiplier: The multiplier applied to the standard deviation to create the primary upper and lower VWAP bands. This setting controls the distance of the bands from the VWAP. Secondary Standard Deviation Multiplier: The multiplier applied to the standard deviation to create the secondary upper and lower VWAP bands, providing additional levels of support and resistance. Display Trend: A toggle to enable or disable the display of the trend analysis feature. When enabled, the indicator highlights trend strength and potential trend changes. Display Trend Crossovers: A toggle to enable or disable the display of trend crossover signals. When enabled, the indicator plots shapes to indicate where trend switches are likely occurring. 🔶 Calculations The calculations behind the "VWAP Bands " indicator begin with determining the Volume Weighted Average Price (VWAP), which provides a comprehensive view of the average price of an asset, weighted by trading volume. This gives a more accurate representation of the asset's true average price over a specified period. The first step in this process involves summing the trading volume over a chosen period, typically represented by the length parameter. Simultaneously, the product of the price (usually an average of the high, low, and close prices) and the trading volume is calculated and summed. By dividing this cumulative price-volume product by the total volume, we obtain the VWAP value. This VWAP serves as the central anchor around which the price action oscillates. To enhance the utility of VWAP, we introduce standard deviation calculations. Standard deviation measures the extent of price dispersion from the VWAP, providing insight into price volatility. By calculating the variance (which involves the squared deviations of price) and then taking its square root, we derive the standard deviation. This helps in understanding how far prices typically stray from the VWAP. With the VWAP and standard deviation in hand, we then establish upper and lower bands by adding and subtracting multiples of the standard deviation from the VWAP. These bands act as dynamic support and resistance levels, adapting to changes in market volatility. The primary bands, set by the first standard deviation multiplier, are augmented by secondary bands defined by a larger multiplier, offering additional layers of potential support and resistance. It also integrates trend analysis, highlighting areas where the price action suggests a strong or weak trend. This is achieved by overlaying colored zones above and below the bands, indicating the strength and direction of the trend. When the price crosses these bands, it signals potential trend changes, aiding traders in making timely decisions. 🔶 Disclaimer The "VWAP Bands " indicator is provided for educational and informational purposes only. It is not intended as financial advice and should not be construed as such. Trading involves significant risk and may not be suitable for all investors. Before using this indicator or making any investment decisions, it is important to conduct thorough research and consider your financial situation. Chỉ báo Pine Script®của UAlgo173