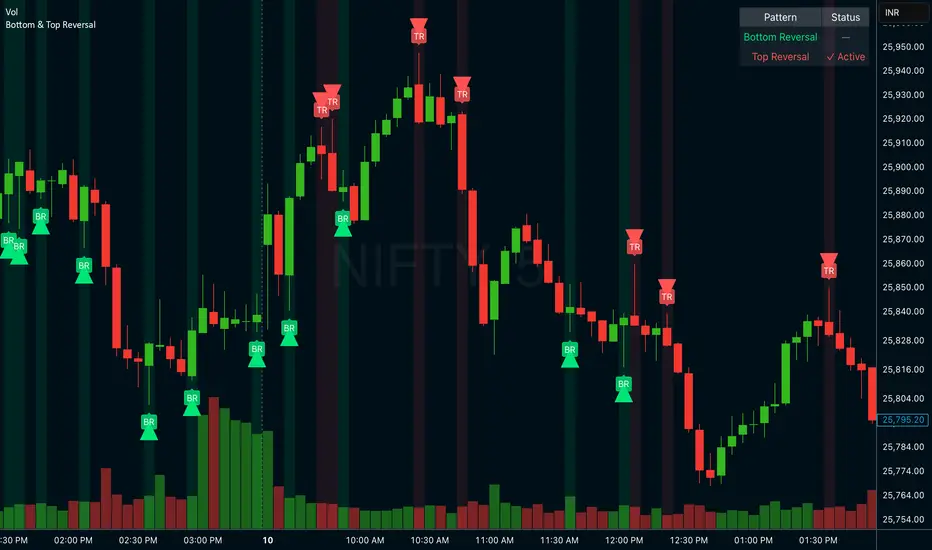
Continuation and Reversal Patterns
This script helps in identifying the reversal and continuation patterns in the japanese candle sticks this can be applied across all time frames
we can configure the maximum number of weak candles in the zone such that we can configure the strength as per end user but maximum base candles is restricted to 5
as any candles greater than that will make the pattern weak
Note : This is not a strategy rather a useful tool which suggests there might be continuation to the existing trend or there might be reversal , so use them with combination of other indicators and price action for better results
Tìm kiếm tập lệnh với "reversal"
Key ReversalA key reversal is possible reversal in trend when a the candle engulf completely, the body and wick, of the two previous candles.
HOLP/LOHPThe HOLP strategy was developed by trader-author John F. Carter in his book 'Mastering the trade: proven techniques for profiting from intraday and swing trading set ups' (ISBN 0-07-145958-8). The strategy, which gives buy signals, is a reversal strategy. Reversal strategies try to determine the point in time when a trend reverses direction. In his book John F. Carter is actually skeptical of taking a position against the trend, quoting classics like "never catch a falling knife" (buy a steep sell off) and "never step in front of a train" (short sell a strong market). Given his skepticism he decides to base his strategy on the one single factor which he deems relevant: the market price.
Inverse BandsThis was the result of quite some time spent examining how much information could be gleamed by studying the interactions between Keltner Channels, STARC Bands and Bollinger Bands. I was surprised by the results.
First of all, there are four fills that are black. Set the transparency of those to 0 and you'll see this indicator the way that it's meant to be seen. Those fills belong to unused sections of the Bollinger Bands.
There are two clouds which represent STARC Bands and the Keltner Channel. There is some delay when they flip from bullish (green) to bearish (red), but they are indicative of the trend. The space between them is black and the narrower that space is, the greater volatility is. Because of this, we don't need the exterior Bollinger Bands.
The Bollinger Bands remain visible as the yellow interior clouds on the top cloud and the blue interior clouds on the bottom cloud. Often, the thicker the yellow or blue cloud is, the less severe a throwback from a given trend reversal will be. Often the thinner that yellow or blue cloud is, the more severe the trend reversal will be. If price is rising into a thin interior yellow cloud, the following dip will be substantial. If price action dips towards a thicker interior blue cloud, often the pump following that dump will be less enthusiastic.
We preserve the Keltner Channel and STARC bands as our cloud because the way that they interact with the three basis lines yields a lot of information.
The yellow Bollinger basis line tells us about trend strength. The closer the BB basis line is to the top of the top cloud or the bottom of the bottom cloud, the stronger the trend is. When it enters the cloud very close to the bottom of the bottom cloud, you know you're looking at a strong pump, and vice versa when it's close to the top of the top cloud.
The purple Keltner Channel basis line and orange STARC Band basis line can forecast short term trend changes one candlestick in advance by contacting any line in either cloud. The moment either basis line touches or crosses any boundary of the clouds, you know that the next candle will change directions. In an uptrend, a touch or cross means the next candle will have a lower high point. In a downtrend, a cross or touch means the next candle will have a higher high point. This is most useful in scalping.
It'd be pretty easy to slap some crossover alerts on to this and useful considering that they come a candle in advance. Feel free to further explore and develop this.
Pivot Reversal AlertsPivot Reversal Study script, for generating Alerts and visual plotting of Pivot Reversal lines on the charts. Use a Strategy script (like Figs & Dates), for backtesting different settings on various time frames and charts.
Pivot of Pivot Reversal Strategy [QuantNomad]Continue looking for more signifcant pivot points.
This script is based on my "Significant Pivot Reversal Strategy".
In this strategy I use concept of pivot of pivot points.
So for PoP I require that pivot highs point should have 2 lower pivot highs points around them and pivot low 2 higher pivot lows points.
Transparent lines represent usual pivot levels ints.
Not transparent lines represent pivot of pivot levels.
Link to original script:
QuantNomad - Significant Pivot Reversal Strategy AlertsAlerts for "Significant Pivot Reversal Strategy":
As one of the ways to filter out insignificant levels I decided to check that pivot point is not above/below neighbors, but check that it's above/below at least by a certain amount.
I use ATR, so in params, you can set length of ATR and also ATR multiplier. The new level will be calculated only if PP will be above/below neighbors by atr * atr_mult.
It seems this approach might help in some cases.
QuantNomad - Significant Pivot Reversal StrategyI'm working on improving the Pivot Points Reversal Strategy.
As one of the ways to filter out insignificant levels I decided to check that pivot point is not above/below neighbors, but check that it's above/below at least by a certain amount.
I use ATR, so in params, you can set length of ATR and also ATR multiplier. The new level will be calculated only if PP will be above/below neighbors by atr * atr_mult.
It seems this approach might help in some cases.
Here I have PivotPoint + RSI strategy:
Pivot Point Reversal + RSI AlertsThese are alerts for previously published strategy:
This strategy joins the Pivot Reversal strategy with the RSI indicator.
We check RSI level at the pivot point level and only if RSI condition is satisfied we update levels for stop orders.
Inside Reversal Engulfing BarInside bar bullish = yellow
Inside Bar bearish = orange
engulfing bar bullish = green
engulfing bar bearish = red
reversal bar bullish = blue
reversal bar bearish = purple
PivotBoss Extreme Reversal SetupPATTERN SUMMARY
1. The first bar of the pattern is about two times larger than the average size of the candles in the lookback
period.
2. The body of the first bar of the pattern should encompass more than 50 percent of the bar's total range, but
usually not more than 85 percent.
3. The second bar of the pattern opposes the first. If the first bar of the pattern is bullish (C > 0), then the second
bar must be bearish (C < 0). If the first bar is bearish (C < 0), then the second bar must be bullish (C > 0).
PATTERN PSYCHOLOGY
The extreme reversal setup is a clever pattern that capitalizes on the ongoing psychological patterns of
investors, traders, and institutions. Basically, the setup looks for an extreme pattern of selling pressure and then
looks to fade this behavior to capture a bullish move higher (reverse for shorts). In essence, this setup is visually
pointing out oversold and overbought scenarios that forces responsive buyers and sellers to come out of the dark
and put their money to work-price has been over-extended and must be pushed back toward a fair area of value
so two-sided trade can take place.
This setup works because many normal investors, or casual traders, head for the exits once their trade
begins to move sharply against them. When this happens, price becomes extremely overbought or oversold,
creating value for responsive buyers and sellers. Therefore, savvy professionals will see that price is above or
below value and will seize the opportunity. When the scared money is selling, the smart money begins to buy, and
Vice versa.
Look at it this way, when the market sells off sharply in one giant candlestick, traders that were short
during the drop begin to cover their profitable positions by buying. Likewise, the traders that were on the
sidelines during the sell-off now see value in lower prices and begin to buy, thus doubling up on the buying
pressure. This helps to spark a sharp v-bottom reversal that pushes price in the opposite direction back toward
fair value.
Kozlod - Pivot Reversal Strategy Alerts V2Its' new version of previously published Kozlod - Pivot Reversal Strategy Alerts
Indicator now better correspond to original strategy. However, there can be some differences. Problem is that it's pretty tricky to implement in plain PineScript same "stop" logic used in strategy.entry of the original script
Ramo Trend Reversal Set (HTF Confirmed)Ramo Trend Reversal (HTF Confirmed)
Short – net – profesyonel
Sistem mantığını tek başına anlatıyor
Session ATR Progression Tracker📊 Session ATR Progression Tracker - SIYL Regression Trading Tool
Track how much of your instrument's 7-day Average True Range (ATR) has been covered during the current trading session. This indicator is specifically designed for regression traders who follow the "Stay In Your Lane" (SIYL) methodology, helping you identify when the probability of mean reversion significantly increases. If you are interested in more on that check out Rod Casselli and tradersdevgroup.com.
🎯 Key Features:
• Real-time ATR Coverage Percentage - See at a glance what percentage of the 7-day ATR has been covered in the current session
• SIYL-Optimized Thresholds - See at a glance when the instrument has achieved 80% and 100% ATR coverage, the proven thresholds where mean reversion probability increases (customizable)
• Flexible Session Modes:
- Daily: Resets at calendar day change
- Session: Uses exchange-defined trading sessions
- Custom Session: Set your exact session start/end times (perfect for futures traders and international markets)
• Visual Alerts - Color-coded display (gray → orange → red) and optional background highlighting
• Repositionable Display - Choose from 9 screen positions to avoid chart clutter
• Session Markers - Green triangles mark the start of each new session
• Detailed Stats - View current range, ATR value, session high/low, and session status
💡 Why Use This Indicator?
This tool is built around a proven concept: regression trading becomes significantly more effective once a session has achieved at least 80% of its 7-day ATR. At this threshold, the probability of price reverting to mean increases substantially, creating higher-probability trade setups for SIYL practitioners.
Benefits for regression traders:
- Identify optimal entry points when mean reversion probability is highest (≥80% ATR coverage)
- Avoid premature regression entries before adequate range has been established
- Recognize when daily moves have "earned their range" and are ripe for reversal
- Time fade-the-move and counter-trend strategies with statistical backing
- Improve win rates by trading only after proven probability thresholds are met
⚙️ Setup Instructions:
1. Add the indicator to your chart
2. Select your preferred "Reset Mode" (recommend "Custom Session" for futures/international markets)
3. If using Custom Session, enter your session times in 24-hour format (e.g., 0930-1600 for US stocks, 1700-1600 for CME futures)
4. Adjust alert thresholds if desired (default: 80% and 100% - proven SIYL thresholds)
5. Position the display where it's most visible on your chart
📈 Works Across All Markets:
Stocks • Futures • Forex • Indices • Crypto • Commodities
Perfect for regression traders, mean reversion specialists, and SIYL practitioners who want to trade with probability on their side by entering only after the session has "earned its range."
---
Tip: For futures contracts with overnight sessions that span calendar days (like MES, MNQ, MYM), use "Custom Session" mode with your exchange's official session times for accurate tracking.
Ultimate Reversion BandsURB – The Smart Reversion Tool
URB Final filters out false breakouts using a real retest mechanism that most indicators miss. Instead of chasing wicks that fail immediately, it waits for price to confirm rejection by retesting the inner band—proving sellers/buyers are truly exhausted.
Eliminates fakeouts – The retest filter catches only genuine reversions
Triple confirmation – Wick + retest + optional volume/RSI filters
Clear visuals – Outer bands show extremes, inner bands show retest zones
Works on any timeframe – From scalping to swing trading
Perfect for traders tired of getting stopped out by false breakouts.
Core Construction:
Smart Dynamic Bands:
Basis = Weighted hybrid EMA of HLC3, SMA, and WMA
Outer Bands = Basis ± (ATR × Multiplier)
Inner Bands = Basis ± (ATR × Multiplier × 0.5) → The "retest zone"
The Unique Filter: The Real Retest
Step 1: Identify an extreme wick touching the outer band
Step 2: Wait 1-3 bars for price to return and touch the inner band
Why it works: Most false breakouts never retest. A genuine reversal shows seller/buyer exhaustion by allowing price to come back to the "halfway" level.
Optional Confirmations:
Volume surge filter (default ON)
RSI extremes filter (optional)
Each can be toggled ON/OFF
How to Use:
Watch for extreme wicks touching the red/lime outer bands
Wait for the retest – price must return to touch the inner band (dotted line) within 3 bars
Enter on confirmation with built-in volume/RSI filters
Set stops beyond the extreme wick
Tomb Reversal Signal Engulfing + RSI Momentum DetectorTomb is a fast and minimalistic reversal-detection indicator built to capture high-probability turning points in the market.
It combines engulfing candlestick patterns, a strong candle body filter, and RSI momentum analysis to generate precise BUY and SELL signals with minimal noise.
🔍 How it Works
The indicator triggers:
✅ BUY Signal
Bullish engulfing pattern appears
Candle body strength > 50% of total range (real momentum)
RSI below 50 (bearish momentum weakening)
Price decreasing over the last 5 bars (down-trend exhaustion)
✅ SELL Signal
Bearish engulfing pattern
Candle body shows strength
RSI above 50 (bullish momentum weakening)
Price increasing over the last 5 bars (up-trend exhaustion)
⚡ Why Tomb Works
Filters out weak signals using candle structure
Detects momentum shifts early
Works on all markets: Crypto, Forex, Indices, Stocks
Ideal for scalping, day trading, or swing trading
🎯 Purpose
To highlight the exact moments where the market shows exhaustion and is ready to reverse—before most traders see it.
📌 Recommended Use
For best performance:
Combine with trend tools such as EMA 200 or market structure
Look for signals at support/resistance or liquidity zones
Liquidity Sweep & Reversal MapLiquidity Sweep & Reversal Map (LSRM) is a visual tool designed to help traders study how price interacts with key liquidity areas such as daily highs, daily lows, previous-day levels, and potential sweep zones. Its purpose is to map structure, highlight volatility around major reference points, and visualize how price behaves after taking liquidity.
This indicator does not attempt to predict market direction. It simply identifies conditions where price has interacted with a known reference level and marks that interaction for user analysis.
🔍 What This Indicator Shows
1. Key Liquidity Reference Levels
The script automatically draws and updates the following levels:
TH — Today’s High
TL — Today’s Low
PDH — Previous Day High
PDL — Previous Day Low
These levels are widely monitored by many traders and can be helpful when studying liquidity behavior and intraday volatility.
2. Liquidity Sweeps
A liquidity sweep occurs when:
Price briefly moves beyond a major high or low
And then closes back within the prior range
The indicator marks detected sweep interactions with:
BS (Bullish Sweep) when liquidity is taken below a low
SS (Bearish Sweep) when liquidity is taken above a high
A sweep only appears after the bar has closed, helping users analyze completed price structure.
3. Optional Sweep Zones
When enabled, the tool draws a shaded zone between:
The swept wick
The reference level
This can help highlight areas where liquidity was taken.
4. Volume & Candle Filters
The indicator includes optional filters such as:
Relative volume spikes
Strong candle body requirement
These filters are provided only to refine the visual highlight of sweeps; they do not constitute trading signals.
🎛 Customization
Users can configure:
Instrument presets
Sweep buffers
Volume sensitivity
Line visibility and thickness
Label display
Zone visibility
All settings are optional and intended for chart annotation only.
⚠️ Important Notes
This tool is not a trading system, signal generator, or strategy.
It does not provide buy/sell advice or predict future price movement.
All markings are visual aids for chart study and structural analysis only.
Users should rely on their own judgment and independent analysis when making trading decisions.
Slope Rank ReversalThis tool is designed to solve the fundamental problem of "buying low and selling high" by providing objective entry/exit signals based on momentum extremes and inflection points.
The System employs three core components:
Trend Detection (PSAR): The Parabolic SAR is used as a filter to confirm that a trend reversal or transition is currently underway, isolating actionable trade setups.
Dynamic Momentum Ranking: The indicator continuously measures the slope of the price action. This slope is then ranked against historical data to objectively identify when an asset is in an extreme state (overbought or oversold).
Signal Generation (Inflection Points):
Oversold/Buy: A 🟢 Green X is generated only when the slope ranking indicates the market is steeply negative (oversold), and the slope value begins to tick upwards (the inflection point), signaling potential mean reversion.
Overbought/Sell: A 🔴 Red X is generated only when the slope ranking indicates the market is steeply positive (overbought), and the slope value begins to tick downwards, signaling momentum exhaustion.
The core philosophy is simple: Enter only when the market is exhausted and has started to turn.
Bullish & Bearish Reversal Pattern with Sequential Bars20 Bollinger Bands and custom Stochasti_MTM Setup
Both long and short reversal signals.
HV Spike Strategy (HVP + OR Breakout + Reversal + TP/SL Modes)Here is a script that I tried to make it simple, although it has several parameters, I will try to explain, here we go:
Logic: Open Range Breakout: otherwise knows as First Candle Rule, usually used for the first candle in the opening of a market session, in my strategy there is an option to use it even for Crypto that operate 24/7, how to do that? Simply by detecting Volatility from the HVP (Historical Volatility Percentile). Then the ORB logic kicks in and the first candle with high volatility gives the ranges for the trades. The proper HVP Activation Threshold has to be selected for each currency pair/index/crypto in order to have maximum profit.
Enter a trade: when the price goes 100% above/below the First Candle Rule Range. That way it is filtering fake breakouts. Also if the price reverses back into the range the strategy takes the opposite trade.
Exit a trade: SL/TP By percentage or ATR, selection in the input menu.
My intention is to avoid using lagging indicators or guessing of Price Action, purely Bull/Bear indication by the first candle.
I hope you find this helpful! Wishing all successful Trades!


