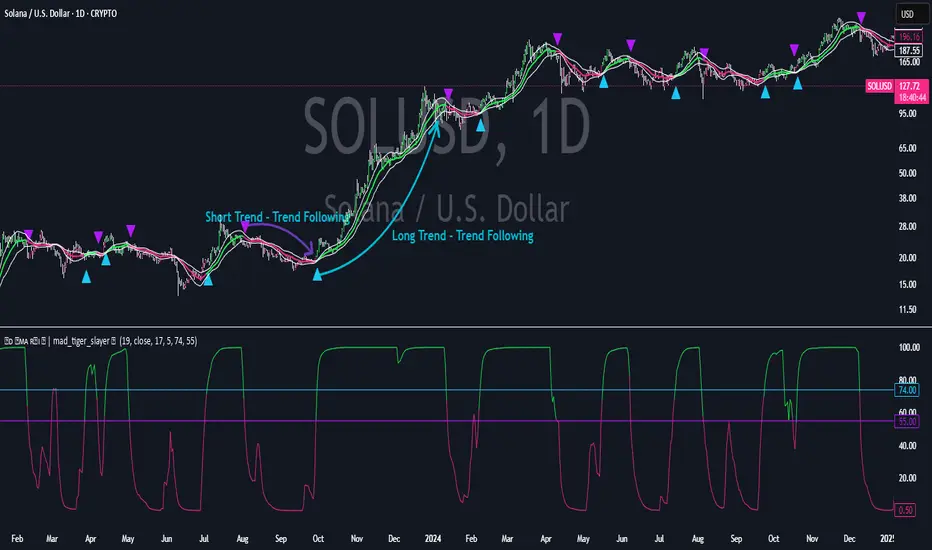
MACD of RSI [TORYS]MACD of RSI — Momentum & Divergence Scanner
Description:
This enhanced oscillator applies MACD logic directly to the Relative Strength Index (RSI) rather than price, giving traders a clearer look at internal momentum and early shifts in trend strength. Now featuring a custom histogram, dual MA types, and RSI-based divergence detection — it’s a complete toolkit for identifying exhaustion, acceleration, and hidden reversal points in real time.
How It Works:
Calculates the MACD line as the difference between a fast and slow moving average of RSI. Adds a Signal Line (MA of the MACD) and plots a Histogram to show momentum acceleration/deceleration. Both RSI MAs and the Signal Line can be toggled between EMA and SMA for custom tuning.
Divergence Detection:
Bullish Divergence : Price makes a lower low while RSI makes a higher low → labeled with a green “D” below the curve.
Bearish Divergence : Price makes a higher high while RSI makes a lower high → labeled with a red “D” above the curve.
Configurable lookback window for tuning sensitivity to pivots, with 4 as the sweet spot.
RSI Pivot Dot Signals:
Plots green dots at RSI oversold pivot lows below 30,
Plots red dots at overbought pivot highs above 70.
Helps detect short-term exhaustion or bounce zones, plotted right on the MACD-RSI curve.
RSI 50 Crosses (Optional):
Optional ▲ and ▼ labels when RSI crosses its 50 midline — useful for momentum trend shifts or pullback confirmation, or to detect consolidation.
Histogram:
Plotted as a column chart showing the distance between MACD and Signal Line.
Colored dynamically:
Bright green : Momentum rising above zero
Light green : Weakening above zero
Bright red : Momentum falling below zero
Light red : Weakening below zero
The zero line serves as the mid-point:
Above = Bullish Bias
Below = Bearish Bias
How to Interpret:
Momentum Confirmation:
Use MACD cross above Signal Line with a rising histogram to confirm breakouts or trend entries.
Histogram shrinking near zero = momentum weakening → caution or reversal.
Exhaustion & Reversals:
Dot signals near RSI extremes + histogram peak can suggest overbought/oversold pressure.
Use divergence labels ("D") to spot early reversal signals before price breaks structure.
Inputs & Settings:
RSI Length
Fast/Slow MA Lengths for MACD (applied to RSI)
Signal Line Length
MA Type: Choose between EMA and SMA for MACD and Signal Line
Pivot Sensitivity for dot markers
Divergence Logic Toggle
Show/hide RSI 50 Crosses
Best For:
Traders who want momentum insight from inside RSI, not price
Scalpers using divergence or exhaustion entries
Swing traders seeking entry confirmation from signal crossovers
Anyone using multi-timeframe confluence with RSI and trend filters
Pro Tips:
Combine this with:
Bollinger Bands breakouts and reversals
VWAP or EMAs to filter entries by trend
Volume spikes or BBW squeezes for volatility confirmation
TTM Scalper Alert to sync structure and momentum
Chỉ báo Pine Script®