Auto Draw ToolAuto Draw Tool for TradingView – Trend, Support/Resistance & Fibonacci Indicator ( HIMANSHU AGNIHOTRY)
The Auto Draw Tool is a powerful TradingView indicator that automatically detects trend lines, support & resistance levels, and Fibonacci retracement zones. It helps traders identify key price levels and market trends without manual effort.
🔹 Features
✔ Automatic Support & Resistance Detection – Finds the strongest price levels based on past highs and lows
✔ Trend Line Auto-Plotting – Detects market trends using swing highs and lows
✔ Fibonacci Retracement Levels – Highlights key retracement points for potential reversals
✔ Candlestick Pattern Detection – Identifies bullish and bearish engulfing patterns
✔ Background Alerts for Patterns – Highlights candlestick patterns with color-coded backgrounds
✔ Works on Any Timeframe – Suitable for scalping, swing trading, and long-term investing
🛠 How It Works?
Support & Resistance Levels: The script calculates the highest and lowest price levels within a given lookback period.
Trend Line Identification: It detects swing highs and swing lows to draw automatic trend lines.
Fibonacci Retracement: The script marks important Fibonacci levels (0%, 23.6%, 38.2%, 50%, 61.8%, 78.6%, 100%) for potential entry and exit points.
Engulfing Candlestick Patterns: It recognizes bullish engulfing and bearish engulfing patterns, which indicate strong buying or selling pressure.
Alerts & Background Highlighting: When an engulfing pattern is detected, the background color changes (green for bullish, red for bearish).
🔔 Alerts & Signals
🚀 Bullish Engulfing Detected: Green background & buy signal alert
🚀 Bearish Engulfing Detected: Red background & sell signal alert
🎯 Who Can Use It?
✅ Day Traders & Scalpers – Quickly identify key price action levels
✅ Swing Traders – Find strong support/resistance and Fibonacci retracement areas
✅ Trend Followers – Confirm trend direction with auto-drawn trend lines
✅ Price Action Traders – Get real-time candlestick pattern alerts
Tìm kiếm tập lệnh với "scalp"

Zen ABR### **Average Bar Range (ABR) Levels** – A Simple Yet Powerful Scalping Tool
The **ABR Levels** indicator dynamically calculates the **average bar range** and plots three key levels on your chart:
✅ **0.5x ABR** – Half the average bar range
✅ **1x ABR** – The full average bar range
✅ **2x ABR** – Double the average bar range
This provides an **instant volatility gauge**, helping traders adjust position size, stop losses, and targets **based on current market conditions** rather than arbitrary numbers.
### **How It Works**
- The indicator calculates **the average range of the last 8 bars** (default setting, adjustable).
- The **ABR levels update in real time**, appearing in the **top-right corner of your chart** for easy reference.
- Works across **any instrument and timeframe** – great for scalpers and intraday traders.
### **Why Use ABR Levels?**
🚀 **Avoid oversized losses** – Trade dynamically instead of using fixed stops and targets.
📉 **Recognize shifts in market conditions** – Identify when volatility is expanding or contracting.
🎯 **Refine your entries & exits** – Use ABR levels to **scale** your positions intelligently.
### **Pro Tip:**
Never enter a trade **aiming for half-R** profits. If a trade goes badly, **you might manage it to break even or half-R**, but aiming for tiny wins will **wreck your long-term edge**.
🔹 **This script is open-source!** If you're not on TradingView, you can copy the code into any AI tool to generate it for your platform. 🚀

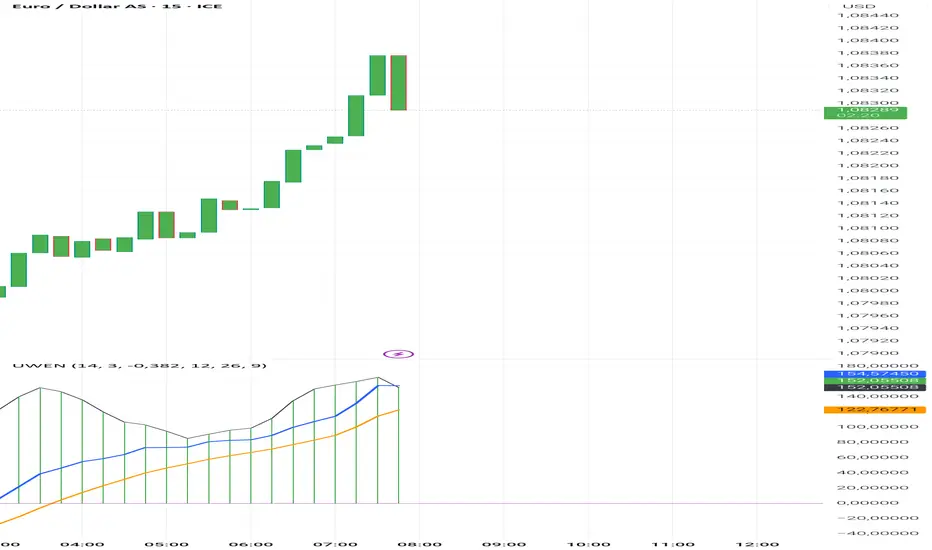
Uwen FX: UWEN StrategyThis Pine Script defines a trading indicator called "Uwen FX: UWEN Strategy" Where ideas coming from Arab Syaukani and modified by Fiki Hafana. It combines a CCI-based T3 Smoothed Indicator with a MACD overlay. Here's a breakdown of what it does:
Key Components of the Script:
1. CCI (Commodity Channel Index) with T3 Smoothing
Uses a T3 smoothing algorithm on the CCI to generate a smoother momentum signal. The smoothing formula is applied iteratively using weighted averages. The final result (xccir) is plotted as a histogram, colored green for bullish signals and red for bearish signals.
2. MACD (Moving Average Convergence Divergence)
The MACD is scaled to match the range of the smoothed CCI for better visualization. Signal Line and MACD Line are plotted if showMACD is enabled. The normalization ensures that MACD values align with the CCI-based indicator.
3. Bar Coloring for Trend Indication
Green bars indicate a positive trend (pos = 1).
Red bars indicate a negative trend (pos = -1).
Blue bars appear when the trend is neutral.
How It Can Be Used:
Buy Signal: When the xccir (smoothed CCI) turns green, indicating bullish momentum.
Sell Signal: When xccir turns red, indicating bearish momentum.
MACD Confirmation: Helps confirm the trend direction by aligning with xccir.
I will add more interesting features if this indicator seems profitable
Multi timeframe RSIMulti-Timeframe RSI Indicator
This indicator displays the Relative Strength Index (RSI) from multiple timeframes—1 minute, 5 minutes, 15 minutes, and 30 minutes—on a single chart. Designed for intraday scalpers and short-term traders, it provides a comprehensive view of momentum across different timeframes, helping traders make more informed decisions.
✨ Why Use This Indicator?
✔ Enhanced Confirmation – Identify trends and momentum shifts with RSI signals from multiple timeframes.
✔ Perfect for Scalping & Intraday Trading – Quickly spot overbought/oversold conditions across different timeframes.
✔ Multi-Timeframe Confluence – Align entries and exits with stronger confirmation by analyzing RSI across short-term charts.
✔ Customizable & Easy to Use – Adjust RSI settings to suit your trading style.
This is a must-have tool for traders looking to refine their entries and exits with a multi-timeframe perspective! 🚀

[volfgang] Pivot Levels (Open, Close, High, Low)This script provides a clear and consistent way to track key price levels from Weekly and Daily bars, directly on your current chart interval.
The default colours are;
Today & This Week Open = White
Yesterday & Previous Week Open = Cream
Yesterday's High = Red
Yesterday's Low = Green
Weekly Pivots are 2px, and Daily Pivots are 1px.
Instead of requiring manual referencing of daily or weekly charts, these significant levels are automatically drawn and updated in real time, extending to the right as new bars form.
It adds value by helping traders quickly identify potential support/resistance zones and compare intraday price action with higher-timeframe pivots. This approach can aid in scalping, day trading, or swing trading strategies that rely on past price levels for trade entries, exits, or stop loss placement.
Daily Pivots Displayed Intraday
The script imports the previous day’s High, Low, Open, and Close and draws lines on the current chart, so you can see exactly where those levels lie on any intraday timeframe. You can easily change the colour of these lines in the menu.
Instead of switching between multiple charts for daily references, you can keep an intraday chart open and still watch how price behaves around these important daily pivots.
Weekly Pivots for Broader Context
In addition to daily levels, it also shows the previous week’s Open and Close. This feature helps traders who want to maintain a broader perspective and gauge the market’s weekly trend or bias while remaining on lower timeframes.
Automatic Line & Label Management
Each new trading day triggers a “session change” in the code, prompting the script to delete old lines and labels for daily levels. This keeps your chart from getting cluttered with outdated lines.
Weekly lines and labels follow the same approach, ensuring only the most recent weekly levels are highlighted.
Real-Time Extension
Lines are continuously extended to the right as new bars print, ensuring that you always have an updated view of your key price levels without any manual adjustments.
On the last bar, the script shifts to a time-based coordinate system for seamless visual extension.
Minimal Recalculation
This script uses security() calls in a carefully optimized way to reduce unnecessary recalculations and avoid repaint issues. By referencing open , close , etc., the lines remain fixed once the daily (or weekly) candle is confirmed.
Flexible Usage
You can apply this script to any symbol on TradingView. It’s especially beneficial for Forex pairs, indices, futures, or cryptocurrencies where you want to track significant past levels.
If you’re a scalper looking for areas of likely reaction, or a swing trader watching weekly opens for trend confirmation, these levels can be integral to your technical approach.
How to Use
Add to Chart: Click the “Add to Favorite Indicators” or “Apply to Chart” button once published.
Enable or Disable Previous Day Bars: Use the script’s input to toggle the display of previous day’s High, Low, Open, and Close lines if you only want weekly lines (or vice versa).
Customize Visuals: You can change line colors, width, and label text in the “Style” or “Inputs” tab. Adjust them to fit your preferred color scheme.
Interpretation:
Daily levels typically carry relevance for the next trading session. They can be used for intraday support/resistance, breakout checks, or gap fills.
Weekly levels help identify more prominent zones for bigger moves or for understanding overall sentiment from the prior week.
Conceptual Underpinnings
Support/Resistance: Past opens/closes often act as support or resistance because they represent important points of reference (where trading started or ended during a prior session).
Market Psychology: Many traders watch daily or weekly closes to gauge momentum and bias, which can become self-fulfilling as more participants join around those levels.
Improved Situational Awareness: By having these levels automatically drawn and updated, traders avoid missing critical areas where price may pivot.
This script is intentionally open-source to help traders study and personalize it.
By merging daily and weekly pivot concepts in a single script, it provides a convenient and efficient tool—rather than a simple mashup, it unifies two timeframes that are crucial in short-term and medium-term trading decisions.
Remember that these levels alone do not constitute a complete trading system; they are best used as part of a broader strategy involving risk management, additional technical signals, and market context.

ENIGMA Signals with Retests Select higher Time FrameENIGMA Signals with Retests – Script Description
The "ENIGMA Signals with Retests" script is a unique indicator designed for traders who prefer precision trading based on price action retests of key levels derived from higher timeframes. This tool is ideal for those employing multi-timeframe analysis strategies, helping them detect high-probability trade entries when the price interacts with significant support and resistance levels.
What Does This Script Do?
This indicator identifies key levels from a higher timeframe selected by the user (e.g., 4-hour or daily), then tracks price action on lower timeframes to provide actionable buy and sell signals when the price retests these levels. It visually plots the key levels on the chart and triggers alerts for potential trade opportunities when conditions are met.
How It Works
Key Level Detection:
The script uses custom functions to detect recent swing highs and swing lows on the selected higher timeframe (such as 4H or Daily). These levels represent potential areas of support and resistance where price reactions are likely to occur.
Multi-Timeframe Analysis:
The indicator leverages the request.security() function to retrieve price data from the user-defined higher timeframe and plots horizontal lines on the chart for the most recent swing highs and lows.
Retest-Based Signals:
Once the key levels are plotted, the script continuously monitors the price on the lower timeframe:
A Buy Signal is triggered when the price closes below a key high level and then moves back above it, indicating a potential bullish retest.
A Sell Signal is triggered when the price closes above a key low level and then moves back below it, indicating a potential bearish retest.
These retest signals are displayed as green and red arrows on the chart, helping traders identify optimal entry points.
Alerts for Retests:
The script includes built-in alert conditions that notify traders when a valid retest signal occurs. This allows traders to react promptly without constantly monitoring the chart.
How to Use the Script
Select Your Key Timeframe:
From the input settings, choose a higher timeframe that suits your trading style (e.g., 4H for intraday trading or Daily for swing trading).
Adjust Visual Preferences:
Customize the line style (solid, dashed, or dotted) and length of the plotted levels.
Toggle labels for the levels on or off as per your preference.
Trade Execution:
Once a retest signal appears on the lower timeframe, consider entering a trade in the direction of the signal. The buy signal suggests a potential long entry, while the sell signal indicates a potential short entry.
Set Alerts:
Use the alert conditions provided to get notified whenever a valid retest occurs. This helps in reducing screen time and improving trading efficiency.
Underlying Concepts
This script is grounded in the principles of support and resistance, retests, and breakout trading. By focusing on multi-timeframe key levels, it aligns with widely used trading concepts like:
Breakout and Retest: Entering trades after a confirmed breakout and successful retest of a significant level.
Swing Highs and Lows: Recognizing swing points to identify strong price reaction zones.
Multi-Timeframe Confluence: Enhancing trade probability by ensuring that the signals on lower timeframes correspond with key levels from higher timeframes.
Why This Script Is Unique
Unlike many generic trend-following or scalping indicators, "ENIGMA Signals with Retests" offers:
Precision Signals: It only provides signals when specific retest conditions are met, reducing false signals and noise.
Multi-Timeframe Customization: Users can tailor the higher timeframe to their strategy, making it versatile for various trading styles.
Alert Functionality: Alerts are integrated, allowing traders to stay updated without constantly monitoring the charts.
This script is perfect for traders looking for a systematic way to trade retests of key levels across multiple timeframes. Whether you're a scalper, day trader, or swing trader, "ENIGMA Signals with Retests" can help improve your precision and timing in the market.

Time-Based VWAP (TVWAP)(TVWAP) Indicator
The Time-Based Volume Weighted Average Price (TVWAP) indicator is a customized version of VWAP designed for intraday trading sessions with defined start and end times. Unlike the traditional VWAP, which calculates the volume-weighted average price over an entire trading day, this indicator allows you to focus on specific time periods, such as ICT kill zones (e.g., London Open, New York Open, Power Hour). It helps crypto scalpers and advanced traders identify price deviations relative to volume during key trading windows.
Key Features:
Custom Time Interval:
You can set the exact start and end times for the VWAP calculation using input settings for hours and minutes (24-hour format).
Ideal for analyzing short, high-liquidity periods.
Dynamic Accumulation of Price and Volume:
The indicator resets at the beginning of the specified session and accumulates price-volume data until the end of the session.
Ensures that the TVWAP reflects the weighted average price specific to the chosen session.
Visual Representation:
The indicator plots the TVWAP line only during the specified time window, providing a clear visual reference for price action during that period.
Outside the session, the TVWAP line is hidden (na).
Use Cases:
ICT Scalp Trading:
Monitor price rebalances or potential liquidity sweeps near TVWAP during important trading sessions.
Mean Reversion Strategies:
Detect pullbacks toward the session’s average price for potential entry points.
Breakout Confirmation:
Confirm price direction relative to TVWAP during kill zones or high-volume times to determine if a breakout is supported by volume.
Inputs:
Start Hour/Minute: The time when the TVWAP calculation starts.
End Hour/Minute: The time when the TVWAP calculation ends.
Technical Explanation:
The indicator uses the timestamp function to create time markers for the session start and end.
During the session, the price-volume (close * volume) is accumulated along with the total volume.
TVWAP is calculated as:
TVWAP = (Sum of (Price × Volume)) ÷ (Sum of Volume)
Once the session ends, the TVWAP resets for the next trading period.
Customization Ideas:
Alerts: Add notifications when the price touches or deviates significantly from TVWAP.
Different Colors: Use different line colors based on upward or downward trends.
Multiple Sessions: Add support for multiple TVWAP lines for different time periods (e.g., London + New York).

ADR Table BY @ICT_YEROADR Table BY @ICT_YERO
Created by: @ICT_YERO
This custom indicator is designed to provide the Average Daily Range (ADR) for multiple timeframes, including Daily, 4-Hour, and 1-Hour. The indicator is tailored to assist traders in understanding price volatility and making informed trading decisions.
Key Features
Multi-Timeframe ADR Calculation:
Automatically calculates and displays the ADR for Daily, 4-Hour, and 1-Hour timeframes.
Helps traders identify potential price movement ranges for different trading sessions.
Dynamic Range Visualization:
Clear visual representation of the ADR on the chart, making it easy to spot price extremes.
Real-time updates to reflect changes in price movement.
Custom Alerts:
Option to set alerts when the price approaches the ADR high or low.
Useful for identifying potential reversal zones or breakout opportunities.
User-Friendly Interface:
Simple and intuitive settings to customize colors, levels, and display preferences.
Seamlessly integrates with your existing TradingView setup.
ICT-Inspired Methodology:
Designed for traders who follow ICT concepts, focusing on precision and high-probability setups.
Applications
Range Trading: Helps determine the high and low boundaries for scalping or intraday setups.
Volatility Analysis: Understand market behavior during different times of the day or week.
Reversal Zones: Identify areas where price is likely to reverse, based on ADR extremes.
Whether you're a scalper, day trader, or swing trader, this indicator provides a comprehensive overview of price volatility across multiple timeframes, making it an essential tool for your trading arsenal.

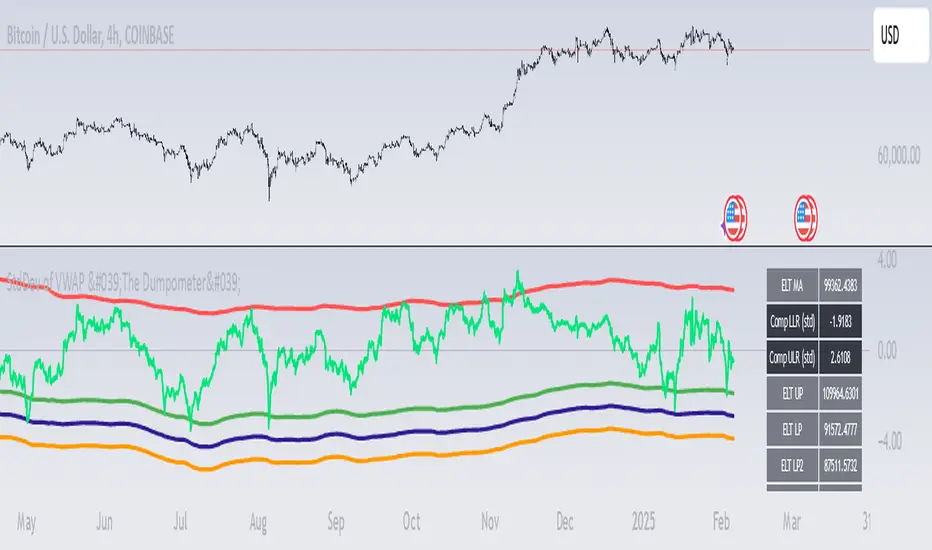
StdDev of VWAP/MAStdDev Indicator (MA, Smoothed VWAP & Rolling VWAP) v5
Overview: The StdDev Indicator is a comprehensive tool designed to provide traders with multi-term deviation analysis by integrating various Moving Averages (MA) and Volume Weighted Average Price (VWAP) methodologies. This indicator combines different MA types and VWAP calculations across multiple timeframes to offer a nuanced view of market volatility and trend strength.
Key Features:
Multiple Moving Average Types:
Simple Moving Average (SMA): Calculates the average price over a specified period, providing a straightforward trend indicator.
Exponential Moving Average (EMA): Gives more weight to recent prices, making it more responsive to new information.
Weighted Moving Average (WMA): Assigns different weights to each price point, emphasizing specific periods.
Smoothed VWAP: Enhances the traditional VWAP by applying additional smoothing techniques (SMA, EMA, WMA) to reduce volatility.
Rolling VWAP: Continuously recalculates VWAP over a rolling window, offering dynamic support and resistance levels.
Multi-Term Deviation Analysis:
Extra Short Term (30 periods)
Short Term (50 periods)
Medium Term (110 periods)
Long Term (125 periods)
Extra-Long Term (190 periods)
Extremely-Long Term (245 periods)
Each term calculates the deviation of the selected price source (default: Low) from its corresponding MA or VWAP, normalized by the standard deviation. This multi-term approach allows traders to assess volatility and trend consistency across different time horizons.
Composite Upper and Lower Bounds:
Aggregates the upper and lower deviations from all terms to form composite boundaries. These bounds serve as dynamic support and resistance levels, helping traders identify potential reversal points or breakout zones.
Timeframe Customization:
Visibility Settings: Customize which deviation terms are visible on specific timeframes (15m, 1h, 4h, 1d, 1w). This flexibility ensures that the indicator aligns with your trading strategy, whether you're a scalper, day trader, or long-term investor.
Bar Coloring (Optional):
Visual Cues: When enabled, bars are color-coded based on the deviation levels, providing immediate visual feedback on market conditions. For example, bars may turn red when short-term deviations exceed the upper bound, indicating potential overbought conditions.
How It Works:
Deviation Calculation:
For each selected MA or VWAP type and term length, the indicator calculates the deviation of the current price source from the MA/VWAP. This deviation is normalized by the standard deviation to account for volatility.
Channel Offset:
Applies a linear regression and standard deviation to the deviation series to establish upper and lower channels. These channels are adjustable via multipliers, allowing traders to set their sensitivity levels.
Composite Boundaries:
Averages the upper and lower channels across all deviation terms to form composite upper and lower bounds. These bounds provide a holistic view of market volatility and trend strength.
Visualization:
Plots individual deviation lines for each term, along with the composite bounds. Optional bar coloring enhances visual interpretation, making it easier to spot significant market movements.
Usage Instructions:
Setup:
Add the StdDev Indicator to your TradingView chart. By default, it uses the Low price as the source, but this can be customized.
Configuration:
Moving Average Type: Select your preferred MA or VWAP type from the dropdown menu.
Term Lengths: Adjust the lengths for each deviation term as per your trading strategy.
StdDev Multipliers: Set the multipliers for the upper and lower bounds to control sensitivity.
Timeframe Visibility: Choose which deviation terms are visible on specific timeframes to tailor the indicator to your trading style.
Bar Coloring: Enable or disable bar coloring based on deviation thresholds for enhanced visual cues.
Interpretation:
Deviations: Monitor the deviation lines to assess overbought or oversold conditions across different terms.
Composite Bounds: Use the upper and lower bounds as dynamic support and resistance levels.
Bar Colors: Quickly identify significant market movements through color-coded bars.
Why Choose StdDev Indicator?
Comprehensive Analysis: By integrating multiple MA and VWAP types across various terms, the indicator offers a multifaceted view of market conditions.
Customization: Highly configurable settings allow traders to adapt the indicator to their specific strategies and timeframes.
Visual Clarity: Clear plotting and optional bar coloring provide intuitive insights, reducing the need for complex analysis.
Conclusion: The StdDev Indicator (MA, Smoothed VWAP & Rolling VWAP) v5 is a versatile tool that combines advanced moving average and VWAP methodologies to deliver a robust deviation analysis framework. Whether you're looking to fine-tune your scalping strategy or gain a deeper understanding of long-term market trends, this indicator equips you with the necessary tools to make informed trading decisions.
Support & Feedback: If you have any questions or need assistance with the indicator, feel free to reach out through the TradingView community or contact the script author directly.
Full Spectrum Delta BandsI created the Full Spectrum Delta Bands (FullSpec ΔBB) to go beyond traditional Bollinger Bands by incorporating both OHLC (Open, High, Low, Close) and Close-based data into the calculations. Instead of relying solely on closing prices, this indicator evaluates deviations from the complete bar range (OHLC), offering a more accurate view of market behavior.
A key feature is the Delta Flip, which highlights shifts between OHLC and Close-based bands. These flips are visually marked with color changes, signaling potential trend reversals, breakout zones, or volatility shifts. Traders can use these moments as inflection points to refine their entry and exit strategies.
The indicator also supports customizable sensitivity and deviation multiplier settings, allowing it to adapt to different trading styles and timeframes. Lower deviation values (e.g., 1σ or 1.5σ) are ideal for scalping on shorter timeframes like 5-min or 15-min charts, while higher values (e.g., 2.5σ or 3σ) are better suited for long-term trend analysis on weekly or monthly charts. The standard deviation multiplier fine-tunes the upper and lower bands to match specific trading goals and market conditions.
I designed Full Spectrum Delta Bands to provide deeper insights and a clearer view of market dynamics compared to traditional Bollinger Bands. Whether you’re a scalper, swing trader, or long-term investor, this tool helps you make informed and confident trading decisions.

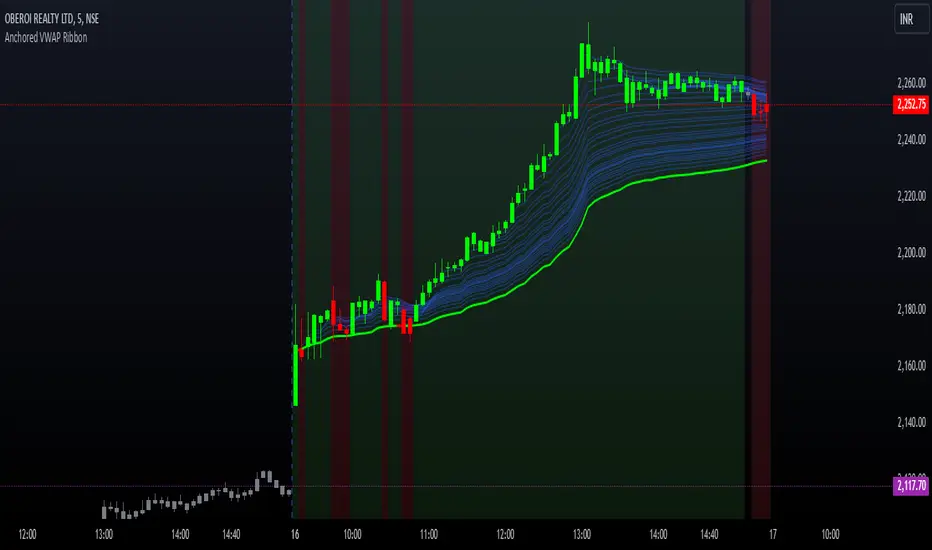
Options Series - Anchored VWAP Ribbon➤ AVWAP On different chart symbols:
⭐ Overview and Key Features:
Anchored VWAP Calculation:
The script implements the Anchored Volume Weighted Average Price (AVWAP), a tool used by professional traders to identify key price levels weighted by volume, starting from a specific timestamp (anchor point).
Bullish and Bearish Analysis:
It determines the dominance of bullish or bearish momentum based on the relationship between the close price and AVWAP levels across multiple time points.
Dynamic Visualization:
The background of the chart changes color based on overall bullish or bearish sentiment, making it easier to interpret market trends.
Multi-Time Anchors:
By defining multiple anchor points (e.g., 09:15, 09:20), the script calculates a series of AVWAP values for fine-grained intraday analysis.
Customizable Inputs:
Users can select the source price (e.g., hlc3), date, and time for AVWAP calculation.
⭐ How It Works and Functionality:
AVWAP Logic:
Uses the timestamp() function to establish a reference (anchor point).
Calculates the cumulative weighted price (price * volume) and cumulative volume from this anchor point.
The ratio of these sums gives the AVWAP, which updates dynamically with new bars.
Bullish and Bearish Signals:
Binary flags (1 or 0) are set for each time point depending on whether the closing price is above or below the AVWAP for that time.
Aggregates these flags into AVWAP_bull and AVWAP_bear to represent the overall market sentiment.
Decision Logic:
Determines final market conditions (bullish or bearish dominance) based on aggregated scores.
Visual feedback (background and bar colors) is applied accordingly.
⭐ Visualizations and User Experience:
Background Colors:
Green or red background highlights the overall sentiment (bullish or bearish), providing a quick market overview.
Bar Coloring:
Bars are color-coded based on bullish, bearish, or neutral conditions, making it easier to identify trends directly on the chart.
AVWAP Levels:
The calculated AVWAP values are plotted as colored lines for each anchor point, giving precise intraday levels of significance.
Bright colors (fluorescent green/red) are used for additional clarity when the close price is above or below these levels.
🎨 Settings and Customization:
Anchor Point:
Fully customizable anchor points allow users to set specific dates and times (e.g., 09:15 on December 13, 2024) for AVWAP calculations.
Source Price:
Users can choose from hlc3, close, or any other price source to calculate the AVWAP, tailoring the indicator to their strategy.
Visual Appearance:
The transparency, colors, and line styles are adjustable, enabling users to customize the chart to match their trading preferences.
Dynamic Signals:
The script accommodates numerous AVWAP levels, providing flexibility for scalpers and swing traders alike.
⭐ Uniqueness of the Concept:
Precise Intraday Analysis:
Unlike static VWAP, this script allows anchoring to specific times during the day, offering granular insights into market behavior.
Cumulative Sentiment Approach:
Aggregates signals across multiple time intervals, providing a comprehensive view of intraday momentum rather than a single-point reference.
Blending AVWAP with Visual Feedback:
Combines traditional AVWAP calculations with visually impactful features like background shading and bar coloring to enhance decision-making.
Scalability:
Supports adding multiple additional anchor points and customization for broader applicability in different market conditions.
🚀 Conclusion:
The Anchored VWAP Ribbon script is a powerful tool for traders seeking to analyze price behavior relative to volume-weighted levels anchored at specific times. It provides a visually intuitive way to assess intraday market sentiment, combining traditional technical indicators with customizable visualization features. The script’s flexibility makes it suitable for a variety of trading styles, from scalping to swing trading, while its unique cumulative sentiment logic sets it apart from conventional VWAP tools.
ICT IPDA Liquidity Matrix By AlgoCadosThe ICT IPDA Liquidity Matrix by AlgoCados is a sophisticated trading tool that integrates the principles of the Interbank Price Delivery Algorithm (IPDA), as taught by The Inner Circle Trader (ICT). This indicator is meticulously designed to support traders in identifying key institutional levels and liquidity zones, enhancing their trading strategies with data-driven insights. Suitable for both day traders and swing traders, the tool is optimized for high-frequency and positional trading, providing a robust framework for analyzing market dynamics across multiple time horizons.
# Key Features
Multi-Time Frame Analysis
High Time Frame (HTF) Levels : The indicator tracks critical trading levels over multiple days, specifically at 20, 40, and 60-day intervals. This functionality is essential for identifying long-term trends and significant support and resistance levels that aid in strategic decision-making for swing traders and positional traders.
Low Time Frame (LTF) Levels : It monitors price movements within 20, 40, and 60-hour intervals on lower time frames. This granularity provides a detailed view of intraday price actions, which is crucial for scalping and short-term trading strategies favored by day traders.
Daily Open Integration : The indicator includes the daily opening price, providing a crucial reference point that reflects the market's initial sentiment. This feature helps traders assess the market's direction and volatility, enabling them to make informed decisions based on the day's early movements, which is particularly useful for day trading strategies.
IPDA Reference Points : By leveraging IPDA's 20, 40, and 60-period lookbacks, the tool identifies Key Highs and Lows, which are used by IPDA as Draw On Liquidity. IPDA is an electronic and algorithmic system engineered for achieving price delivery efficiency, as taught by ICT. These reference points serve as benchmarks for understanding institutional trading behavior, allowing traders to align their strategies with the dominant market forces and recognize institutional key levels.
Dynamic Updates and Overlap Management : The indicator is updated daily at the beginning of a new daily candle with the latest market data, ensuring that traders operate with the most current information. It also features intelligent overlap management that prioritizes the most relevant levels based on the timeframe hierarchy, reducing visual clutter and enhancing chart readability.
Comprehensive Customization Options : Traders can tailor the indicator to their specific needs through an extensive input menu. This includes toggles for visibility, line styles, color selections, and label display preferences. These customization options ensure that the tool can adapt to various trading styles and preferences, enhancing user experience and analytical capabilities.
User-Friendly Interface : The tool is designed with a user-friendly interface that includes clear, concise labels for all significant levels. It supports various font families and sizes, making it easier to interpret and act upon the displayed data, ensuring that traders can focus on making informed trading decisions without being overwhelmed by unnecessary information.
# Usage Note
The indicator is segmented into two key functionalities:
LTF Displays : The Low Time Frame (LTF) settings are exclusive to timeframes up to 1 hour, providing detailed analysis for intraday traders. This is crucial for traders who need precise and timely data to make quick decisions within the trading day.
HTF Displays : The High Time Frame (HTF) settings apply to the daily timeframe and any shorter intervals, allowing for comprehensive analysis over extended periods. This is beneficial for swing traders looking to identify broader trends and market directions.
# Inputs and Configurations
BINANCE:BTCUSDT
Offset: Adjustable setting to shift displayed data horizontally for better visibility, allowing traders to view past levels and make informed decisions based on historical data.
Label Styles: Choose between compact or verbose label formats for different levels, offering flexibility in how much detail is displayed on the chart.
Daily Open Line: Customizable line style and color for the daily opening price, providing a clear visual reference for the start of the trading day.
HTF Levels: Configurable high and low lines for HTF with options for style and color customization, allowing traders to highlight significant levels in a way that suits their trading style.
LTF Levels: Similar customization options for LTF levels, ensuring flexibility in how data is presented, making it easier for traders to focus on the most relevant intraday levels.
Text Utils: Settings for font family, size, and text color, allowing for personalized display preferences and ensuring that the chart is both informative and aesthetically pleasing.
# Advanced Features
Overlap Management : The script intelligently handles overlapping levels, particularly where multiple timeframes intersect, by prioritizing the more significant levels and removing redundant ones. This ensures that the charts remain clear and focused on the most critical data points, allowing traders to concentrate on the most relevant market information.
Real-Time Updates : The indicator updates its calculations at the start of each new daily bar, incorporating the latest market data to provide timely and accurate trading signals. This real-time updating is crucial for traders who rely on up-to-date information to execute their strategies effectively and make informed trading decisions.
# Example Use Cases
Scalpers/Day traders: Can utilize the LTF features to make rapid decisions based on hourly market movements, identifying short-term trading opportunities with precision.
Swing Traders: Will benefit from the HTF analysis to identify broader trends and key levels that influence longer-term market movements, enabling them to capture significant market swings.
By providing a clear, detailed view of key market dynamics, the ICT IPDA Liquidity Matrix by AlgoCados empowers traders to make more informed and effective trading decisions, aligning with institutional trading methodologies and enhancing their market understanding.
# Usage Disclaimer
This tool is designed to assist in trading decisions, but it should be used in conjunction with other analysis methods and risk management strategies. Trading involves significant risk, and it is essential to understand the market conditions thoroughly before making trading decisions.

Hamilton - Wick Length PredictionWick Length Prediction is a Pine Script indicator crafted to empower traders by predicting the potential length and direction of the next candle's wick based on historical price action. By analyzing previous candles' wick sizes, this tool provides valuable foresight into future price dynamics, enhancing decision-making for traders.
Key Features:
Wick Percentage Analysis : Calculates the percentages of the upper and lower wicks from the previous candle relative to its total range, offering a predictive insight into the next wick’s potential direction and size.
Directional Bias Indicator : Identifies the longer wick between the previous candle's upper and lower wicks to suggest a directional bias—green indicates an upward prediction, while red suggests downward.
Targeted Plotting : Marks a horizontal line at the anticipated wick position for the forthcoming candle, aiding traders in identifying potential price rejection zones ahead of time.
Strategic Insights for Traders:
Understanding Market Pressure : Recognizes that wicks typically indicate pressure in the opposite direction of their occurrence, presenting potential targets for price movement towards the opposite side. This insight is invaluable for identifying reversal zones or continuation patterns.
Optimal for Scalping : Especially beneficial for scalpers, this tool helps in pinpointing precise entry and exit points by forecasting where the price might face opposition and potentially reverse or absorb the wick.
Timeframe Flexibility : While best suited for higher timeframes, it also delivers on lower timeframes during aggressive market movements, making it a versatile addition to your trading arsenal.
Application Tips :
Leverage in combination with other indicators and support/resistance levels to refine your trading strategy.
Ideal for enhancing price action analysis, providing a clearer understanding of potential market movements.
Use as a strategic complement to your existing approach, mindful of its predictive nature to inform better trading decisions.
Disclaimer: Trading involves significant risk. This tool aims to support a diversified trading strategy, but it's crucial to perform your own analysis and adopt appropriate risk management practices.

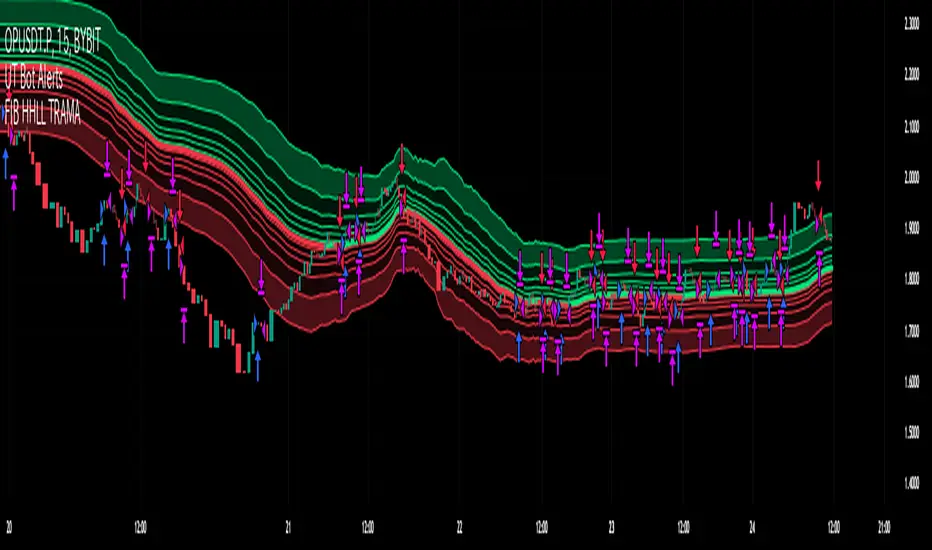
Fibonacci HH LL TRAMA BandLuxAlgo's Trend Moving Adaptive Moving Average was used as a reference to create bands by reading the highest and lowest prices of past bars based on Fibonacci numbers and then multiplying them by the Fibonacci ratio.
LuxAlgo/ LuxAlgo/
In particular, the so-called TRAMA is characterized by its adaptation to the average of the highest and lowest prices over a specific period of time and is used to identify support/resistance.
In order to apply this feature to the maximum extent possible, I used the high or low prices as the source of input, rather than the closing price.
For example,
src = high
not original like
src = close
In addition, I created 6 levels by multiplying the Fibonacci ratio
//Midline
mah = ama1
mal = ama2
m = (mah + mal)/2
//Half Mean Range
dist = (mah - mal)/2
//Levels
h6 = m + dist * 11.089
h5 = m + dist * 6.857
h4 = m + dist * 4.235
h3 = m + dist * 2.618
h2 = m + dist * 1.618
h1 = m + dist * 0.618
l1 = m - dist * 0.618
l2 = m - dist * 1.618
l3 = m - dist * 2.618
l4 = m - dist * 4.235
l5 = m - dist * 6.857
l6 = m - dist * 11.089
If you want to use it for scalping, such as 15 minutes, you can include Fibonacci numbers such as 21,34,55 for a quick reaction type to detect the trend. Also, by including Fibonacci numbers such as 89,144,233, you can see where you stand in the larger trend. Some examples are included below.
For Investors
BTCUSDT 1day Chart Fibonacci number "55"
For Daytraders
BTCUSDT 4hour Chart Fibonacci number "34"
For Scalpers
BTCUSDT 15min Chart Fibonacci number "55"
BTCUSDT 15min Chart Fibonacci number "89"
BTCUSDT 15min Chart Fibonacci number "233"
Fibonacci numbers are 1, 1, 2, 3, 5, 8, 13, 21, 34, 55, 89, 144, 233, 377, 610, etc.,
Fibonacci ratios are 0.618, 1.618, 2.618, 4.236, 6.854, 11.089, etc.,
AFRHi everyone! Sorry for not posting anything for so long again. I will be active in July, after passing my university exams. I bought some S&C magazine archives, so await my new post strategies and indicator in July, as things are gonna get real interesting! But for now let me hand you some new and interesting stuff — AFR indicator.
Actually, this is my third time republishing this indicator after a big timeout because of the battles with TV mods on reference politics (which I lost).
This is indicator was originaly made by some user from other trading website, which I can't mention because of TV reference politics.
Which principles are behind AFR?
First we define our own low and high (OL and OH respectively), which are equal to:
OL = open - ATR * ATR_Factor
OH = open + ATR * ATR_Factor,
where ATR — Average True Range,
ATR_Factor — "Factor" in the settings — multiplier for ATR.
On each tick we remember AFR's value from previous bar, if it is not 0.
When OL is greater then AFR, then AFR is equal to OL. It means that there is probably an uptrend, so we adjust AFR accordingly.
When OH is lower then AFR, then AFR is equal to OH. It means that there is probably a downtrend, so we adjust AFR accordingly.
How to use?
Green AFR — bullish trend.
Red AFR — bearish trend.
Green AFR's triangle up — buy signal — appears when AFR changes it's colour from red to green.
Red AFR's triangle down— sell signal — appears when AFR changes it's colour from green to red.
ALERTS INCLUDED!
My personal ecommendations
- You can AFR as a tool to find short-term and middle-term trends, as it does it's best to find such trends;
- If are a scalper, then you probably should try AFR on low factor settings, as AFR alone can find good scalping entries.
- As AFR is a trend indicator, please use it with other confirmation indicator to make better entries.
Hope you will find this script useful.
Take your profits!
- Tarasenko Fyodor

Physics CandlesPhysics Candles embed volume and motion physics directly onto price candles or market internals according to the cyclic pattern of financial securities. The indicator works on both real-time “ticks” and historical data using statistical modeling to highlight when these values, like volume or momentum, is unusual or relatively high for some periodic window in time. Each candle is made out of one or more sub-candles that each contain their own information of motion, which converts to the color and transparency, or brightness, of that particular candle segment. The segments extend throughout the entire candle, both body and wicks, and Thick Wicks can be implemented to see the color coding better. This candle segmentation allows you to see if all the volume or energy is evenly distributed throughout the candle or highly contained in one small portion of it, and how intense these values are compared to similar time periods without going to lower time frames. Candle segmentation can also change a trader’s perspective on how valuable the information is. A “low” volume candle, for instance, could signify high value short-term stopping volume if the volume is all concentrated in one segment.
The Candles are flexible. The physics information embedded on the candles need not be from the same price security or market internal as the chart when using the Physics Source option, and multiple Candles can be overlayed together. You could embed stock price Candles with market volume, market price Candles with stock momentum, market structure with internal acceleration, stock price with stock force, etc. My particular use case is scalping the SPX futures market (ES), whose price action is also dictated by the volume action in the associated cash market, or SPY, as well as a host of other securities. Physics allows you to embed the ES volume on the SPY price action, or the SPY volume on the ES price action, or you can combine them both by overlaying two Candle streams and increasing the Number of Overlays option to two. That option decreases the transparency levels of your coloring scheme so that overlaying multiple Candles converges toward the same visual color intensity as if you had one. The Candle and Physics Sources allows for both Symbols and Spreads to visualize Candle physics from a single ticker or some mathematical transformation of tickers.
Due to certain TradingView programming restrictions, each Candle can only be made out of a maximum of 8 candle segments, or an “8-bit” resolution. Since limits are just an opportunity to go beyond, the user has the option to stack multiple Candle indicators together to further increase the candle resolution. If you don’t want to see the Candles for some particular period of the day, you can hide them, or use the hiding feature to have multiple Candles calibrated to show multiple parts of the trading day. Securities tend to have low volume after hours with sharp spikes at the open or close. Multiple Candles can be used for multiple parts of the trading day to accommodate these different cycles in volume.
The Candles do not need be associated with the nominal security listed on the TV chart. The Candle Source allows the user to look at AAPL Candles, for instance, while on a TSLA or SPY chart, each with their respective volume actions integrated into the candles, for instance, to allow the user to see multiple security price and volume correlation on a single chart.
The physics information currently embeddable on Candles are volume or time, velocity, momentum, acceleration, force, and kinetic energy. In order to apply equations of motion containing a mass variable to financial securities, some analogous value for mass must be assumed. Traders often regard volume or time as inextricable variables to a securities price that can indicate the direction and strength of a move. Since mass is the inextricable variable to calculating the momentum, force, or kinetic energy of motion, the user has the option to assume either time or volume is analogous to mass. Volume may be a better option for mass as it is not strictly dependent on the speed of a security, whereas time is.
Data transformations and outlier statistics are used to color code the intensity of the physics for each candle segment relative to past periodic behavior. A million shares during pre-market or a million shares during noontime may be more intense signals than a typical million shares traded at the open, and should have more intense color signals. To account for a specific cyclic behavior in the market, the user can specify the Window and Cycle Time Frames. The Window Time Frame splits up a Cycle into windows, samples and aggregates the statistics for each window, then compares the current physics values against past values in the same window. Intraday traders may benefit from using a Daily Cycle with a 30-minute Window Time Frame and 1-minute Sample Time Frame. These settings sample and compare the physics of 1-minute candles within the current 30-minute window to the same 30-minute window statistics for all past trading days, up until the data limit imposed by TradingView, or until the Data Collection Start Date specified in the settings. Longer-term traders may benefit from using a Monthly Cycle with a Weekly Time Frame, or a Yearly Cycle with a Quarterly Time Frame.
Multiple statistics and data transformation methods are available to convey relative intensity in different ways for different trading signals. Physics Candles allows for both Normal and Log-Normal assumptions in the physics distribution. The data can then be transformed by Linear, Logarithmic, Z-Score, or Power-Law scoring, where scoring simply assigns an intensity to the relative physics value of each candle segment based on some mathematical transformation. Z-scoring often renders adequate detection by scoring the segment value, such as volume or momentum, according to the mean and standard deviation of the data set in each window of the cycle. Logarithmic or power-law transformation with a gamma below 1 decreases the disparity between intensities so more less-important signals will show up, whereas the power-law transformation with gamma values above 1 increases the disparity between intensities, so less more-important signals will show up. These scores are then converted to color and transparency between the Min Score and the Max Score Cutoffs. The Auto-Normalization feature can automatically pick these cutoffs specific to each window based on the mean and standard deviation of the data set, or the user can manually set them. Physics was developed with novices in mind so that most users could calibrate their own settings by plotting the candle segment distributions directly on the chart and fiddling with the settings to see how different cutoffs capture different portions of the distribution and affect the relative color intensities differently. Security distributions are often skewed with fat-tails, known as kurtosis, where high-volume segments for example, have a higher-probabilities than expected for a normal distribution. These distribution are really log-normal, so that taking the logarithm leads to a standard bell-shaped distribution. Taking the Z-score of the Log-Normal distribution could make the most statistical sense, but color sensitivity is a discretionary preference.
Background Philosophy
This indicator was developed to study and trade the physics of motion in financial securities from a visually intuitive perspective. Newton’s laws of motion are loosely applied to financial motion:
“A body remains at rest, or in motion at a constant speed in a straight line, unless acted upon by a force”.
Financial securities remain at rest, or in motion at constant speed up or down, unless acted upon by the force of traders exchanging securities.
“When a body is acted upon by a force, the time rate of change of its momentum equals the force”.
Momentum is the product of mass and velocity, and force is the product of mass and acceleration. Traders render force on the security through the mass of their trading activity and the acceleration of price movement.
“If two bodies exert forces on each other, these forces have the same magnitude but opposite directions.”
Force arises from the interaction of traders, buyers and sellers. One body of motion, traders’ capitalization, exerts an equal and opposite force on another body of motion, the financial security. A securities movement arises at the expense of a buyer or seller’s capitalization.
Volume
The premise of this indicator assumes that volume, v, is an analogous means of measuring physical mass, m. This premise allows the application of the equations of motion to the movement of financial securities. We know from E=mc^2 that mass has energy. Energy can be used to create motion as kinetic energy. Taking a simple hypothetical example, the interaction of one short seller looking to cover lower and one buyer looking to sell higher exchange shares in a security at an agreed upon price to create volume or mass, and therefore, potential energy. Eventually the short seller will actively cover and buy the security from the previous buyer, moving the security higher, or the buyer will actively sell to the short seller, moving the security lower. The potential energy inherent in the initial consolidation or trading activity between buy and seller is now converted to kinetic energy on the subsequent trading activity that moves the securities price. The more potential energy that is created in the consolidation, the more kinetic energy there is to move price. This is why point and figure traders are said to give price targets based on the level of volatility or size of a consolidation range, or why Gann traders square price and time, as time is roughly proportional to mass and trading activity. The build-up of potential energy between short sellers and buyers in GME or TSLA led to their explosive moves beyond their standard fundamental valuations.
Position
Position, p, is simply the price or value of a financial security or market internal.
Time
Time, t, is another means of measuring mass to discover price behavior beyond the time snapshots that simple candle charts provide. We know from E=mc^2 that time is related to rest mass and energy given the speed of light, c, where time ≈ distance * sqrt(mass/E). This relation can also be derived from F=ma. The more mass there is, the longer it takes to compute the physics of a system. The more energy there is, the shorter it takes to compute the physics of a system. Similarly, more time is required to build a “resting” low-volatility trading consolidation with more mass. More energy added to that trading consolidation by competing buyers and sellers decreases the time it takes to build that same mass. Time is also related to price through velocity.
Velocity = (p(t1) – p(t0)) / p(t0)
Velocity, v, is the relative percent change of a securities price, p, over a period of time, t0 to t1. The period of time is between subsequent candles, and since time is constant between candles within the same timeframe, it is not used to calculate velocity or acceleration. Price moves faster with higher velocity, and slower with slower velocity, over the same fixed period of time. The product of velocity and mass gives momentum.
Momentum = mv
This indicator uses physics definition of momentum, not finance’s. In finance, momentum is defined as the amount of change in a securities price, either relative or absolute. This is definition is unfortunate, pun intended, since a one dollar move in a security from a thousand shares traded between a few traders has the exact same “momentum” as a one dollar move from millions of shares traded between hundreds of traders with everything else equal. If momentum is related to the energy of the move, momentum should consider both the level of activity in a price move, and the amount of that price move. If we equate mass to volume to account for the level of trading activity and use physics definition of momentum as the product of mass and velocity, this revised definition now gives a thousand-times more momentum to a one-dollar price move that has a thousand-times more volume behind it. If you want to use finance’s volume-less definition of momentum, use velocity in this indicator.
Acceleration = v(t1) – v(t0)
Acceleration, a, is the difference between velocities over some period of time, t0 to t1. Positive acceleration is necessary to increase a securities speed in the positive direction, while negative acceleration is necessary to decrease it. Acceleration is related to force by mass.
Force = ma
Force is required to change the speed of a securities valuation. Price movements with considerable force have considerably more impact on future direction. A change in direction requires force.
Kinetic Energy = 0.5mv^2
Kinetic energy is the energy that a financial security gains from the change in its velocity by force. The built-up of potential energy in trading consolidations can be converted to kinetic energy on a breakout from the consolidation.
Cycle Theory and Relativity
Just as the physics of motion is relative to a point of reference, so too should the physics of financial securities be relative to a point of reference. An object moving at a 100 mph towards another object moving in the same direction at 100 mph will not appear to be moving relative to each other, nor will they collide, but from an outsider observer, the objects are going 100 mph and will collide with significant impact if they run into a stationary object relative to the observer. Similarly, trading with a hundred thousand shares at the open when the average volume is a couple million may have a much smaller impact on the price compared to trading a hundred thousand shares pre-market when the average volume is ten thousand shares. The point of reference used in this indicator is the average statistics collected for a given Window Time Frame for every Cycle Time Frame. The physics values are normalized relative to these statistics.
Examples
The main chart of this publication shows the Force Candles for the SPY. An intense force candle is observed pre-market that implicates the directional overtone of the day. The assumption that direction should follow force arises from physical observation. If a large object is accelerating intensely in a particular direction, it may be fair to assume that the object continues its direction for the time being unless acted upon by another force.
The second example shows a similar Force Candle for the SPY that counters the assumption made in the first example and emphasizes the importance of both motion and context. While it’s fair to assume that a heavy highly accelerating object should continue its course, if that object runs into an obstacle, say a brick wall, it’s course may deviate. This example shows SPY running into the 50% retracement wall from the low of Mar 2020, a significant support level noted in literature. The example also conveys Gann’s idea of “lost motion”, where the SPY penetrated the 50% price but did not break through it. A brick wall is not one atom thick and price support is not one tick thick. An object can penetrate only one layer of a wall and not go through it.
The third example shows how Volume Candles can be used to identify scalping opportunities on the SPY and conveys why price behavior is as important as motion and context. It doesn’t take a brick wall to impede direction if you know that the person driving the car tends to forget to feed the cats before they leave. In the chart below, the SPY breaks down to a confluence of the 5-day SMA, 20-day SMA, and an important daily trendline (not shown) after the bullish bounce from the 50% retracement days earlier. High volume candles on the SMA signify stopping volume that reverse price direction. The character of the day changes. Bulls become more aggressive than bears with higher volume on upswings and resistance, whiles bears take on a defensive position with lower volume on downswings and support. High volume stopping candles are seen after rallies, and can tell you when to take profit, get out of a position, or go short. The character change can indicate that its relatively safe to re-enter bullish positions on many major supports, especially given the overarching bullish theme from the large reaction off the 50% retracement level.
The last example emphasizes the importance of relativity. The Volume Candles in the chart below are brightest pre-market even though the open has much higher volume since the pre-market activity is much higher compared to past pre-markets than the open is compared to past opens. Pre-market behavior is a good indicator for the character of the day. These bullish Volume Candles are some of the brightest seen since the bounce off the 50% retracement and indicates that bulls are making a relatively greater attempt to bring the SPY higher at the start of the day.
Infrequently Asked Questions
Where do I start?
The default settings are what I use to scalp the SPY throughout most of the extended trading day, on a one-minute chart using SPY volume. I also overlay another Candle set containing ES future volume on the SPY price structure by setting the Physics Source to ES1! and the Number of Overlays setting to 2 for each Candle stream in order to account for pre- and post-market trading activity better. Since the closing volume is exponential-like up until the end of the regular trading day, adding additional Candle streams with a tighter Window Time Frame (e.g., 2-5 minute) in the last 15 minutes of trading can be beneficial. The Hide feature can allow you to set certain intraday timeframes to hide one Candle set in order to show another Candle set during that time.
How crazy can you get with this indicator?
I hope you can answer this question better. One interesting use case is embedding the velocity of market volume onto an internal market structure. The PCTABOVEVWAP.US is a market statistic that indicates the percent of securities above their VWAP among US stocks and is helpful for determining short term trends in the US market. When securities are rising above their VWAP, the average long is up on the day and a rising PCTABOVEVWAP.US can be viewed as more bullish. When securities are falling below their VWAP, the average short is up on the day and a falling PCTABOVEVWAP.US can be viewed as more bearish. (UPVOL.US - DNVOL.US) / TVOL.US is a “spread” symbol, in TV parlance, that indicates the decimal percent difference between advancing volume and declining volume in the US market, showing the relative flow of volume between stocks that are up on the day, and stocks that are down on the day. Setting PCTABOVEVWAP.US in the Candle Source, (UPVOL.US - DNVOL.US) / TVOL.US in the Physics Source, and selecting the Physics to Velocity will embed the relative velocity of the spread symbol onto the PCTABOVEVWAP.US candles. This can be helpful in seeing short term trends in the US market that have an increasing amount of volume behind them compared to other trends. The chart below shows Volume Candles (top) and these Spread Candles (bottom). The first top at 9:30 and second top at 10:30, the high of the day, break down when the spread candles light up, showing a high velocity volume transfer from up stocks to down stocks.
How do I plot the indicator distribution and why should I even care?
The distribution is visually helpful in seeing how different normalization settings effect the distribution of candle segments. It is also helpful in seeing what physics intensities you want to ignore or show by segmenting part of the distribution within the Min and Max Cutoff values. The intensity of color is proportional to the physics value between the Min and Max Cutoff values, which correspond to the Min and Max Colors in your color scheme. Any physics value outside these Min and Max Cutoffs will be the same as the Min and Max Colors.
Select the Print Windows feature to show the window numbers according to the Cycle Time Frame and Window Time Frame settings. The window numbers are labeled at the start of each window and are candle width in size, so you may need to zoom into to see them. Selecting the Plot Window feature and input the window number of interest to shows the distribution of physics values for that particular window along with some statistics.
A log-normal volume distribution of segmented z-scores is shown below for 30-minute opening of the SPY. The Min and Max Cutoff at the top of the graph contain the part of the distribution whose intensities will be linearly color-coded between the Min and Max Colors of the color scheme. The part of the distribution below the Min Cutoff will be treated as lowest quality signals and set to the Min Color, while the few segments above the Max Cutoff will be treated as the highest quality signals and set to the Max Color.
What do I do if I don’t see anything?
Troubleshooting issues with this indicator can involve checking for error messages shown near the indicator name on the chart or using the Data Validation section to evaluate the statistics and normalization cutoffs. For example, if the Plot Window number is set to a window number that doesn’t exist, an error message will tell you and you won’t see any candles. You can use the Print Windows option to show windows that do exist for you current settings. The auto-normalization cutoff values may be inappropriate for your particular use case and literally cut the candles out of the chart. Try changing the chart time frame to see if they are appropriate for your cycle, sample and window time frames. If you get a “Timeframe passed to the request.security_lower_tf() function must be lower than the timeframe of the main chart” error, this means that the chart timeframe should be increased above the sample time frame. If you get a “Symbol resolve error”, ensure that you have correct symbol or spread in the Candle or Physics Source.
How do I see a relative physics values without cycles?
Set the Window Time Frame to be equal to the Cycle Time Frame. This will aggregate all the statistics into one bucket and show the physics values, such as volume, relative to all the past volumes that TV will allow.
How do I see candles without segmentation?
Segmentation can be very helpful in one context or annoying in another. Segmentation can be removed by setting the candle resolution value to 1.
Notes
I have yet to find a trading platform that consistently provides accurate real-time volume and pricing information, lacking adequate end-user data validation or quality control. I can provide plenty of examples of real-time volume counts or prices provided by TradingView and other platforms that were significantly off from what they should have been when comparing against the exchanges own data, and later retroactively corrected or not corrected at all. Since no indicator can work accurately with inaccurate data, please use at your own discretion.
The first version is a beta version. Debugging and validating code in Pine script is difficult without proper unit testing. Please report any bugs with enough information to reproduce them and indicate why they are important. I also encourage you to export the data from TradingView and verify the calculations for your particular use case.
The indicator works on real-time updates that occur at a higher frequency than the candle time frame, which TV incorrectly refers to as ticks. They use this terminology inaccurately as updates are really aggregated tick data that can take place at different prices and may not accurately reflect the real tick price action. Consequently, this inaccuracy also impacts the real-time segmentation accuracy to some degree. TV does not provide a means of retaining “tick” information, so the higher granularity of information seen real-time will be lost on a disconnect.
TV does not provide time and sales information. The volume and price information collected using the Sample Time Frame is intraday, which provides only part of the picture. Intraday volume is generally 50 to 80% of the end of day volume. Consequently, the daily+ OHLC prices are intraday, and may differ significantly from exchanged settled OHLC prices.
The Cycle and Window Time Frames refer to calendar days and time, not trading days or time. For example, the first window week of a monthly cycle is the first seven days of the month, not the first Monday through Friday of trading for the month.
Chart Time Frames that are higher than the Window Time Frames average the normalized physics for price action that occurred within a given Candle segment. It does not average price action that did not occur.
One of the main performance bottleneck in TradingView’s Pine Script is client-side drawing and plotting. The performance of this indicator can be increased by lowering the resolution (the number of sub-candles this indicator plots), getting a faster computer, or increasing the performance of your computer like plugging your laptop in and eliminating unnecessary processes.
The statistical integrity of this indicator relies on the number of samples collected per sample window in a given cycle. Higher sample counts can be obtained by increasing the chart time frame or upgrading the TradingView plan for a higher bar count. While increasing the chart time frame doesn’t increase the visual number of bars plotted on the chart, it does increase the number of bars that can be pulled at a lower time frame, up to 100,000.
Due to a limitation in Pine Scripts request_lower_tf() function, using a spread symbol will only work for regular trading hours, not extended trading hours.
Ideally, velocity or momentum should be calculated between candle closes. To eliminate the need to deal with price gaps that would lead to an incorrect statistical distributions, momentum is calculated between candle open and closes as a percent change of the price or value, which should not be an issue for most liquid securities.

MTF TMOTMO - (T)rue (M)omentum (O)scillator) MTF (Higher Aggregation) Version
TMO calculates momentum using the DELTA of price. Giving a much better picture of the trend, reversals & divergences than most momentum oscillators using price. Aside from the regular TMO, this study combines four different TMO aggregations into one indicator for an even better picture of the trend. Once you look deeper into this study you will realize how complex this tool is. This version also produce much more information like crosses, divergences, overbought / oversold signals, higher aggregation fades etc. It is probably not even possible to explain them all, there could easily be an entire e-book about this study.
I have been using this tool for a couple of years now, and this is what i have learned so far:
Favorite Time Frame Variations:
1. 1m / 5m / 30m - Great for intraday futures or options scalps. 30m TMO serves as the overall trend gauge for the day. 5min dictates the longer term intraday moves as well as direction of the 1min. 1min is for the scalps. When the 5min TMO is sloping higher focus should be on 1min buy signals (red to green cross) and vice versa for the 5min agg. sloping down.
2. 5m / 30m / 60m - Also an interesting variation for day trading the 3-5 min charts. Producing more cleaner & beginner-friendly signals that lasts couple of minutes instead of seconds.
3. 120m / Day / 2 Day - For the 30m to 1H or 2H timeframes. Daily & 2 Day dictates the overall trend. 120 min for the signals. Great for a multi-day swings.
4. Day / 2 Day / Week - Good for the daily charts, swing trading analysis as the weekly dictates the overall trend, daily dictates the signals and the 2 day cleans out the daily signals. If the daily & 2 day are not aligned togather, daily signal means nothing. Weekly dictates 2 day - 2 day dictates daily.
5. Week / Month / 3 Month - Same thing as the previous variation but for the weekly charts.
TMO Length:
The default vanilla settings are 14,5,3. Some traders prefer 21,5,3 as the TMO length is litle higher = TMO will potenially last little longer which could teoretically produce less false signals but slower crosses which means signals will lag more behind price. The lower the length, the faster the oscillator oscillates. It is the noice vs. the lag debate. The Length can be changed, but i would not personally touch the other two. Few points up or down on length will not drastically change much. But changes on Calc Length and Smooth Length can produce totally different signals from the original.
Tips & Tricks:
1. Observe
- This is the best tip & trick I can give you. The #1 best way to learn how any study operates is to just observe how it works in certain situations from the past. MTF TMO is not
an exception.
2. The Power of the Higher Aggregation
- The higher aggregation ALWAYS dictates the lower one. Best way to see this? Just 2x the current timeframe aggregation = so on daily chart, plot the daily & two day TMOs and you will notice how the higher agg. smooths out the current agg. The higher the aggregation is, the smoother (but slower) will the TMO turn. The real power kicks in when the 3 or 4 aggregations are aligned togather in one direction.
3. Position of the Higher Aggregation in Relation to the Extremes
- Overbought / oversold signals might not really work on the current aggregation. But pay attention to the higher aggregations in relation to the extremes. Ex: on the daily chart - daily TMO inside the OB / OS extremes might not mean much. But once the higher aggregations such as 3 day or Weekly TMO enters OB/OS zone togather with the daily, this can be a very powerful signal for a TMO reversion to the zeroline.
4. Crosses
- Yes, crosses do work. Personally, I never really focused on them. The thing about the crosses is that it is crucial to pick the right higher aggregation to the combination of the current one that would be reliable but also print enough signals. The closer the cross is to the OB / OS extremes, the more bigger move can occur. Crosses around the zero line can be considered as less quality crosses.
5. Divergences
- TMO can print awesome divergences. The best divergences are on the current aggregation (TMO agg. same as the chart) since the current agg. oscillates fast, it can usually produce lower lows & higher highs faster then any higher aggregations. Easy setup: wait for the higher aggregation to reach the OB / OS extremes and watch the current (chart) aggregation to print a divergence.
6. Three is Enough
- I personally find more than three aggregations messy and hard to read. But there is always the option to turn on the 4th one. Just switch the TMO 4 Main, TMO 4 Signal and TMO 4 Fill in the style settings.
Hope it helps.

EBB & Flow: a multi-EMA-based BB cloudIntro
This is an idea evolved out of the market maker method and EMA convergence, divergence, and mean reversion.
The market maker method informs us that the 5, 13, 50 and 200 EMAs are important to regulating price. Those EMA lengths are multiples of the 50 and 200 on lower major timeframes -- the 1 minute, 5, 15, 1H, 4H, 1D. I include the 21 because it is also a multiple and in crypto very often respected.
When market makers are testing price, they set their range and spike in the direction they test for liquidity. This can get chaotic. For instance, in a shorter time frame consolidation inside a bigger timeframe uptrend, it can be too easy to forget where you are in the many trends playing out.
When the EMAs are dragged over each other during normal price movement, you get these crisscrossing tracks of price, and the individual breaks can be hard to trace.
The range is what matters, ultimately, and the range is dynamic. In that case, the Bollinger Band is a great tool for detecting outliers in this case.
The Answer
So the answer this indicator seeks to give, is to look for outliers. This gives you a scalping strategy built on Traders Reality thinking and best put together with the PVSRA indicator, which I may include in this indicator just for the sake of concision, but they can work alongside each other or separately.
The key thing is the different EMA clouds, which are bollinger bands. Tight bands mean imminent breaks, favouring the trend. Vector candles out of a zone, pins to the low/high, etc. are all very relevant alongside this indicator.
You can also use it on its own and scalp the breaks of a cloud.
How it works
Each cloud is a standard deviation from their respective EMA, all in the same colour. The deviation multiple is 1.618 by default. Yes, fibonacci sequences are usually nonsense, but it works better with the BB than 2, 2.5 or 3.
Using just the clouds, you can see where each EMA is headed and how it behaves within the deviation of the others.
But that on its own isn't enough.
The indicator will also print snowflakes above and below the candle for notable outliers. It will be in the colour of the cloud it breaks, but only if that break is also breaking the smaller EMA clouds too.
The most snowflakes will be yellow because that's the 13 EMA. That one is dependent on nothing else and every break will print a snowflake. The 21 will be dependent on the 13. The 50 dependent on the 13 and 21 breaks. The 200 the most important.
For example, if the 200 EMA-BB or EBB is broken at the upper band, deviating by more than 162% of price over a 200 period EMA, and that break is not above the 50 EMA cloud, there will be no snowflake. However, if it exceeds the 13, 21, 50, and 200 clouds, then a purple snowflake will appear above the bar.
Any snowflake is an extreme in price. The purple is an especially good point of entry. That doesn't mean it is a perfect entry. You can build position from it, though, and be relatively certain of a price correction in the near future, because not only was this major EMA cloud violated, but all of the smaller ones too.
Reminder
You still need your PVSRA and candlesticks. This indicator on its own may have a nice hit rate for scalping and building position, as an alternative to the TDI or alongside it, but it is not enough on its own, just like the TDI.
Enjoy!

Safe Scalpy Stop Loss. Percentage from price visualizer.This is my first script I have published so bear with me.
I have thrown this together so you can easily see on the chart where -0.5%, -1% and -2% would be from the last candle close. I also replicated these to show positive values in case you are shorting.
I have also added a custom value setting so you can set the line at whatever percentage value you like and included an adjustable recent higher high and higher low finder to help create a recent range as it seems to work well in tandem for scalping range based price movement.
You can turn all these things on and off in the settings on the style checkboxes.
I felt the need to make this because I like to scalp trade with leverage like a total degen from time to time. Often the setups happen very quickly. It is difficult to calculate where to set a stop loss in a hurry so I keep a fixed account size/lev and just vary the position percentage size based on the percentage of the stop loss from the current price.
Sometimes when switching from a lower volatility chart to high volatility one it is easy to get caught out by quickly entering a scalp trade only to find you made your position way too big or you shouldn't have entered at all. You thought it was only moving 0.2% per candle instead of 3%. Whoops. Rekt.
This indicator is all about trying to help me avoid that with a visual clue to back up the bad maths I do quickly in my head.
I often hide it and only show it when I'm ready to enter a position to double check my SL and entry are set in a sensible area.
I thought I would publish it in case someone else finds such a simple tool handy.
Apologies if there is already something out there that does this job. I couldn't find it.
See you all on the moon.

Multiple Time Frame Williams Alligator H1M5fractalist scalpers, chaos theorists and traders trading on 5 minute charts in the financial markets are often swamped by too many fractals; switching between charts back and forth can be a headache too; so here's an indicator script coded by yours truly to make our lives easier.
how it works?
apply MTFWA on a 5 minute chart; synchronise it with your 1 hour chart; draw the standard horizontal lines to mark fractals on your 1 hour chart...there you go; better fractals filtered to analyse your 5 minute chart; scalp your hearts out.
Predator UAV🛩️ Predator UAV — Indicator Overview
Predator UAV is a multi-module market structure & execution assistant.
Think of it as 4 sensors on a drone, each scanning a different layer of price:
Module What it Sees Why it Matters
Module 1 Swing Structure (ZigZag) Trend direction & key levels
Module 2 FVGs, Imbalances, Targets, D/W/M levels Liquidity & objectives
Module 3 Swing Labels + Candle Patterns Entry timing & confirmation
Module 4 VWAP + Slope Dashboard Intraday bias & strength
You can turn any module ON/OFF independently.
🧩 MODULE 1 — ZigZag Swing High / Low (Market Structure)
What it does
Detects Swing Highs (HH / LH) and Swing Lows (HL / LL)
Draws:
Horizontal structure levels
ZigZag connections
Broken vs respected levels
Shows current swing direction in a mini table
How to use it
Bullish structure → higher lows forming
Bearish structure → lower highs forming
Best used for:
Bias filtering
Stop placement
Avoiding counter-trend trades
💡 Pro tip:
If price breaks a swing level and holds → structure shift confirmed.
🧱 MODULE 2 — FVGs, Imbalances, Targets & HTF Levels (Liquidity Engine)
This is the core execution intelligence.
A️⃣ Fair Value Gaps (FVGs)
Bullish FVG → price inefficiency below price
Bearish FVG → inefficiency above price
Options:
Extend none / limited / default
Limit number on chart
Show midpoint equilibrium
Usage
Price returning into FVG = high-probability reaction zone
Best entries = FVG + structure + VWAP bias
B️⃣ Imbalances
Based on strong displacement candles
Shows where price moved too fast
Usage
Often aligns with:
Breakouts
Stop runs
Momentum continuation
C️⃣ Swing Targets
Automatically marks next logical target
Swing Highs for longs
Swing Lows for shorts
Usage
Use as:
Take-profit zones
Partial exits
Trail stop reference
D️⃣ Previous Day / Week / Month Highs & Lows
Institutional liquidity magnets
Extremely effective on indices & forex
Usage
Expect:
Rejections
Stop hunts
Reversals near these levels
🔍 MODULE 3 — Swing Labels + Candle Patterns (Entry Timing)
This module answers: WHEN to enter?
Swing Labels
HH / HL / LH / LL printed directly on chart
Candle Patterns Detected
Hammer
Inverted Hammer
Bullish Engulfing
Bearish Engulfing
Hanging Man
Shooting Star
Each label includes:
Pattern name
Tooltip explanation (educational)
Usage
Never trade patterns alone
Best when combined with:
FVG
VWAP
Structure level
📐 MODULE 4 — VWAP with Slope Dashboard (Bias & Strength)
This is your intraday compass.
What it shows
Session VWAP
VWAP slope (numeric + angle)
Direction:
↗ Bullish
↘ Bearish
→ Neutral
Strength:
Weak
Moderate
Strong
How to read it
Above VWAP + positive slope → long bias
Below VWAP + negative slope → short bias
Flat slope → scalp only or wait
💡 Pro tip:
Strong VWAP slope + FVG pullback = A-grade setup.
🎯 COMPLETE TRADING TUTORIAL (Step-by-Step)
Step 1 — Determine Bias
Use Module 1 + Module 4
Structure bullish?
VWAP slope bullish?
✅ If aligned → look for longs
❌ If mixed → reduce size or wait
Step 2 — Identify POI (Point of Interest)
Use Module 2
Bullish:
Bullish FVG
Prior swing low
VWAP pullback
Bearish:
Bearish FVG
Prior swing high
VWAP rejection
Step 3 — Wait for Entry Confirmation
Use Module 3
Look for:
Engulfing
Hammer / Shooting star
Swing HL / LH confirmation
Step 4 — Define Targets
Use Next Target
Or Previous Day / Week Highs
Partial TP near first liquidity pool
Step 5 — Risk Management
SL beyond:
FVG boundary
Swing high/low
Trail using:
VWAP
Structure breaks
🧠 Best Timeframes
Purpose TF
Bias 15m / 30m
Setup 5m
Entry 1m–3m
Scalping VWAP + FVG only
⚠️ Common Mistakes to Avoid
❌ Trading every FVG
❌ Ignoring VWAP slope
❌ Counter-trend without confirmation
❌ Overloading chart (turn unused modules off)
🚀 Final Thought
Predator UAV is not a signal generator.
It’s a decision-support system — when multiple modules align, probability shifts in your favor.

Funnelzon Graded Buy and Sell Signals (LITE) MFI MTFFunnelzon Buy and Sell Signals (EMA Zones) – LITE is a lightweight overlay indicator built for scalping and short-term trading. It generates BUY/SELL signals, grades each signal (A+ to F), and provides a clean Confirmation Box that summarizes multi-timeframe context so you can make faster, more structured decisions.
How it works
Signal Engine (LTF)
Signals are triggered using an ATR-based “scalp helper” logic with adjustable sensitivity.
A stop-state system helps reduce repeated or noisy entries.
Signal Scoring & Grades (A+ → F)
When a signal appears, it is evaluated by a context pipeline that considers:
Adaptive momentum/flow (AMF)
ALMA trend alignment
Support/Resistance proximity
Swing structure behavior
Market regime / trend strength (ADX-based)
The result is a score mapped to a grade:
A+ / A = strongest signals
B / C = mixed conditions
D / F = low-quality conditions
Optional Filters
MFI Filter: Helps avoid signals that do not meet Money Flow conditions.
HTF Confirmation (MTF): Uses HTF1 and HTF2 bias. Choose strict filtering or soft alignment.
Confirmation Box (Dashboard)
The box displays:
HTF State: Trend Long / Trend Short / HTF Conflict / Neutral
Market Mode: Trend / Pullback / Conflict
Trade Bias: Long-only / Short-only / Wait
ENTRY NOW? = “YES” when HTF bias and LTF signal align
MFI status + HTF1/HTF2 direction
Optional Structure Tools
EMA overlays: 9 / 12 / 20 / 50 / 100 / 200
Auto Supply/Demand zones (pivot-based, ATR thickness, configurable extension and limits)
Best practices (recommended workflow)
Prefer trading A+ / A signals only.
Trade in the direction of HTF State when possible.
If Market Mode shows PULLBACK or CONFLICT, reduce risk or wait for better alignment.
Use Supply/Demand zones and EMAs for structure (targets, invalidation, and bias).
Important: Confirmation with Stochastic + MACD
This script is a signal + context tool, not a guarantee. To validate signal confirmation, it is strongly recommended to use:
Stochastic Oscillator (momentum/exhaustion confirmation)
MACD (trend momentum and direction confirmation)
Only take trades when the script signal and your confirmation indicators agree.
Alerts
Includes alert conditions for:
Buy Signal
Sell Signal
Any Signal
ENTRY NOW (HTF + LTF aligned)
ENTRY NOW Long / ENTRY NOW Short
Disclaimer
This indicator is for educational purposes and does not constitute financial advice. Always backtest, manage risk, and confirm signals with your own rules.

10 Youtube Opening Range Strategies + Backtest 1. Quick Flip Scalper
A strategy centered on fading or following the initial move relative to the Opening Range (OR).
LONG Rules:
Reversal Mode: If the Opening Range is Bearish (Red), enter Long when price drops below the Opening Range Low (ORL).
Continuity Mode: If the Opening Range is Bullish (Green), enter Long when price drops below the Opening Range Low (ORL) (Buying the deep pullback/trap).
SHORT Rules:
Reversal Mode: If the Opening Range is Bullish (Green), enter Short when price breaks above the Opening Range High (ORH).
Continuity Mode: If the Opening Range is Bearish (Red), enter Short when price breaks above the Opening Range High (ORH) (Selling the deep pullback/trap).
2. First Candle Scalper
Identical to the Quick Flip Scalper but restricts entries to the very first retest only.
LONG Rules:
Same as Quick Flip Long, but only triggers once per session.
SHORT Rules:
Same as Quick Flip Short, but only triggers once per session.
3. Smart Money Trap (SMT)
Identifies a "fakeout" breakout followed immediately by a reversal candlestick pattern.
LONG Rules:
Condition: The previous candle low was below the ORL, but the candle closed back inside (above ORL).
Trigger: Must have a Bullish Engulfing or Bullish Rejection pattern closing above the ORL.
SHORT Rules:
Condition: The previous candle high was above the ORH, but the candle closed back inside (below ORH).
Trigger: Must have a Bearish Engulfing or Bearish Rejection pattern closing below the ORH.
4. Trident Pattern (TG Capital)
A London-session exclusive strategy requiring a Fair Value Gap (FVG) and a Doji confirmation.
LONG Rules:
Filter: Price is Above the 200 EMA (if enabled).
Setup: A Bullish FVG forms.
Confirmation: A Doji candle wicks down into the 50% level of the FVG.
Trigger: Enter on the next candle close.
SHORT Rules:
Filter: Price is Below the 200 EMA (if enabled).
Setup: A Bearish FVG forms.
Confirmation: A Doji candle wicks up into the 50% level of the FVG.
Trigger: Enter on the next candle close.
5. OTE Framework (MBB Trader)
Simulates an Optimal Trade Entry by combining a Liquidity Sweep with a Market Structure Shift (SMR).
LONG Rules:
Sweep: Price drops below the lowest low of the last 20 candles.
Structure: A Bullish SMR forms (Low → High → Lower Low → Higher High).
SHORT Rules:
Sweep: Price breaks above the highest high of the last 20 candles.
Structure: A Bearish SMR forms (High → Low → Higher High → Lower Low).
6. Liquidity Trap (Marco Trades)
A contrarian strategy that buys/sells purely on sweeps of major structural levels.
LONG Rules:
Trigger: Price sweeps (drops below) the lowest low of the last 50 candles.
SHORT Rules:
Trigger: Price sweeps (breaks above) the highest high of the last 50 candles.
7. Trojan Horse (Trader Mayne)
Uses Trend EMAs (50 & 200) to identify direction, then enters on a Lower Timeframe Breaker.
LONG Rules:
Trend: 50 EMA > 200 EMA (Uptrend).
Trigger: Price sweeps a recent 10-candle low, then immediately breaks a recent 5-candle high.
SHORT Rules:
Trend: 50 EMA < 200 EMA (Downtrend).
Trigger: Price sweeps a recent 10-candle high, then immediately breaks a recent 5-candle low.
8. Simplified SMT (9:30 Range)
Focuses on the 9:30 AM range. Waits for a breakout and a confirmed failure to sustain it.
LONG Rules:
Context: Price previously broke above the ORH.
Trigger: Price returns to the ORH (Retest) with a Bullish Engulfing/Rejection pattern.
SHORT Rules:
Context: Price previously broke below the ORL.
Trigger: Price returns to the ORL (Retest) with a Bearish Engulfing/Rejection pattern.
9. 9:30 One-Candle (Scarface)
Uses the high/low of the single 9:30 candle as the range.
LONG Rules:
Setup: Price closes above the 9:30 High.
Trigger: Price pulls back and touches/dips into the 9:30 High (Retest).
SHORT Rules:
Setup: Price closes below the 9:30 Low.
Trigger: Price pulls back and touches/wicks into the 9:30 Low (Retest).
10. London Breakout (Joovier)
Based on the 3 AM - 9 AM EST box.
LONG Rules:
Trigger: A candle's Body (Open and Close) forms completely above the Box High after the session opens.
SHORT Rules:
Trigger: A candle's Body (Open and Close) forms completely below the Box Low after the session opens.
⚠️ DISCLAIMER & LIMITATION OF LIABILITY
1. NO AFFILIATION / INDEPENDENT PROJECT This script is an independent coding project created solely for testing, research, and entertainment purposes. The creator of this indicator is not associated, affiliated, endorsed by, or in any way connected to the strategy authors or influencers mentioned within the tool (including but not limited to TG Capital, MBB Trader, Marco Trades, Trader Mayne, Scarface, or Joovier).
The strategy names are used strictly for identification purposes to credit the original concept creators.
This code represents an independent interpretation of public trading concepts. It may not reflect the exact, proprietary, or private methods taught by these individuals.
This is not an official product from any of the aforementioned parties.
2. FOR EDUCATIONAL PURPOSES ONLY This indicator is strictly for educational and informational purposes. It is not a signal service and does not constitute investment, financial, or trading advice. The buy/sell labels generated by this script are merely visual representations of specific code logic and should not be interpreted as instructions to execute trades.
3. EXCLUSION OF LIABILITY By using this script, you explicitly agree that:
The creator assumes no responsibility or liability for any direct, indirect, consequential, or incidental losses or damages resulting from the use of this tool.
You engage in trading entirely at your own risk.
You release the creator from any legal responsibility regarding your trading activities or financial results.
4. HYPOTHETICAL PERFORMANCE The statistics displayed on the "Dashboard" (Win Rate, P&L, etc.) are hypothetical and based on historical backtesting data.
Past performance is not indicative of future results.
These results do not account for slippage, spreads, commission fees, or real-time liquidity issues.
Strategies that performed well in the past may fail in current or future market conditions.
5. HIGH-RISK WARNING Trading in financial markets (Stocks, Forex, Crypto, Futures) involves a high degree of risk and is not suitable for all investors. You could lose some or all of your initial investment. You should not trade with money that you cannot afford to lose.
IF YOU DO NOT AGREE WITH THESE TERMS, DO NOT USE THIS SCRIPT.
