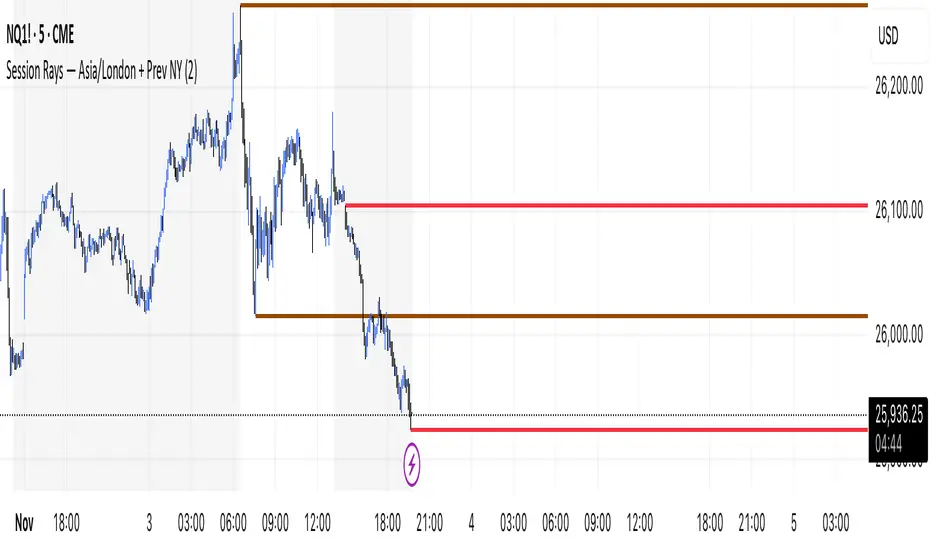
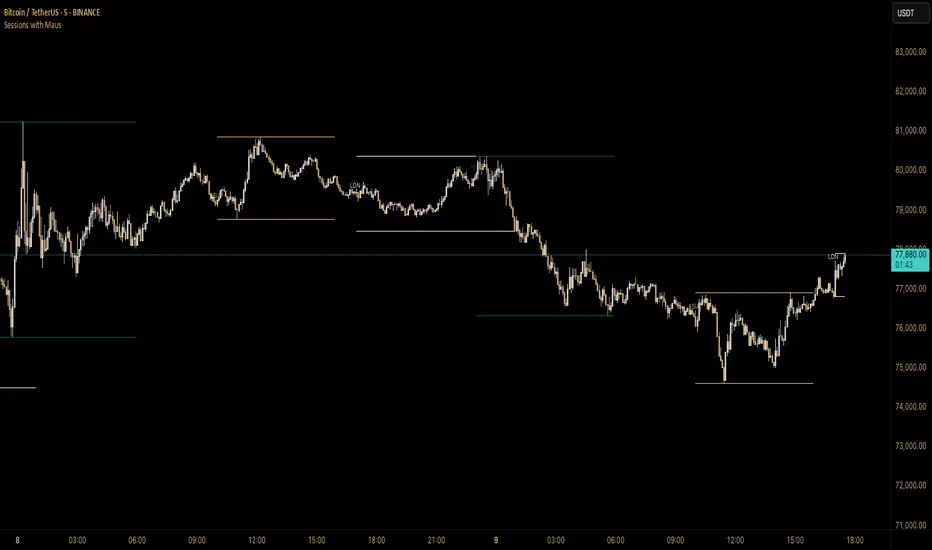
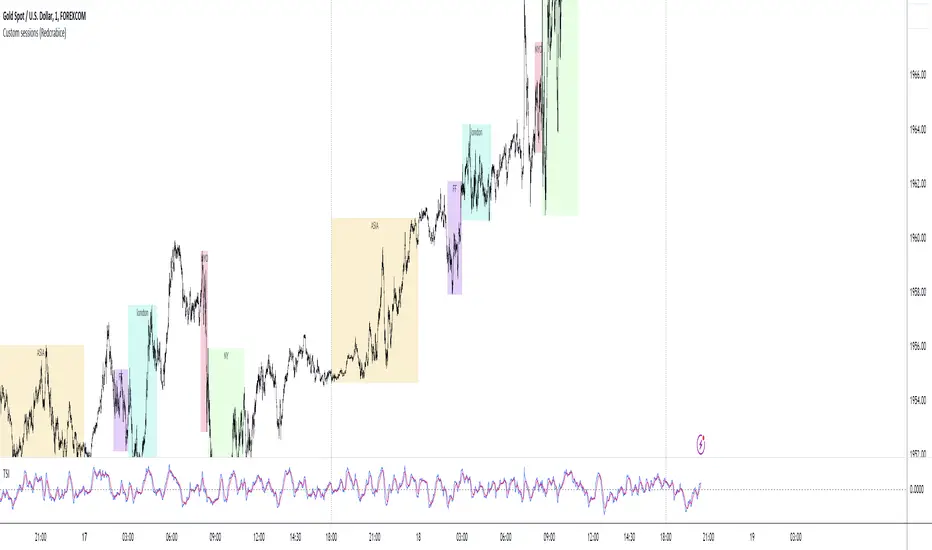
Sessions [LuxAlgo & TrendRiderIO]Visualize and track trading sessions with customizable ranges, VWAP bands, and high/low levels. Enhanced version of LuxAlgo's Sessions indicator.
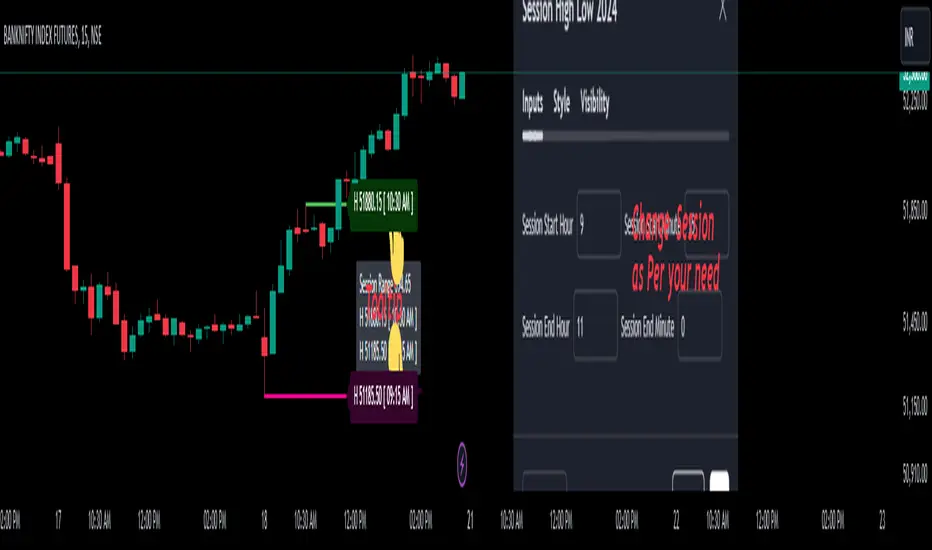
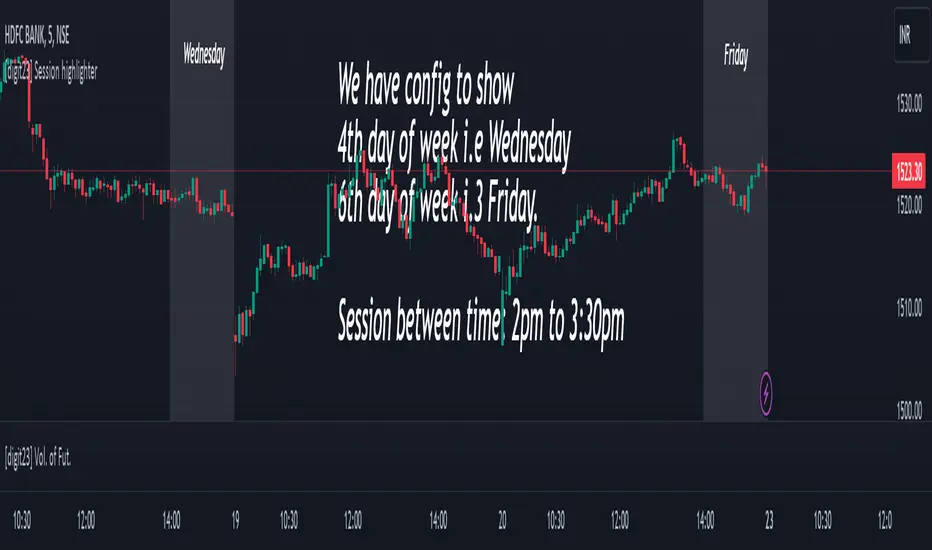
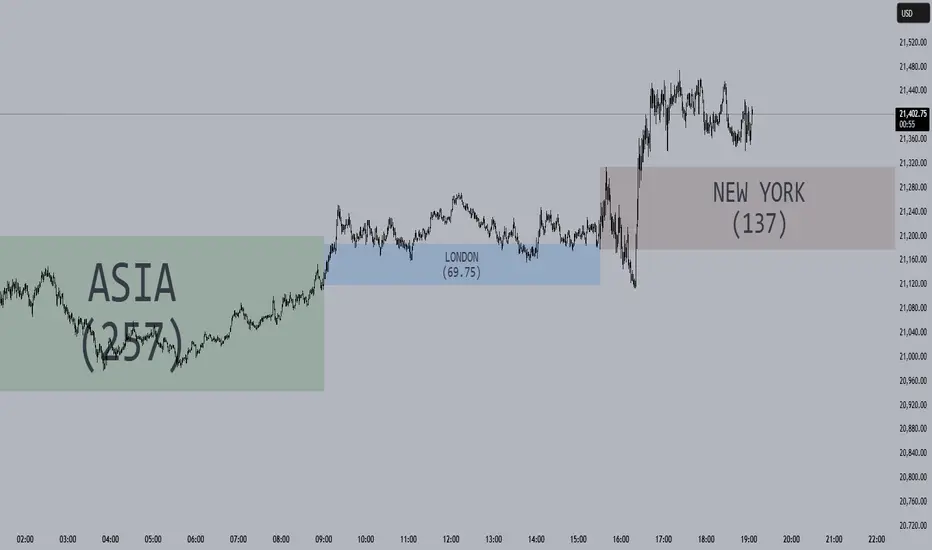
Track up to 3 customizable trading sessions (NY, London, Tokyo) with session range boxes, session-specific anchored VWAP with standard deviation bands, and high/low extension lines for the last 3 completed sessions. Includes peak hours visualization, session overlap highlighting, and breach alerts with direction indication.
Perfect for identifying key support/resistance levels, analyzing session strength, finding entry/exit points, and breakout trading.
License: CC BY-NC-SA 4.0 | Based on work by @LuxAlgo, enhanced by TrendRiderIO.
Chỉ báo Pine Script®