Price Trendlines + Break Signals█ OVERVIEW
The "Price Trendlines + Break Signals" indicator is a technical analysis tool that automatically draws trendlines based on price pivot points and detects breakout signals. Designed for traders seeking precise market signals, the indicator identifies key pivot points, draws trendlines (resistance and support), and generates breakout signals with background highlighting. It offers flexible settings and alerts for breakout signals.
█ CONCEPTS
The indicator was created to provide traders with an alternative source of signals based on trendlines. Breakouts and bounces from trendlines can signal a trend change or the end of a correction. Combining these signals with other technical analysis tools can form the basis for building diverse trading strategies.
█ FEATURES
-Pivot Point Calculation: The indicator identifies pivot points (pivot high and pivot low) based on the closing price, with configurable left and right bars for pivot detection. Setting a higher number of bars results in fewer but more significant trendlines, with a delay corresponding to the specified length. Lower values generate more trendlines, but they are less significant. Crossovers are signaled only after the trendline is drawn, so sometimes no signals appear on crossed trendlines—this indicates the price passed through the line before it was detected.
- Trendlines: Draws trendlines connecting price pivot points—upper lines for downtrends (resistance) and lower lines for uptrends (support). Lines can be extended by a specified number of bars (default: 50).
- Tolerance Margin: Trendlines are widened by a tolerance margin, calculated using the average candle body size over a specified period and its multiplier. Reducing the multiplier to zero leaves only the trendline without a margin. Breaking this zone is a condition for generating signals.
- Breakout Signals: Generates signals when the price breaks through a trendline (bullish for upper lines, bearish for lower lines), with background highlighting for signal confirmation.
Alerts: Built-in alerts for:
- Upper trendline breakout (bullish signal).
- Lower trendline breakout (bearish signal).
Customization: Allows adjustment of pivot parameters, trendline extension length, tolerance margin, line colors, fills, and signal background transparency.
█ HOW TO USE
Adding the Indicator: Add the indicator to your TradingView chart via the Pine Editor or Indicators menu.
Configuring Settings:
- Left Bars for Pivot: Number of bars back for detecting pivots (default: 10).
- Right Bars for Pivot: Number of bars forward to confirm pivots (default: 10).
- Extend past 2nd pivot: Number of bars to extend the trendline after the second pivot (default: 50, 0 = no extension).
- Average Body Periods: Period for calculating the average candle body size used for the tolerance margin (default: 100).
- Tolerance Multiplier: Multiplier for the tolerance margin based on the average candle body size (default: 1.0).
Colors and Style:
- Upper trendline (resistance): default red.
- Lower trendline (support): default green.
- Line fills: colors with transparency (default 70).
- Signal background: green for bullish signals, red for bearish signals (default transparency 85).
Interpreting Signals:
- Trendlines: Upper lines (red) indicate a downtrend, lower lines (green) indicate an uptrend. Signals appear after a trendline breakout with the tolerance margin. Each trendline generates only one breakout signal, though it may still act as resistance or support for the price.
- Breakout Signals: Green background indicates an upper trendline breakout (bullish), red background indicates a lower trendline breakout (bearish).
- Alerts: Set up alerts in TradingView for trendline breakout signals.
Combining with Other Tools: Use with support/resistance levels, Fibonacci levels, RSI, pivot points, or FVG (Fair Value Gap) for signal confirmation.
█ APPLICATIONS
The "Price Trendlines + Break Signals" indicator is designed to identify trends and potential reversal points, supporting both trend-following and contrarian strategies:
- Trend Confirmation: Trendlines indicate the direction of the price trend, and bounces from them may signal the end of a correction.
- Reversal Strategies: Breakout signals can be used as cues to enter positions in anticipation of a trend change or correction.
- Noise Filtering: The tolerance margin reduces false signals, enhancing reliability.
█ NOTES
- Trendline crossovers are signaled only after the trendline is drawn, so sometimes no signals appear on crossed trendlines—this indicates the price passed through the line before it was detected.
- Each trendline generates only one breakout signal, though it may still act as a level of support or resistance for the price.
- Setting a higher number of bars for pivots results in fewer but more significant trendlines, with a delay corresponding to the specified length. Lower values generate more trendlines, but they are less significant.
- Adjust settings (e.g., number of bars for pivots, tolerance multiplier) to suit your trading style and timeframe.
- Combine with other technical analysis tools, such as RSI, pivot points, or FVG, to enhance signal accuracy.
- For high-volatility markets, consider increasing the tolerance margin to reduce false signals.
Tìm kiếm tập lệnh với "signal"

5-Minute Buy/Sell SignalThe 5-Minute Buy/Sell Signal Indicator is designed to help short-term traders identify potential buy and sell opportunities on a 5-minute chart using a combination of multiple technical indicators. This indicator integrates the following key components to generate buy and sell signals:
MACD (Moving Average Convergence Divergence):
The MACD helps identify the strength and direction of the market trend by comparing the difference between short-term and long-term moving averages. A positive MACD histogram indicates bullish momentum, while a negative histogram indicates bearish momentum.
RSI (Relative Strength Index):
The RSI is a momentum oscillator that measures the speed and change of price movements. The indicator is used to determine overbought or oversold conditions:
Oversold (below 30): Potential buy signal.
Overbought (above 70): Potential sell signal.
EMA (Exponential Moving Average):
The 50-period EMA is used to determine the prevailing trend. When the price is above the EMA, it indicates a bullish trend; when it is below the EMA, it indicates a bearish trend.
Volume:
The indicator incorporates volume analysis to confirm the strength of signals. Signals are only considered valid when the current volume exceeds the average volume over the last 20 periods, ensuring that there is sufficient market participation to support the move.
Signal Generation:
Buy Signal:
The signal is generated when:
MACD histogram is positive (bullish momentum).
RSI is below the oversold level (indicating a potential reversal).
The price is above the 50-period EMA (indicating an uptrend).
Current volume is higher than the 20-period volume moving average (confirming the strength of the buy signal).
Sell Signal:
The signal is generated when:
MACD histogram is negative (bearish momentum).
RSI is above the overbought level (indicating a potential reversal).
The price is below the 50-period EMA (indicating a downtrend).
Current volume is higher than the 20-period volume moving average (confirming the strength of the sell signal).
Signal Display:
Buy Signal: A green "BUY" label appears below the bar when all buy conditions are met.
Sell Signal: A red "SELL" label appears above the bar when all sell conditions are met.
Usage:
This indicator is specifically designed for 5-minute charts, making it ideal for scalpers and day traders who need quick, reliable signals to trade in short timeframes. By combining multiple indicators—MACD, RSI, EMA, and Volume—the system ensures that the buy or sell signals are well-confirmed, reducing the likelihood of false signals and increasing the probability of successful trades.
Alert Conditions:
Alerts can be set up for both buy and sell signals, enabling traders to be notified when the conditions for a potential trade are met, ensuring they never miss a trading opportunity.
In summary, this indicator provides a comprehensive, multi-faceted approach to identifying buy and sell opportunities, helping traders make more informed decisions based on a detailed technical analysis.
MVSF 6.0[ELPANO]The "MVSF 6.0 " indicator, which stands for Multi-Variable Strategy Framework, overlays on price charts to aid in trading decisions. It combines various moving averages and volume data to generate buy and sell signals based on predefined conditions.
Key features of the indicator include:
Moving Averages: It uses three exponential moving averages (EMAs) with lengths of 200, 100, and 50, and two simple moving averages (SMAs) with lengths of 14 and 9. These averages are combined into a single average line to detect trends.
Volume Analysis: The volume is assessed over a specified period (default is 2 bars) to determine its trend relative to its average, influencing the color and interpretation of signals.
Price Source and VWAP: Users can select the price (close, low, or high) used for calculations. The volume-weighted average price (VWAP) serves as a potential benchmark or condition in signal generation.
Signal Generation: Buy and sell signals are based on the relationship of the price to the average line and VWAP, the direction of the last candle, and the trend direction of the average line. These signals are visually represented on the chart.
Customization: Traders can toggle the visibility of signals, entry points, the average line, and even use these elements as conditions for filtering signals.
This script is designed to be flexible, allowing traders to modify settings according to their strategy needs. The description and implementation aim to provide clarity on how each component works together to assist in trading decisions, adhering to best practices for creating and publishing trading scripts.
*************************************
Der Indikator "MVSF 6.0 ", der für Multi-Variable Strategy Framework steht, wird über Preisdiagramme gelegt, um bei Handelsentscheidungen zu helfen. Er kombiniert verschiedene gleitende Durchschnitte und Volumendaten, um Kauf- und Verkaufssignale basierend auf vordefinierten Bedingungen zu generieren.
Wesentliche Merkmale des Indikators umfassen:
Gleitende Durchschnitte: Es werden drei exponentielle gleitende Durchschnitte (EMAs) mit Längen von 200, 100 und 50 sowie zwei einfache gleitende Durchschnitte (SMAs) mit Längen von 14 und 9 verwendet. Diese Durchschnitte werden zu einer einzelnen Durchschnittslinie kombiniert, um Trends zu erkennen.
Volumenanalyse: Das Volumen wird über einen festgelegten Zeitraum (standardmäßig 2 Balken) bewertet, um seinen Trend im Vergleich zum Durchschnitt zu bestimmen, was die Farbe und Interpretation der Signale beeinflusst.
Preisquelle und VWAP: Benutzer können den für Berechnungen verwendeten Preis (Schluss-, Tief- oder Hochkurs) auswählen. Der volumengewichtete Durchschnittspreis (VWAP) dient als mögliche Benchmark oder Bedingung bei der Generierung von Signalen.
Signalgenerierung: Kauf- und Verkaufssignale basieren auf dem Verhältnis des Preises zur Durchschnittslinie und zum VWAP, der Richtung der letzten Kerze und der Trendrichtung der Durchschnittslinie. Diese Signale werden visuell auf dem Diagramm dargestellt.
Anpassung: Händler können die Sichtbarkeit von Signalen, Einstiegspunkten, der Durchschnittslinie und sogar deren Verwendung als Bedingungen für die Filterung von Signalen ein- und ausschalten.
Dieses Skript ist so konzipiert, dass es flexibel ist und Händlern erlaubt, die Einstellungen gemäß ihren Strategiebedürfnissen zu modifizieren. Die Beschreibung und Implementierung zielen darauf ab, Klarheit darüber zu schaffen, wie jede Komponente zusammenarbeitet, um bei Handelsentscheidungen zu helfen, und halten sich an die besten Praktiken für die Erstellung und Veröffentlichung von Handelsskripten.

Supply and Demand Zones with Enhanced SignalsThis Pine Script indicator combines supply and demand zone analysis with dynamic buy/sell signals to enhance trading strategies. It provides a robust framework for identifying optimal trading opportunities and managing existing trades.
Key Features:
Supply and Demand Zones: The indicator identifies significant supply and demand zones based on recent price action. These zones are plotted as horizontal lines to help traders visualize potential reversal points.
Exponential Moving Average (EMA): A 21-period EMA is used to determine the prevailing trend and generate buy and sell signals.
Relative Strength Index (RSI): The 14-period RSI is utilized to filter buy and sell signals, providing additional context on overbought and oversold conditions.
Signal Generation:
Buy Signal: Triggered when the price crosses above the EMA and RSI indicates that the market is not overbought.
Sell Signal: Triggered when the price crosses below the EMA and RSI indicates that the market is not oversold.
Enhanced Exit Signals:
Exit Buy Signal: Generated if an opposite sell signal occurs or the higher timeframe RSI indicates overbought conditions.
Exit Sell Signal: Generated if an opposite buy signal occurs or the higher timeframe RSI indicates oversold conditions.
Trade Management:
Tracks active trades and provides exit signals based on the occurrence of opposite trading signals. This helps in managing positions more effectively and reducing potential losses.
Usage:
Supply and Demand Zones: Look for price action around these zones to identify potential trading opportunities.
EMA and RSI: Use buy and sell signals in conjunction with EMA and RSI to validate trading decisions.
Higher Timeframe RSI: Utilize this for additional confirmation and exit signals.
Plotting:
Supply Zone: Plotted as a red horizontal line.
Demand Zone: Plotted as a green horizontal line.
EMA: Plotted as a blue line.
Buy and Sell Signals: Indicated by green and red triangle shapes, respectively.
Exit Signals: Indicated by blue and orange X shapes.
This indicator is designed to help traders make informed decisions by combining technical analysis with strategic trade management.

Luxy Super-Duper SuperTrend Predictor Engine and Buy/Sell signalA professional trend-following grading system that analyzes historical trend
patterns to provide statistical duration estimates using advanced similarity
matching and k-nearest neighbors analysis. Combines adaptive Supertrend with
intelligent duration statistics, multi-timeframe confluence, volume confirmation,
and quality scoring to identify high-probability setups with data-driven
target ranges across all timeframes.
Note: All duration estimates are statistical calculations based on historical data, not guarantees of future performance.
WHAT MAKES THIS DIFFERENT
Unlike traditional SuperTrend indicators that only tell you trend direction, this system answers the critical question: "What is the typical duration for trends like this?"
The Statistical Analysis Engine:
• Analyzes your chart's last 15+ completed SuperTrend trends (bullish and bearish separately)
• Uses k-nearest neighbors similarity matching to find historically similar setups
• Calculates statistical duration estimates based on current market conditions
• Learns from estimation errors and adapts over time (Advanced mode)
• Displays visual duration analysis box showing median, average, and range estimates
• Tracks Statistical accuracy with backtest statistics
Complete Trading System:
• Statistical trend duration analysis with three intelligence levels
• Adaptive Supertrend with dynamic ATR-based bands
• Multi-timeframe confluence analysis (6 timeframes: 5M to 1W)
• Volume confirmation with spike detection and momentum tracking
• Quality scoring system (0-70 points) rating each setup
• One-click preset optimization for all trading styles
• Anti-repaint guarantee on all signals and duration estimates
METHODOLOGY CREDITS
This indicator's approach is inspired by proven trading methodologies from respected market educators:
• Mark Minervini - Volatility Contraction Pattern (VCP) and pullback entry techniques
• William O'Neil - Volume confirmation principles and institutional buying patterns (CANSLIM methodology)
• Dan Zanger - Volatility expansion entries and momentum breakout strategies
Important: These are educational references only. This indicator does not guarantee any specific trading results. Always conduct your own analysis and risk management.
KEY FEATURES
1. TREND DURATION ANALYSIS SYSTEM - The Core Innovation
The statistical analysis engine is what sets this indicator apart from standard SuperTrend systems. It doesn't just identify trend changes - it provides statistical analysis of potential duration.
How It Works:
Step 1: Historical Tracking
• Automatically records every completed SuperTrend trend (duration in bars)
• Maintains separate databases for bullish trends and bearish trends
• Stores up to 15 most recent trends of each type
• Captures market conditions at each trend flip: volume ratio, ATR ratio, quality score, price distance from SuperTrend, proximity to support/resistance
Step 2: Similarity Matching (k-Nearest Neighbors)
• When new trend begins, system compares current conditions to ALL historical flips
• Calculates similarity score based on:
- Volume similarity (30% weight) - Is volume behaving similarly?
- Volatility similarity (30% weight) - Is ATR/volatility similar?
- Quality similarity (20% weight) - Is setup strength comparable?
- Distance similarity (10% weight) - Is price distance from ST similar?
- Support/Resistance proximity (10% weight) - Similar structural context?
• Selects the 15 MOST SIMILAR historical trends (not just all trends)
• This is like asking: "When conditions looked like this before, how long did trends last?"
Step 3: Statistical Analysis
• Calculates median duration (most common outcome)
• Calculates average duration (mean of similar trends)
• Determines realistic range (min to max of similar trends)
• Applies exponential weighting (recent trends weighted more heavily)
• Outputs confidence-weighted statistical estimate
Step 4: Advanced Intelligence (Advanced Mode Only)
The Advanced mode applies five sophisticated multipliers to refine estimates:
A) Market Structure Multiplier (±30%):
• Detects nearby support/resistance levels using pivot detection
• If flip occurs NEAR a key level: Estimate adjusted -30% (expect bounce/rejection)
• If flip occurs in open space: Estimate adjusted +30% (clear path for continuation)
• Uses configurable lookback period and ATR-based proximity threshold
B) Asset Type Multiplier (±40%):
• Adjusts duration estimates based on asset volatility characteristics
• Small Cap / Biotech: +40% (explosive, extended moves)
• Tech Growth: +20% (momentum-driven, longer trends)
• Blue Chip / Large Cap: 0% (baseline, steady trends)
• Dividend / Value: -20% (slower, grinding trends)
• Cyclical: Variable based on macro regime
• Crypto / High Volatility: +30% (parabolic potential)
C) Flip Strength Multiplier (±20%):
• Analyzes the QUALITY of the trend flip itself
• Strong flip (high volume + expanding ATR + quality score 60+): +20%
• Weak flip (low volume + contracting ATR + quality score under 40): -20%
• Logic: Historical data shows that powerful flips tend to be followed by longer trends
D) Error Learning Multiplier (±15%):
• Tracks Statistical accuracy over last 10 completed trends
• Calculates error ratio: (estimated duration / Actual Duration)
• If system consistently over-estimates: Apply -15% correction
• If system consistently under-estimates: Apply +15% correction
• Learns and adapts to current market regime
E) Regime Detection Multiplier (±20%):
• Analyzes last 3 trends of SAME TYPE (bull-to-bull or bear-to-bear)
• Compares recent trend durations to historical average
• If recent trends 20%+ longer than average: +20% adjustment (trending regime detected)
• If recent trends 20%+ shorter than average: -20% adjustment (choppy regime detected)
• Detects whether market is in trending or mean-reversion mode
Three analysis modes:
SIMPLE MODE - Basic Statistics
• Uses raw median of similar trends only
• No multipliers, no adjustments
• Best for: Beginners, clean trending markets
• Fastest calculations, minimal complexity
STANDARD MODE - Full Statistical Analysis
• Similarity matching with k-nearest neighbors
• Exponential weighting of recent trends
• Median, average, and range calculations
• Best for: Most traders, general market conditions
• Balance of accuracy and simplicity
ADVANCED MODE - Statistics + Intelligence
• Everything in Standard mode PLUS
• All 5 advanced multipliers (structure, asset type, flip strength, learning, regime)
• Highest Statistical accuracy in testing
• Best for: Experienced traders, volatile/complex markets
• Maximum intelligence, most adaptive
Visual Duration Analysis Box:
When a new trend begins (SuperTrend flip), a box appears on your chart showing:
• Analysis Mode (Simple / Standard / Advanced)
• Number of historical trends analyzed
• Median expected duration (most likely outcome)
• Average expected duration (mean of similar trends)
• Range (minimum to maximum from similar trends)
• Advanced multipliers breakdown (Advanced mode only)
• Backtest accuracy statistics (if available)
The box extends from the flip bar to the estimated endpoint based on historical data, giving you a visual target for trend duration. Box updates in real-time as trend progresses.
Backtest & Accuracy Tracking:
• System backtests its own duration estimates using historical data
• Shows accuracy metrics: how well duration estimates matched actual durations
• Tracks last 10 completed duration estimates separately
• Displays statistics in dashboard and duration analysis boxes
• Helps you understand statistical reliability on your specific symbol/timeframe
Anti-Repaint Guarantee:
• duration analysis boxes only appear AFTER bar close (barstate.isconfirmed)
• Historical duration estimates never disappear or change
• What you see in history is exactly what you would have seen real-time
• No future data leakage, no lookahead bias
2. INTELLIGENT PRESET CONFIGURATIONS - One-Click Optimization
Unlike indicators that require tedious parameter tweaking, this system includes professionally optimized presets for every trading style. Select your approach from the dropdown and ALL parameters auto-configure.
"AUTO (DETECT FROM TF)" - RECOMMENDED
The smartest option: automatically selects optimal settings based on your chart timeframe.
• 1m-5m charts → Scalping preset (ATR: 7, Mult: 2.0)
• 15m-1h charts → Day Trading preset (ATR: 10, Mult: 2.5)
• 2h-4h-D charts → Swing Trading preset (ATR: 14, Mult: 3.0)
• W-M charts → Position Trading preset (ATR: 21, Mult: 4.0)
Benefits:
• Zero configuration - works immediately
• Always matched to your timeframe
• Switch timeframe = automatic adjustment
• Perfect for traders who use multiple timeframes
"SCALPING (1-5M)" - Ultra-Fast Signals
Optimized for: 1-5 minute charts, high-frequency trading, quick profits
Target holding period: Minutes to 1-2 hours maximum
Best markets: High-volume stocks, major crypto pairs, active futures
Parameter Configuration:
• Supertrend: ATR 7, Multiplier 2.0 (very sensitive)
• Volume: MA 10, High 1.8x, Spike 3.0x (catches quick surges)
• Volume Momentum: AUTO-DISABLED (too restrictive for fast scalping)
• Quality minimum: 40 points (accepts more setups)
• Duration Analysis: Uses last 15 trends with heavy recent weighting
Trading Logic:
Speed over precision. Short ATR period and low multiplier create highly responsive SuperTrend. Volume momentum filter disabled to avoid missing fast moves. Quality threshold relaxed to catch more opportunities in rapid market conditions.
Signals per session: 5-15 typically
Hold time: Minutes to couple hours
Best for: Active traders with fast execution
"DAY TRADING (15M-1H)" - Balanced Approach
Optimized for: 15-minute to 1-hour charts, intraday moves, session-based trading
Target holding period: 30 minutes to 8 hours (within trading day)
Best markets: Large-cap stocks, major indices, established crypto
Parameter Configuration:
• Supertrend: ATR 10, Multiplier 2.5 (balanced)
• Volume: MA 20, High 1.5x, Spike 2.5x (standard detection)
• Volume Momentum: 5/20 periods (confirms intraday strength)
• Quality minimum: 50 points (good setups preferred)
• Duration Analysis: Balanced weighting of recent vs historical
Trading Logic:
The most balanced configuration. ATR 10 with multiplier 2.5 provides steady trend following that avoids noise while catching meaningful moves. Volume momentum confirms institutional participation without being overly restrictive.
Signals per session: 2-5 typically
Hold time: 30 minutes to full day
Best for: Part-time and full-time active traders
"SWING TRADING (4H-D)" - Trend Stability
Optimized for: 4-hour to Daily charts, multi-day holds, trend continuation
Target holding period: 2-15 days typically
Best markets: Growth stocks, sector ETFs, trending crypto, commodity futures
Parameter Configuration:
• Supertrend: ATR 14, Multiplier 3.0 (stable)
• Volume: MA 30, High 1.3x, Spike 2.2x (accumulation focus)
• Volume Momentum: 10/30 periods (trend stability)
• Quality minimum: 60 points (high-quality setups only)
• Duration Analysis: Favors consistent historical patterns
Trading Logic:
Designed for substantial trend moves while filtering short-term noise. Higher ATR period and multiplier create stable SuperTrend that won't flip on minor corrections. Stricter quality requirements ensure only strongest setups generate signals.
Signals per week: 2-5 typically
Hold time: Days to couple weeks
Best for: Part-time traders, swing style
"POSITION TRADING (D-W)" - Long-Term Trends
Optimized for: Daily to Weekly charts, major trend changes, portfolio allocation
Target holding period: Weeks to months
Best markets: Blue-chip stocks, major indices, established cryptocurrencies
Parameter Configuration:
• Supertrend: ATR 21, Multiplier 4.0 (very stable)
• Volume: MA 50, High 1.2x, Spike 2.0x (long-term accumulation)
• Volume Momentum: 20/50 periods (major trend confirmation)
• Quality minimum: 70 points (excellent setups only)
• Duration Analysis: Heavy emphasis on multi-year historical data
Trading Logic:
Conservative approach focusing on major trend changes. Extended ATR period and high multiplier create SuperTrend that only flips on significant reversals. Very strict quality filters ensure signals represent genuine long-term opportunities.
Signals per month: 1-2 typically
Hold time: Weeks to months
Best for: Long-term investors, set-and-forget approach
"CUSTOM" - Advanced Configuration
Purpose: Complete manual control for experienced traders
Use when: You understand the parameters and want specific optimization
Best for: Testing new approaches, unusual market conditions, specific instruments
Full control over:
• All SuperTrend parameters
• Volume thresholds and momentum periods
• Quality scoring weights
• analysis mode and multipliers
• Advanced features tuning
Preset Comparison Quick Reference:
Chart Timeframe: Scalping (1M-5M) | Day Trading (15M-1H) | Swing (4H-D) | Position (D-W)
Signals Frequency: Very High | High | Medium | Low
Hold Duration: Minutes | Hours | Days | Weeks-Months
Quality Threshold: 40 pts | 50 pts | 60 pts | 70 pts
ATR Sensitivity: Highest | Medium | Lower | Lowest
Time Investment: Highest | High | Medium | Lowest
Experience Level: Expert | Advanced | Intermediate | Beginner+
3. QUALITY SCORING SYSTEM (0-70 Points)
Every signal is rated in real-time across three dimensions:
Volume Confirmation (0-30 points):
• Volume Spike (2.5x+ average): 30 points
• High Volume (1.5x+ average): 20 points
• Above Average (1.0x+ average): 10 points
• Below Average: 0 points
Volatility Assessment (0-30 points):
• Expanding ATR (1.2x+ average): 30 points
• Rising ATR (1.0-1.2x average): 15 points
• Contracting/Stable ATR: 0 points
Volume Momentum (0-10 points):
• Strong Momentum (1.2x+ ratio): 10 points
• Rising Momentum (1.0-1.2x ratio): 5 points
• Weak/Neutral Momentum: 0 points
Score Interpretation:
60-70 points - EXCELLENT:
• All factors aligned
• High conviction setup
• Maximum position size (within risk limits)
• Primary trading opportunities
45-59 points - STRONG:
• Multiple confirmations present
• Above-average setup quality
• Standard position size
• Good trading opportunities
30-44 points - GOOD:
• Basic confirmations met
• Acceptable setup quality
• Reduced position size
• Wait for additional confirmation or trade smaller
Below 30 points - WEAK:
• Minimal confirmations
• Low probability setup
• Consider passing
• Only for aggressive traders in strong trends
Only signals meeting your minimum quality threshold (configurable per preset) generate alerts and labels.
4. MULTI-TIMEFRAME CONFLUENCE ANALYSIS
The system can simultaneously analyze trend alignment across 6 timeframes (optional feature):
Timeframes analyzed:
• 5-minute (scalping context)
• 15-minute (intraday momentum)
• 1-hour (day trading bias)
• 4-hour (swing context)
• Daily (primary trend)
• Weekly (macro trend)
Confluence Interpretation:
• 5-6/6 aligned - Very strong multi-timeframe agreement (highest confidence)
• 3-4/6 aligned - Moderate agreement (standard setup)
• 1-2/6 aligned - Weak agreement (caution advised)
Dashboard shows real-time alignment count with color-coding. Higher confluence typically correlates with longer, stronger trends.
5. VOLUME MOMENTUM FILTER - Institutional Money Flow
Unlike traditional volume indicators that just measure size, Volume Momentum tracks the RATE OF CHANGE in volume:
How it works:
• Compares short-term volume average (fast period) to long-term average (slow period)
• Ratio above 1.0 = Volume accelerating (money flowing IN)
• Ratio above 1.2 = Strong acceleration (institutional participation likely)
• Ratio below 0.8 = Volume decelerating (money flowing OUT)
Why it matters:
• Confirms trend with actual money flow, not just price
• Leading indicator (volume often leads price)
• Catches accumulation/distribution before breakouts
• More intuitive than complex mathematical filters
Integration with signals:
• Optional filter - can be enabled/disabled per preset
• When enabled: Only signals with rising volume momentum fire
• AUTO-DISABLED in Scalping mode (too restrictive for fast trading)
• Configurable fast/slow periods per trading style
6. ADAPTIVE SUPERTREND MULTIPLIER
Traditional SuperTrend uses fixed ATR multiplier. This system dynamically adjusts the multiplier (0.8x to 1.2x base) based on:
• Trend Strength: Price correlation over lookback period
• Volume Weight: Current volume relative to average
Benefits:
• Tighter bands in calm markets (less premature exits)
• Wider bands in volatile conditions (avoids whipsaws)
• Better adaptation to biotech, small-cap, and crypto volatility
• Optional - can be disabled for classic constant multiplier
7. VISUAL GRADIENT RIBBON
26-layer exponential gradient fill between price and SuperTrend line provides instant visual trend strength assessment:
Color System:
• Green shades - Bullish trend + volume confirmation (strongest)
• Blue shades - Bullish trend, normal volume
• Orange shades - Bearish trend + volume confirmation
• Red shades - Bearish trend (weakest)
Opacity varies based on:
• Distance from SuperTrend (farther = more opaque)
• Volume intensity (higher volume = stronger color)
The ribbon provides at-a-glance trend strength without cluttering your chart. Can be toggled on/off.
8. INTELLIGENT ALERT SYSTEM
Two-tier alert architecture for flexibility:
Automatic Alerts:
• Fire automatically on BUY and SELL signals
• Include full context: quality score, volume state, volume momentum
• One alert per bar close (alert.freq_once_per_bar_close)
• Message format: "BUY: Supertrend bullish + Quality: 65/70 | Volume: HIGH | Vol Momentum: STRONG (1.35x)"
Customizable Alert Conditions:
• Appear in TradingView's "Create Alert" dialog
• Three options: BUY Signal Only, SELL Signal Only, ANY Signal (BUY or SELL)
• Use TradingView placeholders: {{ticker}}, {{interval}}, {{close}}, {{time}}
• Fully customizable message templates
All alerts use barstate.isconfirmed - Zero repaint guarantee.
9. ANTI-REPAINT ARCHITECTURE
Every component guaranteed non-repainting:
• Entry signals: Only appear after bar close
• duration analysis boxes: Created only on confirmed SuperTrend flips
• Informative labels: Wait for bar confirmation
• Alerts: Fire once per closed bar
• Multi-timeframe data: Uses lookahead=barmerge.lookahead_off
What you see in history is exactly what you would have seen in real-time. No disappearing signals, no changed duration estimates.
HOW TO USE THE INDICATOR
QUICK START - 3 Steps to Trading:
Step 1: Select Your Trading Style
Open indicator settings → "Quick Setup" section → Trading Style Preset dropdown
Options:
• Auto (Detect from TF) - RECOMMENDED: Automatically configures based on your chart timeframe
• Scalping (1-5m) - For 1-5 minute charts, ultra-fast signals
• Day Trading (15m-1h) - For 15m-1h charts, balanced approach
• Swing Trading (4h-D) - For 4h-Daily charts, trend stability
• Position Trading (D-W) - For Daily-Weekly charts, long-term trends
• Custom - Manual configuration (advanced users only)
Choose "Auto" and you're done - all parameters optimize automatically.
Step 2: Understand the Signals
BUY Signal (Green Triangle Below Price):
• SuperTrend flipped bullish
• Quality score meets minimum threshold (varies by preset)
• Volume confirmation present (if filter enabled)
• Volume momentum rising (if filter enabled)
• duration analysis box shows expected trend duration
SELL Signal (Red Triangle Above Price):
• SuperTrend flipped bearish
• Quality score meets minimum threshold
• Volume confirmation present (if filter enabled)
• Volume momentum rising (if filter enabled)
• duration analysis box shows expected trend duration
Duration Analysis Box:
• Appears at SuperTrend flip (start of new trend)
• Shows median, average, and range duration estimates
• Extends to estimated endpoint based on historical data visually
• Updates mode-specific intelligence (Simple/Standard/Advanced)
Step 3: Use the Dashboard for Context
Dashboard (top-right corner) shows real-time metrics:
• Row 1 - Quality Score: Current setup rating (0-70)
• Row 2 - SuperTrend: Direction and current level
• Row 3 - Volume: Status (Spike/High/Normal/Low) with color
• Row 4 - Volatility: State (Expanding/Rising/Stable/Contracting)
• Row 5 - Volume Momentum: Ratio and trend
• Row 6 - Duration Statistics: Accuracy metrics and track record
Every cell has detailed tooltip - hover for full explanations.
SIGNAL INTERPRETATION BY QUALITY SCORE:
Excellent Setup (60-70 points):
• Quality Score: 60-70
• Volume: Spike or High
• Volatility: Expanding
• Volume Momentum: Strong (1.2x+)
• MTF Confluence (if enabled): 5-6/6
• Action: Primary trade - maximum position size (within risk limits)
• Statistical reliability: Highest - duration estimates most accurate
Strong Setup (45-59 points):
• Quality Score: 45-59
• Volume: High or Above Average
• Volatility: Rising
• Volume Momentum: Rising (1.0-1.2x)
• MTF Confluence (if enabled): 3-4/6
• Action: Standard trade - normal position size
• Statistical reliability: Good - duration estimates reliable
Good Setup (30-44 points):
• Quality Score: 30-44
• Volume: Above Average
• Volatility: Stable or Rising
• Volume Momentum: Neutral to Rising
• MTF Confluence (if enabled): 3-4/6
• Action: Cautious trade - reduced position size, wait for additional confirmation
• Statistical reliability: Moderate - duration estimates less certain
Weak Setup (Below 30 points):
• Quality Score: Below 30
• Volume: Low or Normal
• Volatility: Contracting or Stable
• Volume Momentum: Weak
• MTF Confluence (if enabled): 1-2/6
• Action: Pass or wait for improvement
• Statistical reliability: Low - duration estimates unreliable
USING duration analysis boxES FOR TRADE MANAGEMENT:
Entry Timing:
• Enter on SuperTrend flip (signal bar close)
• duration analysis box appears simultaneously
• Note the median duration - this is your expected hold time
Profit Targets:
• Conservative: Use MEDIAN duration as profit target (50% probability)
• Moderate: Use AVERAGE duration (mean of similar trends)
• Aggressive: Aim for MAX duration from range (best historical outcome)
Position Management:
• Scale out at median duration (take partial profits)
• Trail stop as trend extends beyond median
• Full exit at average duration or SuperTrend flip (whichever comes first)
• Re-evaluate if trend exceeds estimated range
analysis mode Selection:
• Simple: Clean trending markets, beginners, minimal complexity
• Standard: Most markets, most traders (recommended default)
• Advanced: Volatile markets, complex instruments, experienced traders seeking highest accuracy
Asset Type Configuration (Advanced Mode):
If using Advanced analysis mode, configure Asset Type for optimal accuracy:
• Small Cap: Stocks under $2B market cap, low liquidity
• Biotech / Speculative: Clinical-stage pharma, penny stocks, high-risk
• Blue Chip / Large Cap: S&P 500, mega-cap tech, stable large companies
• Tech Growth: High-growth tech (TSLA, NVDA, growth SaaS)
• Dividend / Value: Dividend aristocrats, value stocks, utilities
• Cyclical: Energy, materials, industrials (macro-driven)
• Crypto / High Volatility: Bitcoin, altcoins, highly volatile assets
Correct asset type selection improves Statistical accuracy by 15-20%.
RISK MANAGEMENT GUIDELINES:
1. Stop Loss Placement:
Long positions:
• Place stop below recent swing low OR
• Place stop below SuperTrend level (whichever is tighter)
• Use 1-2 ATR distance as guideline
• Recommended: SuperTrend level (built-in volatility adjustment)
Short positions:
• Place stop above recent swing high OR
• Place stop above SuperTrend level (whichever is tighter)
• Use 1-2 ATR distance as guideline
• Recommended: SuperTrend level
2. Position Sizing by Quality Score:
• Excellent (60-70): Maximum position size (2% risk per trade)
• Strong (45-59): Standard position size (1.5% risk per trade)
• Good (30-44): Reduced position size (1% risk per trade)
• Weak (Below 30): Pass or micro position (0.5% risk - learning trades only)
3. Exit Strategy Options:
Option A - Statistical Duration-Based Exit:
• Exit at median estimated duration (conservative)
• Exit at average estimated duration (moderate)
• Trail stop beyond average duration (aggressive)
Option B - Signal-Based Exit:
• Exit on opposite signal (SELL after BUY, or vice versa)
• Exit on SuperTrend flip (trend reversal)
• Exit if quality score drops below 30 mid-trend
Option C - Hybrid (Recommended):
• Take 50% profit at median estimated duration
• Trail stop on remaining 50% using SuperTrend as trailing level
• Full exit on SuperTrend flip or quality collapse
4. Trade Filtering:
For higher win-rate (fewer trades, better quality):
• Increase minimum quality score (try 60 for swing, 50 for day trading)
• Enable volume momentum filter (ensure institutional participation)
• Require higher MTF confluence (5-6/6 alignment)
• Use Advanced analysis mode with appropriate asset type
For more opportunities (more trades, lower quality threshold):
• Decrease minimum quality score (40 for day trading, 35 for scalping)
• Disable volume momentum filter
• Lower MTF confluence requirement
• Use Simple or Standard analysis mode
SETTINGS OVERVIEW
Quick Setup Section:
• Trading Style Preset: Auto / Scalping / Day Trading / Swing / Position / Custom
Dashboard & Display:
• Show Dashboard (ON/OFF)
• Dashboard Position (9 options: Top/Middle/Bottom + Left/Center/Right)
• Text Size (Auto/Tiny/Small/Normal/Large/Huge)
• Show Ribbon Fill (ON/OFF)
• Show SuperTrend Line (ON/OFF)
• Bullish Color (default: Green)
• Bearish Color (default: Red)
• Show Entry Labels - BUY/SELL signals (ON/OFF)
• Show Info Labels - Volume events (ON/OFF)
• Label Size (Auto/Tiny/Small/Normal/Large/Huge)
Supertrend Configuration:
• ATR Length (default varies by preset: 7-21)
• ATR Multiplier Base (default varies by preset: 2.0-4.0)
• Use Adaptive Multiplier (ON/OFF) - Dynamic 0.8x-1.2x adjustment
• Smoothing Factor (0.0-0.5) - EMA smoothing applied to bands
• Neutral Bars After Flip (0-10) - Hide ST immediately after flip
Volume Momentum:
• Enable Volume Momentum Filter (ON/OFF)
• Fast Period (default varies by preset: 3-20)
• Slow Period (default varies by preset: 10-50)
Volume Analysis:
• Volume MA Length (default varies by preset: 10-50)
• High Volume Threshold (default: 1.5x)
• Spike Threshold (default: 2.5x)
• Low Volume Threshold (default: 0.7x)
Quality Filters:
• Minimum Quality Score (0-70, varies by preset)
• Require Volume Confirmation (ON/OFF)
Trend Duration Analysis:
• Show Duration Analysis (ON/OFF) - Display duration analysis boxes
• analysis mode - Simple / Standard / Advanced
• Asset Type - 7 options (Small Cap, Biotech, Blue Chip, Tech Growth, Dividend, Cyclical, Crypto)
• Use Exponential Weighting (ON/OFF) - Recent trends weighted more
• Decay Factor (0.5-0.99) - How much more recent trends matter
• Structure Lookback (3-30) - Pivot detection period for support/resistance
• Proximity Threshold (xATR) - How close to level qualifies as "near"
• Enable Error Learning (ON/OFF) - System learns from estimation errors
• Memory Depth (3-20) - How many past errors to remember
Box Visual Settings:
• duration analysis box Border Color
• duration analysis box Background Color
• duration analysis box Text Color
• duration analysis box Border Width
• duration analysis box Transparency
Multi-Timeframe (Optional Feature):
• Enable MTF Confluence (ON/OFF)
• Minimum Alignment Required (0-6)
• Individual timeframe enable/disable toggles
• Custom timeframe selection options
All preset configurations override manual inputs except when "Custom" is selected.
ADVANCED FEATURES
1. Scalpel Mode (Optional)
Advanced pullback entry system that waits for healthy retracements within established trends before signaling entry:
• Monitors price distance from SuperTrend levels
• Requires pullback to configurable range (default: 30-50%)
• Ensures trend remains intact before entry signal
• Reduces whipsaw and false breakouts
• Inspired by Mark Minervini's VCP pullback entries
Best for: Swing traders and day traders seeking precision entries
Scalpers: Consider disabling for faster entries
2. Error Learning System (Advanced analysis mode Only)
The system learns from its own estimation errors:
• Tracks last 10-20 completed duration estimates (configurable memory depth)
• Calculates error ratio for each: estimated duration / Actual Duration
• If system consistently over-estimates: Applies negative correction (-15%)
• If system consistently under-estimates: Applies positive correction (+15%)
• Adapts to current market regime automatically
This self-correction mechanism improves accuracy over time as the system gathers more data on your specific symbol and timeframe.
3. Regime Detection (Advanced analysis mode Only)
Automatically detects whether market is in trending or choppy regime:
• Compares last 3 trends to historical average
• Recent trends 20%+ longer → Trending regime (+20% to estimates)
• Recent trends 20%+ shorter → Choppy regime (-20% to estimates)
• Applied separately to bullish and bearish trends
Helps duration estimates adapt to changing market conditions without manual intervention.
4. Exponential Weighting
Option to weight recent trends more heavily than distant history:
• Default decay factor: 0.9
• Recent trends get higher weight in statistical calculations
• Older trends gradually decay in importance
• Rationale: Recent market behavior more relevant than old data
• Can be disabled for equal weighting
5. Backtest Statistics
System backtests its own duration estimates using historical data:
• Walks through past trends chronologically
• Calculates what duration estimate WOULD have been at each flip
• Compares to actual duration that occurred
• Displays accuracy metrics in duration analysis boxes and dashboard
• Helps assess statistical reliability on your specific chart
Note: Backtest uses only data available AT THE TIME of each historical flip (no lookahead bias).
TECHNICAL SPECIFICATIONS
• Pine Script Version: v6
• Indicator Type: Overlay (draws on price chart)
• Max Boxes: 500 (for duration analysis box storage)
• Max Bars Back: 5000 (for comprehensive historical analysis)
• Security Calls: 1 (for MTF if enabled - optimized)
• Repainting: NO - All signals and duration estimates confirmed on bar close
• Lookahead Bias: NO - All HTF data properly offset, all duration estimates use only historical data
• Real-time Updates: YES - Dashboard and quality scores update live
• Alert Capable: YES - Both automatic alerts and customizable alert conditions
• Multi-Symbol: Works on stocks, crypto, forex, futures, indices
Performance Optimization:
• Conditional calculations (duration analysis can be disabled to reduce load)
• Efficient array management (circular buffers for trend storage)
• Streamlined gradient rendering (26 layers, can be toggled off)
• Smart label cooldown system (prevents label spam)
• Optimized similarity matching (analyzes only relevant trends)
Data Requirements:
• Minimum 50-100 bars for initial duration analysis (builds historical database)
• Optimal: 500+ bars for robust statistical analysis
• Longer history = more accurate duration estimates
• Works on any timeframe from 1 minute to monthly
KNOWN LIMITATIONS
• Trending Markets Only: Performs best in clear trends. May generate false signals in choppy/sideways markets (use quality score filtering and regime detection to mitigate)
• Lagging Nature: Like all trend-following systems, signals occur AFTER trend establishment, not at exact tops/bottoms. Use duration analysis boxes to set realistic profit targets.
• Initial Learning Period: Duration analysis system requires 10-15 completed trends to build reliable historical database. Early duration estimates less accurate (first few weeks on new symbol/timeframe).
• Visual Load: 26-layer gradient ribbon may slow performance on older devices. Disable ribbon if experiencing lag.
• Statistical accuracy Variables: Duration estimates are statistical estimates, not guarantees. Accuracy varies by:
- Market regime (trending vs choppy)
- Asset volatility characteristics
- Quality of historical pattern matches
- Timeframe traded (higher TF = more reliable)
• Not Best Suitable For:
- Ultra-short-term scalping (sub-1-minute charts)
- Mean-reversion strategies (designed for trend-following)
- Range-bound trading (requires trending conditions)
- News-driven spikes (estimates based on technical patterns, not fundamentals)
FREQUENTLY ASKED QUESTIONS
Q: Does this indicator repaint?
A: Absolutely not. All signals, duration analysis boxes, labels, and alerts use barstate.isconfirmed checks. They only appear after the bar closes. What you see in history is exactly what you would have seen in real-time. Zero repaint guarantee.
Q: How accurate are the trend duration estimates?
A: Accuracy varies by mode, market conditions, and historical data quality:
• Simple mode: 60-70% accuracy (within ±20% of actual duration)
• Standard mode: 70-80% accuracy (within ±20% of actual duration)
• Advanced mode: 75-85% accuracy (within ±20% of actual duration)
Best accuracy achieved on:
• Higher timeframes (4H, Daily, Weekly)
• Trending markets (not choppy/sideways)
• Assets with consistent behavior (Blue Chip, Large Cap)
• After 20+ historical trends analyzed (builds robust database)
Remember: All duration estimates are statistical calculations based on historical patterns, not guarantees.
Q: Which analysis mode should I use?
A:
• Simple: Beginners, clean trending markets, want minimal complexity
• Standard: Most traders, general market conditions (RECOMMENDED DEFAULT)
• Advanced: Experienced traders, volatile/complex markets (biotech, small-cap, crypto), seeking maximum accuracy
Advanced mode requires correct Asset Type configuration for optimal results.
Q: What's the difference between the trading style presets?
A: Each preset optimizes ALL parameters for a specific trading approach:
• Scalping: Ultra-sensitive (ATR 7, Mult 2.0), more signals, shorter holds
• Day Trading: Balanced (ATR 10, Mult 2.5), moderate signals, intraday holds
• Swing Trading: Stable (ATR 14, Mult 3.0), fewer signals, multi-day holds
• Position Trading: Very stable (ATR 21, Mult 4.0), rare signals, week/month holds
Auto mode automatically selects based on your chart timeframe.
Q: Should I use Auto mode or manually select a preset?
A: Auto mode is recommended for most traders. It automatically matches settings to your timeframe and re-optimizes if you switch charts. Only use manual preset selection if:
• You want scalping settings on a 15m chart (overriding auto-detection)
• You want swing settings on a 1h chart (more conservative than auto would give)
• You're testing different approaches on same timeframe
Q: Can I use this for scalping and day trading?
A: Absolutely! The preset system is specifically designed for all trading styles:
• Select "Scalping (1-5m)" for 1-5 minute charts
• Select "Day Trading (15m-1h)" for 15m-1h charts
• Or use "Auto" mode and it configures automatically
Volume momentum filter is auto-disabled in Scalping mode for faster signals.
Q: What is Volume Momentum and why does it matter?
A: Volume Momentum compares short-term volume (fast MA) to long-term volume (slow MA). It answers: "Is money flowing into this asset faster now than historically?"
Why it matters:
• Volume often leads price (early warning system)
• Confirms institutional participation (smart money)
• No lag like price-based indicators
• More intuitive than complex mathematical filters
When the ratio is above 1.2, you have strong evidence that institutions are accumulating (bullish) or distributing (bearish).
Q: How do I set up alerts?
A: Two options:
Option 1 - Automatic Alerts:
1. Right-click on chart → Add Alert
2. Condition: Select this indicator
3. Choose "Any alert() function call"
4. Configure notification method (app, email, webhook)
5. You'll receive detailed alerts on every BUY and SELL signal
Option 2 - Customizable Alert Conditions:
1. Right-click on chart → Add Alert
2. Condition: Select this indicator
3. You'll see three options in dropdown:
- "BUY Signal" (long signals only)
- "SELL Signal" (short signals only)
- "ANY Signal" (both BUY and SELL)
4. Choose desired option and customize message template
5. Uses TradingView placeholders: {{ticker}}, {{close}}, {{time}}, etc.
All alerts fire only on confirmed bar close (no repaint).
Q: What is Scalpel Mode and should I use it?
A: Scalpel Mode waits for healthy pullbacks within established trends before signaling entry. It reduces whipsaws and improves entry timing.
Recommended ON for:
• Swing traders (want precision entries on pullbacks)
• Day traders (willing to wait for better prices)
• Risk-averse traders (prefer fewer but higher-quality entries)
Recommended OFF for:
• Scalpers (need immediate entries, can't wait for pullbacks)
• Momentum traders (want to enter on breakout, not pullback)
• Aggressive traders (prefer more opportunities over precision)
Q: Why do some duration estimates show wider ranges than others?
A: Range width reflects historical trend variability:
• Narrow range: Similar historical trends had consistent durations (high confidence)
• Wide range: Similar historical trends had varying durations (lower confidence)
Wide ranges often occur:
• Early in analysis (fewer historical trends to learn from)
• In volatile/choppy markets (inconsistent trend behavior)
• On lower timeframes (more noise, less consistency)
The median and average still provide useful targets even when range is wide.
Q: Can I customize the dashboard position and appearance?
A: Yes! Dashboard settings include:
• Position: 9 options (Top/Middle/Bottom + Left/Center/Right)
• Text Size: Auto, Tiny, Small, Normal, Large, Huge
• Show/Hide: Toggle entire dashboard on/off
Choose position that doesn't overlap important price action on your specific chart.
Q: Which timeframe should I trade on?
A: Depends on your trading style and time availability:
• 1-5 minute: Active scalping, requires constant monitoring
• 15m-1h: Day trading, check few times per session
• 4h-Daily: Swing trading, check once or twice daily
• Daily-Weekly: Position trading, check weekly
General principle: Higher timeframes produce:
• Fewer signals (less frequent)
• Higher quality setups (stronger confirmations)
• More reliable duration estimates (better statistical data)
• Less noise (clearer trends)
Start with Daily chart if new to trading. Move to lower timeframes as you gain experience.
Q: Does this work on all markets (stocks, crypto, forex)?
A: Yes, it works on all markets with trending characteristics:
Excellent for:
• Stocks (especially growth and momentum names)
• Crypto (BTC, ETH, major altcoins)
• Futures (indices, commodities)
• Forex majors (EUR/USD, GBP/USD, etc.)
Best results on:
• Trending markets (not range-bound)
• Liquid instruments (tight spreads, good fills)
• Volatile assets (clear trend development)
Less effective on:
• Range-bound/sideways markets
• Ultra-low volatility instruments
• Illiquid small-caps (use caution)
Configure Asset Type (in Advanced analysis mode) to match your instrument for best accuracy.
Q: How many signals should I expect per day/week?
A: Highly variable based on:
By Timeframe:
• 1-5 minute: 5-15 signals per session
• 15m-1h: 2-5 signals per day
• 4h-Daily: 2-5 signals per week
• Daily-Weekly: 1-2 signals per month
By Market Volatility:
• High volatility = more SuperTrend flips = more signals
• Low volatility = fewer flips = fewer signals
By Quality Filter:
• Higher threshold (60-70) = fewer but better signals
• Lower threshold (30-40) = more signals, lower quality
By Volume Momentum Filter:
• Enabled = Fewer signals (only volume-confirmed)
• Disabled = More signals (all SuperTrend flips)
Adjust quality threshold and filters to match your desired signal frequency.
Q: What's the difference between entry labels and info labels?
A:
Entry Labels (BUY/SELL):
• Your primary trading signals
• Based on SuperTrend flip + all confirmations (quality, volume, momentum)
• Include quality score and confirmation icons
• These are actionable entry points
Info Labels (Volume Spike):
• Additional market context
• Show volume events that may support or contradict trend
• 8-bar cooldown to prevent spam
• NOT necessarily entry points - contextual information only
Control separately: Can show entry labels without info labels (recommended for clean charts).
Q: Can I combine this with other indicators?
A: Absolutely! This works well with:
• RSI: For divergences and overbought/oversold conditions
• Support/Resistance: Confluence with key levels
• Fibonacci Retracements: Pullback targets in Scalpel Mode
• Price Action Patterns: Flags, pennants, cup-and-handle
• MACD: Additional momentum confirmation
• Bollinger Bands: Volatility context
This indicator provides trend direction and duration estimates - complement with other tools for entry refinement and additional confluence.
Q: Why did I get a low-quality signal? Can I filter them out?
A: Yes! Increase the Minimum Quality Score in settings.
If you're seeing signals with quality below your preference:
• Day Trading: Set minimum to 50
• Swing Trading: Set minimum to 60
• Position Trading: Set minimum to 70
Only signals meeting the threshold will appear. This reduces frequency but improves win-rate.
Q: How do I interpret the MTF Confluence count?
A: Shows how many of 6 timeframes agree with current trend:
• 6/6 aligned: Perfect agreement (extremely rare, highest confidence)
• 5/6 aligned: Very strong alignment (high confidence)
• 4/6 aligned: Good alignment (standard quality setup)
• 3/6 aligned: Moderate alignment (acceptable)
• 2/6 aligned: Weak alignment (caution)
• 1/6 aligned: Very weak (likely counter-trend)
Higher confluence typically correlates with longer, stronger trends. However, MTF analysis is optional - you can disable it and rely solely on quality scoring.
Q: Is this suitable for beginners?
A: Yes, but requires foundational knowledge:
You should understand:
• Basic trend-following concepts (higher highs, higher lows)
• Risk management principles (position sizing, stop losses)
• How to read candlestick charts
• What volume and volatility mean
Beginner-friendly features:
• Auto preset mode (zero configuration)
• Quality scoring (tells you signal strength)
• Dashboard tooltips (hover for explanations)
• duration analysis boxes (visual profit targets)
Recommended for beginners:
1. Start with "Auto" or "Swing Trading" preset on Daily chart
2. Use Standard Analysis Mode (not Advanced)
3. Set minimum quality to 60 (fewer but better signals)
4. Paper trade first for 2-4 weeks
5. Study methodology references (Minervini, O'Neil, Zanger)
Q: What is the Asset Type setting and why does it matter?
A: Asset Type (in Advanced analysis mode) adjusts duration estimates based on volatility characteristics:
• Small Cap: Explosive moves, extended trends (+30-40%)
• Biotech / Speculative: Parabolic potential, news-driven (+40%)
• Blue Chip / Large Cap: Baseline, steady trends (0% adjustment)
• Tech Growth: Momentum-driven, longer trends (+20%)
• Dividend / Value: Slower, grinding trends (-20%)
• Cyclical: Macro-driven, variable (±10%)
• Crypto / High Volatility: Parabolic potential (+30%)
Correct configuration improves Statistical accuracy by 15-20%. Using Blue Chip settings on a biotech stock may underestimate trend length (you'll exit too early).
Q: Can I backtest this indicator?
A: Yes! TradingView's Strategy Tester works with this indicator's signals.
To backtest:
1. Note the entry conditions (SuperTrend flip + quality threshold + filters)
2. Create a strategy script using same logic
3. Run Strategy Tester on historical data
Additionally, the indicator includes BUILT-IN duration estimate validation:
• System backtests its own duration estimates
• Shows accuracy metrics in dashboard and duration analysis boxes
• Helps assess reliability on your specific symbol/timeframe
Q: Why does Volume Momentum auto-disable in Scalping mode?
A: Scalping requires ultra-fast entries to catch quick moves. Volume Momentum filter adds friction by requiring volume confirmation before signaling, which can cause missed opportunities in rapid scalping.
Scalping preset is optimized for speed and frequency - the filter is counterproductive for that style. It remains enabled for Day Trading, Swing Trading, and Position Trading presets where patience improves results.
You can manually enable it in Custom mode if desired.
Q: How much historical data do I need for accurate duration estimates?
A:
Minimum: 50-100 bars (indicator will function but duration estimates less reliable)
Recommended: 500+ bars (robust statistical database)
Optimal: 1000+ bars (maximum Statistical accuracy)
More history = more completed trends = better pattern matching = more accurate duration estimates.
New symbols or newly-switched timeframes will have lower Statistical accuracy initially. Allow 2-4 weeks for the system to build historical database.
IMPORTANT DISCLAIMERS
No Guarantee of Profit:
This indicator is an educational tool and does not guarantee any specific trading results. All trading involves substantial risk of loss. Duration estimates are statistical calculations based on historical patterns and are not guarantees of future performance.
Past Performance:
Historical backtest results and Statistical accuracy statistics do not guarantee future performance. Market conditions change constantly. What worked historically may not work in current or future markets.
Not Financial Advice:
This indicator provides technical analysis signals and statistical duration estimates only. It is not financial, investment, or trading advice. Always consult with a qualified financial advisor before making investment decisions.
Risk Warning:
Trading stocks, options, futures, forex, and cryptocurrencies involves significant risk. You can lose all of your invested capital. Never trade with money you cannot afford to lose. Only risk capital you can lose without affecting your lifestyle.
Testing Required:
Always test this indicator on a demo account or with paper trading before risking real capital. Understand how it works in different market conditions. Verify Statistical accuracy on your specific instruments and timeframes before trusting it with real money.
User Responsibility:
You are solely responsible for your trading decisions. The developer assumes no liability for trading losses, incorrect duration estimates, software errors, or any other damages incurred while using this indicator.
Statistical Estimation Limitations:
Trend Duration estimates are statistical estimates based on historical pattern matching. They are NOT guarantees. Actual trend durations may differ significantly from duration estimates due to unforeseen news events, market regime changes, or lack of historical precedent for current conditions.
CREDITS & ACKNOWLEDGMENTS
Methodology Inspiration:
• Mark Minervini - Volatility Contraction Pattern (VCP) concepts and pullback entry techniques
• William O'Neil - Volume analysis principles and CANSLIM institutional buying patterns
• Dan Zanger - Momentum breakout strategies and volatility expansion entries
Technical Components:
• SuperTrend calculation - Classic ATR-based trend indicator (public domain)
• Statistical analysis - Standard median, average, range calculations
• k-Nearest Neighbors - Classic machine learning similarity matching concept
• Multi-timeframe analysis - Standard request.security implementation in Pine Script
For questions, feedback, or support, please comment below or send a private message.
Happy Trading!

AI Volume SignalsAI Volume Signals
The AI Volume Signals indicator detects significant volume spikes and combines them with trend direction and candle color to generate buy and sell signals. This script utilizes an Exponential Moving Average (EMA) of volume to detect abnormal volume spikes, which could indicate strong market activity. It also filters signals based on the trend direction determined by a 50-period EMA of the price.
Key Features:
Volume Spike Detection: The indicator detects when the current volume exceeds the EMA of volume by a user-defined multiplier, signaling an unusual increase in market activity.
Trend Direction Filter: The 50-period EMA of the price is used to determine the market trend. Buy signals are generated when the price is above the EMA (uptrend), and sell signals occur when the price is below the EMA (downtrend).
Candle Color Filter: The indicator only generates a buy signal when the current candle is bullish (green), and a sell signal when the current candle is bearish (red).
Optional Volume EMA Line: A customizable option allows users to toggle the visibility of the Volume EMA line on the chart. By default, the line is hidden, but can be enabled in the settings.
Signals:
Buy Signal: Generated when a volume spike occurs, the trend is upward, and the current candle is bullish.
Sell Signal: Generated when a volume spike occurs, the trend is downward, and the current candle is bearish.
Alerts:
Buy Alert: Alerts the user when a buy signal is triggered.
Sell Alert: Alerts the user when a sell signal is triggered.
Visualization:
Buy Signal: A green label appears below the bar when the buy conditions are met.
Sell Signal: A red label appears above the bar when the sell conditions are met.
Volume EMA: A line representing the EMA of the volume is plotted on the chart for reference. The visibility of this line can be toggled in the settings.
This indicator can help traders identify potential entry points based on increased volume activity while considering trend direction and candlestick patterns.
Custom Buy and Sell Signal with Body Ratio and RSI
Indicator Overview:
Name: Custom Buy and Sell Signal with Body Ratio and RSI
Description: This indicator is designed to detect buy and sell opportunities by analyzing the body size and wicks of candles in combination with the RSI indicator and volume. It helps identify trend reversals under high-volume market conditions, which enhances the reliability of the signals.
Indicator Features:
RSI (Relative Strength Index): The RSI indicator is used to assess oversold (RSI < 40) or overbought (RSI > 60) conditions. These zones signal potential reversals when combined with other technical signals.
Candle Body Analysis:
The indicator compares the size of the current and previous candles to validate signals.
For a buy signal, the current candle must be bullish and have a body size proportional to that of the previous bearish candle.
Similarly, for a sell signal, the current candle must be bearish with a body size comparable to the previous bullish candle.
Wick Validation:
The indicator analyzes the wick length to reinforce or exclude signals.
For a buy signal, the lower wick of the bullish candle must be shorter than that of the previous bearish candle.
For a sell signal, the upper wick of the bearish candle must be shorter than that of the previous bullish candle and smaller than 30% of the candle's body.
High Volume:
Signals are only generated when the volume exceeds a certain threshold, ensuring that signals are issued in active market conditions.
The minimum volume should be adjusted based on the asset. For example, for gold, a minimum volume of 9000 is recommended.
Trading Strategy:
Buy Signals:
A bearish (red) candle is followed by a bullish (green) candle with a body size that is comparable to the previous candle (0.9 to 3 times the body size).
The lower wick of the bullish candle is shorter than that of the previous bearish candle, confirming the validity of the signal.
The RSI must be below 40, indicating an oversold condition.
The volume must exceed the defined threshold (e.g., > 9000 for gold) to confirm an active market.
Sell Signals:
A bullish (green) candle is followed by a bearish (red) candle with a comparable body size.
The upper wick of the bearish candle must be shorter than that of the previous bullish candle and must not exceed 30% of the body size.
The RSI must be above 60, indicating an overbought condition.
The volume must also exceed the minimum threshold for a valid signal.
Usage Guidelines:
Volume Adjustment: It is crucial to adjust the volume threshold depending on the asset you're trading. For example, for assets like gold, a minimum volume of 9000 is recommended to filter out weak signals. Each asset has a different volume dynamic, so test different thresholds on historical data to find the optimal setting.
Time Frame:
It is recommended to use this indicator on a 1-hour (1H) chart for the best signal relevance. This time frame provides a good balance between reactivity and filtering false signals.
Confluence:
Combine the signals from this indicator with other tools like support and resistance levels, moving averages, or chart patterns to increase your chances of success. Confluence of indicators improves the reliability of signals.
Risk Management:
Implement strict risk management. Use stop-losses based on volatility, such as ATR (Average True Range), or the wick size to determine exit points.
Backtesting:
Before using it live, conduct backtesting on various assets to fine-tune the parameters, especially the volume threshold, and to verify performance across different market conditions.
This indicator is an excellent tool for traders looking to identify trend reversals based on solid technical criteria such as RSI, candle structure, and volume. It is particularly effective on volatile assets with precise volume adjustment.
MTF Signal XpertMTF Signal Xpert – Detailed Description
Overview:
MTF Signal Xpert is a proprietary, open‑source trading signal indicator that fuses multiple technical analysis methods into one cohesive strategy. Developed after rigorous backtesting and extensive research, this advanced tool is designed to deliver clear BUY and SELL signals by analyzing trend, momentum, and volatility across various timeframes. Its integrated approach not only enhances signal reliability but also incorporates dynamic risk management, helping traders protect their capital while navigating complex market conditions.
Detailed Explanation of How It Works:
Trend Detection via Moving Averages
Dual Moving Averages:
MTF Signal Xpert computes two moving averages—a fast MA and a slow MA—with the flexibility to choose from Simple (SMA), Exponential (EMA), or Hull (HMA) methods. This dual-MA system helps identify the prevailing market trend by contrasting short-term momentum with longer-term trends.
Crossover Logic:
A BUY signal is initiated when the fast MA crosses above the slow MA, coupled with the condition that the current price is above the lower Bollinger Band. This suggests that the market may be emerging from a lower price region. Conversely, a SELL signal is generated when the fast MA crosses below the slow MA and the price is below the upper Bollinger Band, indicating potential bearish pressure.
Recent Crossover Confirmation:
To ensure that signals reflect current market dynamics, the script tracks the number of bars since the moving average crossover event. Only crossovers that occur within a user-defined “candle confirmation” period are considered, which helps filter out outdated signals and improves overall signal accuracy.
Volatility and Price Extremes with Bollinger Bands
Calculation of Bands:
Bollinger Bands are calculated using a 20‑period simple moving average as the central basis, with the upper and lower bands derived from a standard deviation multiplier. This creates dynamic boundaries that adjust according to recent market volatility.
Signal Reinforcement:
For BUY signals, the condition that the price is above the lower Bollinger Band suggests an undervalued market condition, while for SELL signals, the price falling below the upper Bollinger Band reinforces the bearish bias. This volatility context adds depth to the moving average crossover signals.
Momentum Confirmation Using Multiple Oscillators
RSI (Relative Strength Index):
The RSI is computed over 14 periods to determine if the market is in an overbought or oversold state. Only readings within an optimal range (defined by user inputs) validate the signal, ensuring that entries are made during balanced conditions.
MACD (Moving Average Convergence Divergence):
The MACD line is compared with its signal line to assess momentum. A bullish scenario is confirmed when the MACD line is above the signal line, while a bearish scenario is indicated when it is below, thus adding another layer of confirmation.
Awesome Oscillator (AO):
The AO measures the difference between short-term and long-term simple moving averages of the median price. Positive AO values support BUY signals, while negative values back SELL signals, offering additional momentum insight.
ADX (Average Directional Index):
The ADX quantifies trend strength. MTF Signal Xpert only considers signals when the ADX value exceeds a specified threshold, ensuring that trades are taken in strongly trending markets.
Optional Stochastic Oscillator:
An optional stochastic oscillator filter can be enabled to further refine signals. It checks for overbought conditions (supporting SELL signals) or oversold conditions (supporting BUY signals), thus reducing ambiguity.
Multi-Timeframe Verification
Higher Timeframe Filter:
To align short-term signals with broader market trends, the script calculates an EMA on a higher timeframe as specified by the user. This multi-timeframe approach helps ensure that signals on the primary chart are consistent with the overall trend, thereby reducing false signals.
Dynamic Risk Management with ATR
ATR-Based Calculations:
The Average True Range (ATR) is used to measure current market volatility. This value is multiplied by a user-defined factor to dynamically determine stop loss (SL) and take profit (TP) levels, adapting to changing market conditions.
Visual SL/TP Markers:
The calculated SL and TP levels are plotted on the chart as distinct colored dots, enabling traders to quickly identify recommended exit points.
Optional Trailing Stop:
An optional trailing stop feature is available, which adjusts the stop loss as the trade moves favorably, helping to lock in profits while protecting against sudden reversals.
Risk/Reward Ratio Calculation:
MTF Signal Xpert computes a risk/reward ratio based on the dynamic SL and TP levels. This quantitative measure allows traders to assess whether the potential reward justifies the risk associated with a trade.
Condition Weighting and Signal Scoring
Binary Condition Checks:
Each technical condition—ranging from moving average crossovers, Bollinger Band positioning, and RSI range to MACD, AO, ADX, and volume filters—is assigned a binary score (1 if met, 0 if not).
Cumulative Scoring:
These individual scores are summed to generate cumulative bullish and bearish scores, quantifying the overall strength of the signal and providing traders with an objective measure of its viability.
Detailed Signal Explanation:
A comprehensive explanation string is generated, outlining which conditions contributed to the current BUY or SELL signal. This explanation is displayed on an on‑chart dashboard, offering transparency and clarity into the signal generation process.
On-Chart Visualizations and Debug Information
Chart Elements:
The indicator plots all key components—moving averages, Bollinger Bands, SL and TP markers—directly on the chart, providing a clear visual framework for understanding market conditions.
Combined Dashboard:
A dedicated dashboard displays key metrics such as RSI, ADX, and the bullish/bearish scores, alongside a detailed explanation of the current signal. This consolidated view allows traders to quickly grasp the underlying logic.
Debug Table (Optional):
For advanced users, an optional debug table is available. This table breaks down each individual condition, indicating which criteria were met or not met, thus aiding in further analysis and strategy refinement.
Mashup Justification and Originality
MTF Signal Xpert is more than just an aggregation of existing indicators—it is an original synthesis designed to address real-world trading complexities. Here’s how its components work together:
Integrated Trend, Volatility, and Momentum Analysis:
By combining moving averages, Bollinger Bands, and multiple oscillators (RSI, MACD, AO, ADX, and an optional stochastic), the indicator captures diverse market dynamics. Each component reinforces the others, reducing noise and filtering out false signals.
Multi-Timeframe Analysis:
The inclusion of a higher timeframe filter aligns short-term signals with longer-term trends, enhancing overall reliability and reducing the potential for contradictory signals.
Adaptive Risk Management:
Dynamic stop loss and take profit levels, determined using ATR, ensure that the risk management strategy adapts to current market conditions. The optional trailing stop further refines this approach, protecting profits as the market evolves.
Quantitative Signal Scoring:
The condition weighting system provides an objective measure of signal strength, giving traders clear insight into how each technical component contributes to the final decision.
How to Use MTF Signal Xpert:
Input Customization:
Adjust the moving average type and period settings, ATR multipliers, and oscillator thresholds to align with your trading style and the specific market conditions.
Enable or disable the optional stochastic oscillator and trailing stop based on your preference.
Interpreting the Signals:
When a BUY or SELL signal appears, refer to the on‑chart dashboard, which displays key metrics (e.g., RSI, ADX, bullish/bearish scores) along with a detailed breakdown of the conditions that triggered the signal.
Review the SL and TP markers on the chart to understand the associated risk/reward setup.
Risk Management:
Use the dynamically calculated stop loss and take profit levels as guidelines for setting your exit points.
Evaluate the provided risk/reward ratio to ensure that the potential reward justifies the risk before entering a trade.
Debugging and Verification:
Advanced users can enable the debug table to see a condition-by-condition breakdown of the signal generation process, helping refine the strategy and deepen understanding of market dynamics.
Disclaimer:
MTF Signal Xpert is intended for educational and analytical purposes only. Although it is based on robust technical analysis methods and has undergone extensive backtesting, past performance is not indicative of future results. Traders should employ proper risk management and adjust the settings to suit their financial circumstances and risk tolerance.
MTF Signal Xpert represents a comprehensive, original approach to trading signal generation. By blending trend detection, volatility assessment, momentum analysis, multi-timeframe alignment, and adaptive risk management into one integrated system, it provides traders with actionable signals and the transparency needed to understand the logic behind them.

Dynamic Sentiment RSI [UAlgo]The Dynamic Sentiment RSI is a technical analysis tool that combines the classic RSI (Relative Strength Index) concept with dynamic sentiment analysis, offering traders enhanced insights into market conditions. Unlike the traditional RSI, this indicator integrates volume weighting, sentiment factors, and smoothing features to provide a more nuanced view of momentum and potential market reversals. It is designed to assist traders in detecting overbought/oversold conditions, momentum shifts, and to generate potential buy or sell signals using crossover and crossunder techniques. By dynamically adjusting based on sentiment and volume factors, this RSI offers better adaptability to varying market conditions, making it suitable for different trading styles and timeframes.
This tool is particularly helpful for traders who wish to explore not only price movement but also the underlying market sentiment, offering a more comprehensive approach to momentum analysis. The sentiment factor amplifies the RSI's sensitivity to price shifts, making it easier to detect early signals of market reversals or the continuation of a trend.
🔶 Key Features
Dynamic Sentiment Calculation: The indicator incorporates a "Sentiment Factor" that adjusts the RSI length dynamically based on a multiplier, helping traders better understand market sentiment at different time intervals.
Volume Weighting: When enabled, the RSI calculations are weighted by volume, allowing traders to give more importance to price movements with higher trading volume, which may provide more accurate signals.
Smoothing Feature: A customizable smoothing period is applied to the RSI to help filter out noise and make the signal smoother. This feature is particularly useful for traders who prefer to focus on long-term trends while minimizing false signals.
Step Size Customization: A "Step Size" input allows users to round the sentiment RSI to predefined intervals, making the results easier to interpret and act upon. This feature allows you to focus on significant sentiment changes and ignore minor fluctuations.
Crossover/Crossunder Alerts: The indicator includes crossover and crossunder signals on the zero-line, helping traders identify potential buy and sell opportunities as the smoothed RSI crosses these levels.
The indicator offers a clear visual display with multiple color-coded lines and areas:
Sentiment RSI: Plotted as an area chart, color-coded based on sentiment strength.
Raw RSI: A purple line representing the raw adjusted RSI.
Smoothed RSI: A dynamic line, color-coded aqua or orange based on its position relative to the zero line.
Buy/Sell Signals: Triangle shapes are plotted at crossovers and crossunders, providing clear entry and exit points.
🔶 Interpreting the Indicator
Sentiment RSI
-This line represents the sentiment-adjusted RSI, where the higher the value, the stronger the bullish sentiment, and the lower the value, the stronger the bearish sentiment. It is rounded to step intervals, making it easier to detect significant shifts in sentiment.
- A positive sentiment RSI (above 0) suggests bullish market conditions, while a negative sentiment RSI (below 0) suggests bearish conditions.
Smoothed RSI
The smoothed RSI helps reduce noise and shows the trend more clearly.
Crossovers of the zero line are significant:
- Crossover above zero: Indicates that bullish momentum is building, potentially signaling a buying opportunity.
- Crossunder below zero: Signals a shift towards bearish momentum, potentially indicating a sell signal.
Traders should look for these crossovers in conjunction with other signals for more accurate entry/exit points.
Raw RSI (Adjusted)
The raw adjusted RSI offers a less smoothed, more responsive version of the RSI. While it may be noisier, it provides early signals of market reversals and trends.
Crossover/Crossunder Signals
- When the smoothed RSI crosses above the zero line, a "Signal Up" triangle appears, indicating a potential buying opportunity.
- When the smoothed RSI crosses below the zero line, a "Signal Down" triangle appears, signaling a potential sell opportunity.
These signals help traders time their entries and exits by identifying momentum shifts.
Volume Weighting (Optional)
- If volume weighting is enabled, the RSI will give more weight to periods of higher trading volume, making the signals more reliable when the market is highly active.
Strong Up/Down Levels (40/-40)
- These dotted lines represent extreme sentiment levels. When the sentiment RSI reaches 40 or -40, the market may be nearing an overbought or oversold condition, respectively. This could be a signal for traders to prepare for potential reversals or shifts in momentum.
By combining the various components of this indicator, traders can gain a comprehensive view of market sentiment and price action, helping them make more informed trading decisions. The combination of sentiment factors, volume weighting, and smoothing makes this indicator highly flexible and suitable for a variety of trading strategies.
🔶 Disclaimer
Use with Caution: This indicator is provided for educational and informational purposes only and should not be considered as financial advice. Users should exercise caution and perform their own analysis before making trading decisions based on the indicator's signals.
Not Financial Advice: The information provided by this indicator does not constitute financial advice, and the creator (UAlgo) shall not be held responsible for any trading losses incurred as a result of using this indicator.
Backtesting Recommended: Traders are encouraged to backtest the indicator thoroughly on historical data before using it in live trading to assess its performance and suitability for their trading strategies.
Risk Management: Trading involves inherent risks, and users should implement proper risk management strategies, including but not limited to stop-loss orders and position sizing, to mitigate potential losses.
No Guarantees: The accuracy and reliability of the indicator's signals cannot be guaranteed, as they are based on historical price data and past performance may not be indicative of future results.

Adaptive Bollinger-RSI Trend Signal [CHE]Adaptive Bollinger-RSI Trend Signal
Indicator Overview:
The "Adaptive Bollinger-RSI Trend Signal " (ABRT Signal ) is a sophisticated trading tool designed to provide clear and actionable buy and sell signals by combining the power of Bollinger Bands and the Relative Strength Index (RSI). This indicator aims to help traders identify potential trend reversals and confirm entry and exit points with greater accuracy.
Key Features:
1. Bollinger Bands Integration:
- Utilizes Bollinger Bands to detect price volatility and identify overbought or oversold conditions.
- Configurable parameters: Length, Source, and Multiplier for precise adjustments based on trading preferences.
- Color customization: Change the colors of the basis line, upper band, lower band, and the fill color between bands.
2. RSI Integration:
- Incorporates the Relative Strength Index (RSI) to validate potential buy and sell signals.
- Configurable parameters: Length, Source, Upper Threshold, and Lower Threshold for customized signal generation.
3. Signal Generation:
- Buy Signal: Generated when the price crosses below the lower Bollinger Band and the RSI crosses above the lower threshold, indicating a potential upward trend.
- Sell Signal: Generated when the price crosses above the upper Bollinger Band and the RSI crosses below the upper threshold, indicating a potential downward trend.
- Color customization: Change the colors of the buy and sell signal labels.
4. State Tracking:
- Tracks and records crossover and crossunder states of the price and RSI to ensure signals are only generated under the right conditions.
- Monitors the basis trend (SMA of the Bollinger Bands) to provide context for signal validation.
5. Counters and Labels:
- Labels each buy and sell signal with a counter to indicate the number of consecutive signals.
- Counters reset upon the generation of an opposite signal, ensuring clarity and preventing signal clutter.
6. DCA (Dollar-Cost Averaging) Calculation:
- Stores the close price at each signal and calculates the average entry price (DCA) for both buy and sell signals.
- Displays the number of positions and DCA values in a label on the chart.
7. Customizable Inputs:
- Easily adjustable parameters for Bollinger Bands, RSI, and colors to suit various trading strategies and timeframes.
- Boolean input to show or hide the table label displaying position counts and DCA values.
- Intuitive and user-friendly configuration options for traders of all experience levels.
How to Use:
1. Setup:
- Add the "Adaptive Bollinger-RSI Trend Signal " to your TradingView chart.
- Customize the input parameters to match your trading style and preferred timeframe.
- Adjust the colors of the indicator elements to your preference for better visibility and clarity.
2. Interpreting Signals:
- Buy Signal: Look for a "Buy" label on the chart, indicating a potential entry point when the price is oversold and RSI signals upward momentum.
- Sell Signal: Look for a "Sell" label on the chart, indicating a potential exit point when the price is overbought and RSI signals downward momentum.
3. Trade Execution:
- Use the buy and sell signals to guide your trade entries and exits, aligning them with your overall trading strategy.
- Monitor the counter labels to understand the strength and frequency of signals, helping you make informed decisions.
4. Adjust and Optimize:
- Regularly review and adjust the indicator parameters based on market conditions and backtesting results.
- Combine this indicator with other technical analysis tools to enhance your trading accuracy and performance.
5. Monitor DCA Values:
- Enable the table label to display the number of positions and average entry prices (DCA) for both buy and sell signals.
- Use this information to assess the cost basis of your trades and make strategic adjustments as needed.
Conclusion:
The Adaptive Bollinger-RSI Trend Signal is a powerful and versatile trading tool designed to help traders identify and capitalize on trend reversals with confidence. By combining the strengths of Bollinger Bands and RSI, this indicator provides clear and reliable signals, making it an essential addition to any trader's toolkit. Customize the settings, interpret the signals, and execute your trades with precision using this comprehensive indicator.

Volume Based S/R with EMA Crossover SignalsThis Pine Script indicator, titled "Volume Based S/R with EMA Crossover Signals," is designed for use on the TradingView platform and overlays on price charts to help traders identify potential buy and sell opportunities based on volume changes and EMA (Exponential Moving Average) crossovers. Let's break down its components for a detailed understanding:
Inputs
length: The number of bars used to calculate the standard deviation of the volume change. This parameter helps in identifying significant changes in volume over a specified period.
threshold: A multiplier applied to the standard deviation of volume change to determine significant spikes in volume, which are then used to identify support and resistance levels.
smoothLength: The length of the EMA used to smooth the price data, providing a clearer view of the overall price trend and helping to confirm trade signals.
fastEMALength and slowEMALength: The lengths of the fast and slow EMAs, respectively. These are used to generate crossover signals, where the crossing of the fast EMA over the slow EMA may indicate a potential entry or exit point.
Calculations
Volume Change and Standard Deviation: The script calculates the percentage change in volume from one bar to the next and then computes the standard deviation of these changes over the specified length. This process helps identify unusual volume activity, which can precede significant price movements.
Signal Generation Based on Volume: When the absolute value of the volume change divided by its standard deviation exceeds the threshold, it signals significant volume activity, potentially indicating strong support or resistance levels at previous highs or lows.
Smoothed Price: An EMA applied to the closing prices over smoothLength bars helps to confirm the trend direction and filter out noise.
EMA Crossover Signals: The script calculates two EMAs based on the fastEMALength and slowEMALength inputs. A crossover of these two averages generates potential buy or sell signals.
Logic for Buy/Sell Signals
Buy Signal: Generated when the price is above the identified support level (determined by significant volume activity), the fast EMA crosses above the slow EMA, and the price is also above the smoothed price. This confluence of conditions suggests upward momentum and potential buying opportunity.
Sell Signal: The opposite conditions generate a sell signal — when the price is below the identified resistance level, the fast EMA crosses below the slow EMA, and the price is below the smoothed price, indicating downward momentum and a potential selling opportunity.
Plotting
Support and Resistance Levels: Plotted as circles on the chart, with resistance levels in red and support levels in green, based on significant volume activity.
Smoothed Price and EMAs: The smoothed price line and both EMAs are plotted on the chart to help visually assess the trend and the crossover signals.
Buy and Sell Signals: Represented by shapes plotted on the chart, indicating the recommended trading action (buy or sell) based on the combined indicator logic.
Filling Between Support and Resistance: For visual clarity, the area between the identified support and resistance levels is filled, highlighting the range within which the price is expected to fluctuate.
This indicator offers a multi-faceted approach to trading, combining volume analysis with trend following via EMA crossovers. By identifying significant volume-based support and resistance levels and confirming trend direction with EMA crossovers and smoothed price trends, traders can make more informed decisions regarding entry and exit points. However, it's important to use this indicator as part of a comprehensive trading strategy, considering other factors such as market conditions, news, and technical analysis from other indicators.
buy/sell signals with Support/Resistance (InvestYourAsset) 📣The present indicator is a MACD based buy/sell signals indicator with support and resistance, that can be used to identify potential buy and sell signals in a security's price.
📣It is based on the MACD (Moving Average Convergence Divergence) indicator, which is a momentum indicator that shows the relationship between two moving averages of a security's price.
📣 The indicator also plots support and resistance levels, which can be used to confirm buy and sell signals. The support and resistance can also be used as a stoploss for existing position.
👉 To use the indicator, simply add it to your trading chart. The indicator will plot three sections:
📈 Price and Signals: This section plots the security's price and the MACD buy and sell signals.
📈 MACD Oscillator: This section plots the MACD oscillator, which is a histogram that shows the difference between the two moving averages.
📈 Moving Averages: This section plots the two moving averages that the MACD oscillator is based on.
📈 Support and Resistance: This section plots support and resistance levels, which are calculated based on the security's recent price action.
👉 To identify buy and sell signals, you can look for the following:
📈 Buy signal: When shorter Moving Average crosses over longer Moving Average.
📈 Sell signal: When shorter moving average crosses under longer moving average.
📈 You can also look for divergences between the MACD oscillator and the security's price. A divergence occurs when the MACD oscillator is moving in one direction, but the security's price is moving in the opposite direction. Divergences can be a sign of a potential trend reversal.
👉 To confirm buy and sell signals, you can look for support and resistance levels take a look at below snapshot. If a buy signal occurs at a support level, it is a stronger signal than if it occurs at a random price level. Similarly, if a sell signal occurs at a resistance level, it is a stronger signal than if it occurs at a random price level.
⚡ Here is a example of how to use the indicator to identify buy signal:
☑ Add the indicator to your trading chart.
☑Look for a buy signal when short MA crosses over Long MA.
☑Look for the buy signal to occur at a support level.
☑Enter a long position at the next candle.
☑Place a stop loss order below the support level.
☑Take profit when the MACD line crosses below the signal line, or when the security reaches a resistance level.
⚡ Here is an example of how to use the indicator to identify a sell signal:
☑Add the indicator to your trading chart.
☑Look for a sell signal, when shorter moving average crosses under longer moving average.
☑Look for the sell signal to occur at a resistance level.
☑Enter a short position at the next candle.
☑Place a stop loss order above the resistance level.
☑Take profit when the MACD line crosses above the signal line, or when the security reaches a support level.
✅Things to consider while using the indicator:
📈Look for buy signals in an uptrend and sell signals in a downtrend. This will increase the likelihood of your trades being successful.
📈Place your stop losses below the previous swing low or support for buy signals and above the previous swing high or resistance for sell signals. This will help to limit your losses if the trade goes against you.
📈Consider taking profits at key resistance and support levels. This will help you to lock in your profits and avoid giving them back to the market.
Follow us for timely updates regarding indicators that we may publish in future and give it a like if you appreciate the indicator.

Mars Signals - Ultimate Institutional Suite v3.0(Joker)Comprehensive Trading Manual
Mars Signals – Ultimate Institutional Suite v3.0 (Joker)
## Chapter 1 – Philosophy & System Architecture
This script is not a simple “buy/sell” indicator.
Mars Signals – UIS v3.0 (Joker) is designed as an institutional-style analytical assistant that layers several methodologies into a single, coherent framework.
The system is built on four core pillars:
1. Smart Money Concepts (SMC)
- Detection of Order Blocks (professional demand/supply zones).
- Detection of Fair Value Gaps (FVGs) (price imbalances).
2. Smart DCA Strategy
- Combination of RSI and Bollinger Bands
- Identifies statistically discounted zones for scaling into spot positions or exiting shorts.
3. Volume Profile (Visible Range Simulation)
- Distribution of volume by price, not by time.
- Identification of POC (Point of Control) and high-/low-volume areas.
4. Wyckoff Helper – Spring
- Detection of bear traps, liquidity grabs, and sharp bullish reversals.
All four pillars feed into a Confluence Engine (Scoring System).
The final output is presented in the Dashboard, with a clear, human-readable signal:
- STRONG LONG 🚀
- WEAK LONG ↗
- NEUTRAL / WAIT
- WEAK SHORT ↘
- STRONG SHORT 🩸
This allows the trader to see *how many* and *which* layers of the system support a bullish or bearish bias at any given time.
## Chapter 2 – Settings Overview
### 2.1 General & Dashboard Group
- Show Dashboard Panel (`show_dash`)
Turns the dashboard table in the corner of the chart ON/OFF.
- Show Signal Recommendation (`show_rec`)
- If enabled, the textual signal (STRONG LONG, WEAK SHORT, etc.) is displayed.
- If disabled, you only see feature status (ON/OFF) and the current price.
- Dashboard Position (`dash_pos`)
Determines where the dashboard appears on the chart:
- `Top Right`
- `Bottom Right`
- `Top Left`
### 2.2 Smart Money (SMC) Group
- Enable SMC Strategy (`show_smc`)
Globally enables or disables the Order Block and FVG logic.
- Order Block Pivot Lookback (`ob_period`)
Main parameter for detecting key pivot highs/lows (swing points).
- Default value: 5
- Concept:
A bar is considered a pivot low if its low is lower than the lows of the previous 5 and the next 5 bars.
Similarly, a pivot high has a high higher than the previous 5 and the next 5 bars.
These pivots are used as anchors for Order Blocks.
- Increasing `ob_period`:
- Fewer levels.
- But levels tend to be more significant and reliable.
- In highly volatile markets (major news, war events, FOMC, etc.),
using values 7–10 is recommended to filter out weak levels.
- Show Fair Value Gaps (`show_fvg`)
Enables/disables the drawing of FVG zones (imbalances).
- Bullish OB Color (`c_ob_bull`)
- Color of Bullish Order Blocks (Demand Zones).
- Default: semi-transparent green (transparency ≈ 80).
- Bearish OB Color (`c_ob_bear`)
- Color of Bearish Order Blocks (Supply Zones).
- Default: semi-transparent red.
- Bullish FVG Color (`c_fvg_bull`)
- Color of Bullish FVG (upward imbalance), typically yellow.
- Bearish FVG Color (`c_fvg_bear`)
- Color of Bearish FVG (downward imbalance), typically purple.
### 2.3 Smart DCA Strategy Group
- Enable DCA Zones (`show_dca`)
Enables the Smart DCA logic and visual labels.
- RSI Length (`rsi_len`)
Lookback period for RSI (default: 14).
- Shorter → more sensitive, more noise.
- Longer → fewer signals, higher reliability.
- Bollinger Bands Length (`bb_len`)
Moving average period for Bollinger Bands (default: 20).
- BB Multiplier (`bb_mult`)
Standard deviation multiplier for Bollinger Bands (default: 2.0).
- For extremely volatile markets, values like 2.5–3.0 can be used so that only extreme deviations trigger a DCA signal.
### 2.4 Volume Profile (Visible Range Sim) Group
- Show Volume Profile (`show_vp`)
Enables the simulated Volume Profile bars on the right side of the chart.
- Volume Lookback Bars (`vp_lookback`)
Number of bars used to compute the Volume Profile (default: 150).
- Higher values → broader historical context, heavier computation.
- Row Count (`vp_rows`)
Number of vertical price segments (rows) to divide the total price range into (default: 30).
- Width (%) (`vp_width`)
Relative width of each volume bar as a percentage.
In the code, bar widths are scaled relative to the row with the maximum volume.
> Technical note: Volume Profile calculations are executed only on the last bar (`barstate.islast`) to keep the script performant even on higher timeframes.
### 2.5 Wyckoff Helper Group
- Show Wyckoff Events (`show_wyc`)
Enables detection and plotting of Wyckoff Spring events.
- Volume MA Length (`vol_ma_len`)
Length of the moving average on volume.
A bar is considered to have Ultra Volume if its volume is more than 2× the volume MA.
## Chapter 3 – Smart Money Strategy (Order Blocks & FVG)
### 3.1 What Is an Order Block?
An Order Block (OB) represents the footprint of large institutional orders:
- Bullish Order Block (Demand Zone)
The last selling region (bearish candle/cluster) before a strong upward move.
- Bearish Order Block (Supply Zone)
The last buying region (bullish candle/cluster) before a strong downward move.
Institutions and large players place heavy orders in these regions. Typical price behavior:
- Price moves away from the zone.
- Later returns to the same zone to fill unfilled orders.
- Then continues the larger trend.
In the script:
- If `pl` (pivot low) forms → a Bullish OB is created.
- If `ph` (pivot high) forms → a Bearish OB is created.
The box is drawn:
- From `bar_index ` to `bar_index`.
- Between `low ` and `high `.
- `extend=extend.right` extends the OB into the future, so it acts as a dynamic support/resistance zone.
- Only the last 4 OB boxes are kept to avoid clutter.
### 3.2 Order Block Color Guide
- Semi-transparent Green (`c_ob_bull`)
- Represents a Bullish Order Block (Demand Zone).
- Interpretation: a price region with a high probability of bullish reaction.
- Semi-transparent Red (`c_ob_bear`)
- Represents a Bearish Order Block (Supply Zone).
- Interpretation: a price region with a high probability of bearish reaction.
Overlap (Multiple OBs in the Same Area)
When two or more Order Blocks overlap:
- The shared area appears visually denser/stronger.
- This suggests higher order density.
- Such zones can be treated as high-priority levels for entries, exits, and stop-loss placement.
### 3.3 Demand/Supply Logic in the Scoring Engine
is_in_demand = low <= ta.lowest(low, 20)
is_in_supply = high >= ta.highest(high, 20)
- If current price is near the lowest lows of the last 20 bars, it is considered in a Demand Zone → positive impact on score.
- If current price is near the highest highs of the last 20 bars, it is considered in a Supply Zone → negative impact on score.
This logic complements Order Blocks and helps the Dashboard distinguish whether:
- Market is currently in a statistically cheap (long-friendly) area, or
- In a statistically expensive (short-friendly) area.
### 3.4 Fair Value Gaps (FVG)
#### Concept
When the market moves aggressively:
- Some price levels are skipped and never traded.
- A gap between wicks/shadows of consecutive candles appears.
- These regions are called Fair Value Gaps (FVGs) or Imbalances.
The market generally “dislikes” imbalance and often:
- Returns to these zones in the future.
- Fills the gap (rebalance).
- Then resumes its dominant direction.
#### Implementation in the Code
Bullish FVG (Yellow)
fvg_bull_cond = show_smc and show_fvg and low > high and close > high
if fvg_bull_cond
box.new(bar_index , high , bar_index, low, ...)
Core condition:
`low > high ` → the current low is above the high of two bars ago; the space between them is an untraded gap.
Bearish FVG (Purple)
fvg_bear_cond = show_smc and show_fvg and high < low and close < low
if fvg_bear_cond
box.new(bar_index , low , bar_index, high, ...)
Core condition:
`high < low ` → the current high is below the low of two bars ago; again a price gap exists.
#### FVG Color Guide
- Transparent Yellow (`c_fvg_bull`) – Bullish FVG
Often acts like a magnet for price:
- Price tends to retrace into this zone,
- Fill the imbalance,
- And then continue higher.
- Transparent Purple (`c_fvg_bear`) – Bearish FVG
Price tends to:
- Retrace upward into the purple area,
- Fill the imbalance,
- And then resume downward movement.
#### Trading with FVGs
- FVGs are *not* standalone entry signals.
They are best used as:
- Targets (take-profit zones), or
- Reaction areas where you expect a pause or reversal.
Examples:
- If you are long, a bearish FVG above is often an excellent take-profit zone.
- If you are short, a bullish FVG below is often a good cover/exit zone.
### 3.5 Core SMC Trading Templates
#### Reversal Long
1. Price trades down into a green Order Block (Demand Zone).
2. A bullish confirmation candle (Close > Open) forms inside or just above the OB.
3. If this zone is close to or aligned with a bullish FVG (yellow), the signal is reinforced.
4. Entry:
- At the close of the confirmation candle, or
- Using a limit order near the upper boundary of the OB.
5. Stop-loss:
- Slightly below the OB.
- If the OB is broken decisively and price consolidates below it, the zone loses validity.
6. Targets:
- The next FVG,
- Or the next red Order Block (Supply Zone) above.
#### Reversal Short
The mirror scenario:
- Price rallies into a red Order Block (Supply).
- A bearish confirmation candle forms (Close < Open).
- FVG/premium structure above can act as a confluence.
- Stop-loss goes above the OB.
- Targets: lower FVGs or subsequent green OBs below.
## Chapter 4 – Smart DCA Strategy (RSI + Bollinger Bands)
### 4.1 Smart DCA Concept
- Classic DCA = buying at fixed time intervals regardless of price.
- Smart DCA = scaling in only when:
- Price is statistically cheaper than usual, and
- The market is in a clear oversold condition.
Code logic:
rsi_val = ta.rsi(close, rsi_len)
= ta.bb(close, bb_len, bb_mult)
dca_buy = show_dca and rsi_val < 30 and close < bb_lower
dca_sell = show_dca and rsi_val > 70 and close > bb_upper
Conditions:
- DCA Buy – Smart Scale-In Zone
- RSI < 30 → oversold.
- Close < lower Bollinger Band → price has broken below its typical volatility envelope.
- DCA Sell – Overbought/Distribution Zone
- RSI > 70 → overbought.
- Close > upper Bollinger Band → price is extended far above the mean.
### 4.2 Visual Representation on the Chart
- Green “DCA” Label Below Candle
- Shape: `labelup`.
- Color: lime background, white text.
- Meaning: statistically attractive level for laddered spot entries or short exits.
- Red “SELL” Label Above Candle
- Warning that the market is in an extended, overbought condition.
- Suitable for profit-taking on longs or considering short entries (with proper confluence and risk management).
- Light Green Background (`bgcolor`)
- When `dca_buy` is true, the candle background turns very light green (high transparency).
- This helps visually identify DCA Zones across the chart at a glance.
### 4.3 Practical Use in Trading
#### Spot Trading
Used to build a better average entry price:
- Every time a DCA label appears, allocate a fixed portion of capital (e.g., 2–5%).
- Combining DCA signals with:
- Green OBs (Demand Zones), and/or
- The Volume Profile POC
makes the zone structurally more important.
#### Futures Trading
- Longs
- Use DCA Buy signals as low-risk zones for opening or adding to longs when:
- Price is inside a green OB, or
- The Dashboard already leans LONG.
- Shorts
- Use DCA Sell signals as:
- Exit zones for longs, or
- Areas to initiate shorts with stops above structural highs.
## Chapter 5 – Volume Profile (Visible Range Simulation)
### 5.1 Concept
Traditional volume (histogram under the chart) shows volume over time.
Volume Profile shows volume by price level:
- At which prices has the highest trading activity occurred?
- Where did buyers and sellers agree the most (High Volume Nodes – HVNs)?
- Where did price move quickly due to low participation (Low Volume Nodes – LVNs)?
### 5.2 Implementation in the Script
Executed only when `show_vp` is enabled and on the last bar:
1. The last `vp_lookback` bars (default 150) are processed.
2. The minimum low and maximum high over this window define the price range.
3. This price range is divided into `vp_rows` segments (e.g., 30 rows).
4. For each row:
- All bars are scanned.
- If the mid-price `(high + low ) / 2` falls inside a row, that bar’s volume is added to the row total.
5. The row with the greatest volume is stored as `max_vol_idx` (the POC row).
6. For each row, a volume box is drawn on the right side of the chart.
### 5.3 Color Scheme
- Semi-transparent Orange
- The row with the maximum volume – the Point of Control (POC).
- Represents the strongest support/resistance level from a volume perspective.
- Semi-transparent Blue
- Other volume rows.
- The taller the bar → the higher the volume → the stronger the interest at that price band.
### 5.4 Trading Applications
- If price is above POC and retraces back into it:
→ POC often acts as support, suitable for long setups.
- If price is below POC and rallies into it:
→ POC often acts as resistance, suitable for short setups or profit-taking.
HVNs (Tall Blue Bars)
- Represent areas of equilibrium where the market has spent time and traded heavily.
- Price tends to consolidate here before choosing a direction.
LVNs (Short or Nearly Empty Bars)
- Represent low participation zones.
- Price often moves quickly through these areas – useful for targeting fast moves.
## Chapter 6 – Wyckoff Helper – Spring
### 6.1 Spring Concept
In the Wyckoff framework:
- A Spring is a false break of support.
- The market briefly trades below a well-defined support level, triggers stop losses,
then sharply reverses upward as institutional buyers absorb liquidity.
This movement:
- Clears out weak hands (retail sellers).
- Provides large players with liquidity to enter long positions.
- Often initiates a new uptrend.
### 6.2 Code Logic
Conditions for a Spring:
1. The current low is lower than the lowest low of the previous 50 bars
→ apparent break of a long-standing support.
2. The bar closes bullish (Close > Open)
→ the breakdown was rejected.
3. Volume is significantly elevated:
→ `volume > 2 × volume_MA` (Ultra Volume).
When all conditions are met and `show_wyc` is enabled:
- A pink diamond is plotted below the bar,
- With the label “Spring” – one of the strongest long signals in this system.
### 6.3 Trading Use
- After a valid Spring, markets frequently enter a meaningful bullish phase.
- The highest quality setups occur when:
- The Spring forms inside a green Order Block, and
- Near or on the Volume Profile POC.
Entries:
- At the close of the Spring bar, or
- On the first pullback into the mid-range of the Spring candle.
Stop-loss:
- Slightly below the Spring’s lowest point (wick low plus a small buffer).
## Chapter 7 – Confluence Engine & Dashboard
### 7.1 Scoring Logic
For each bar, the script:
1. Resets `score` to 0.
2. Adjusts the score based on different signals.
SMC Contribution
if show_smc
if is_in_demand
score += 1
if is_in_supply
score -= 1
- Being in Demand → `+1`
- Being in Supply → `-1`
DCA Contribution
if show_dca
if dca_buy
score += 2
if dca_sell
score -= 2
- DCA Buy → `+2` (strong, statistically driven long signal)
- DCA Sell → `-2`
Wyckoff Spring Contribution
if show_wyc
if wyc_spring
score += 2
- Spring → `+2` (entry of strong money)
### 7.2 Mapping Score to Dashboard Signal
- score ≥ 2 → STRONG LONG 🚀
Multiple bullish conditions aligned.
- score = 1 → WEAK LONG ↗
Some bullish bias, but only one layer clearly positive.
- score = 0 → NEUTRAL / WAIT
Rough balance between buying and selling forces; staying flat is usually preferable.
- score = -1 → WEAK SHORT ↘
Mild bearish bias, suited for cautious or short-term plays.
- score ≤ -2 → STRONG SHORT 🩸
Convergence of several bearish signals.
### 7.3 Dashboard Structure
The dashboard is a two-column table:
- Row 0
- Column 0: `"Mars Signals"` – black background, white text.
- Column 1: `"UIS v3.0"` – black background, yellow text.
- Row 1
- Column 0: `"Price:"` (light grey background).
- Column 1: current closing price (`close`) with a semi-transparent blue background.
- Row 2
- Column 0: `"SMC:"`
- Column 1:
- `"ON"` (green) if `show_smc = true`
- `"OFF"` (grey) otherwise.
- Row 3
- Column 0: `"DCA:"`
- Column 1:
- `"ON"` (green) if `show_dca = true`
- `"OFF"` (grey) otherwise.
- Row 4
- Column 0: `"Signal:"`
- Column 1: signal text (`status_txt`) with background color `status_col`
(green, red, teal, maroon, etc.)
- If `show_rec = false`, these cells are cleared.
## Chapter 8 – Visual Legend (Colors, Shapes & Actions)
For quick reading inside TradingView, the visual elements are described line by line instead of a table.
Chart Element: Green Box
Color / Shape: Transparent green rectangle
Core Meaning: Bullish Order Block (Demand Zone)
Suggested Trader Response: Look for longs, Smart DCA adds, closing or reducing shorts.
Chart Element: Red Box
Color / Shape: Transparent red rectangle
Core Meaning: Bearish Order Block (Supply Zone)
Suggested Trader Response: Look for shorts, or take profit on existing longs.
Chart Element: Yellow Area
Color / Shape: Transparent yellow zone
Core Meaning: Bullish FVG / upside imbalance
Suggested Trader Response: Short take-profit zone or expected rebalance area.
Chart Element: Purple Area
Color / Shape: Transparent purple zone
Core Meaning: Bearish FVG / downside imbalance
Suggested Trader Response: Long take-profit zone or temporary supply region.
Chart Element: Green "DCA" Label
Color / Shape: Green label with white text, plotted below the candle
Core Meaning: Smart ladder-in buy zone, DCA buy opportunity
Suggested Trader Response: Spot DCA entry, partial short exit.
Chart Element: Red "SELL" Label
Color / Shape: Red label with white text, plotted above the candle
Core Meaning: Overbought / distribution zone
Suggested Trader Response: Take profit on longs, consider initiating shorts.
Chart Element: Light Green Background (bgcolor)
Color / Shape: Very transparent light-green background behind bars
Core Meaning: Active DCA Buy zone
Suggested Trader Response: Treat as a discount zone on the chart.
Chart Element: Orange Bar on Right
Color / Shape: Transparent orange horizontal bar in the volume profile
Core Meaning: POC – price with highest traded volume
Suggested Trader Response: Strong support or resistance; key reference level.
Chart Element: Blue Bars on Right
Color / Shape: Transparent blue horizontal bars in the volume profile
Core Meaning: Other volume levels, showing high-volume and low-volume nodes
Suggested Trader Response: Use to identify balance zones (HVN) and fast-move corridors (LVN).
Chart Element: Pink "Spring" Diamond
Color / Shape: Pink diamond with white text below the candle
Core Meaning: Wyckoff Spring – liquidity grab and potential major bullish reversal
Suggested Trader Response: One of the strongest long signals in the suite; look for high-quality long setups with tight risk.
Chart Element: STRONG LONG in Dashboard
Color / Shape: Green background, white text in the Signal row
Core Meaning: Multiple bullish layers in confluence
Suggested Trader Response: Consider initiating or increasing longs with strict risk management.
Chart Element: STRONG SHORT in Dashboard
Color / Shape: Red background, white text in the Signal row
Core Meaning: Multiple bearish layers in confluence
Suggested Trader Response: Consider initiating or increasing shorts with a logical, well-placed stop.
## Chapter 9 – Timeframe-Based Trading Playbook
### 9.1 Timeframe Selection
- Scalping
- Timeframes: 1M, 5M, 15M
- Objective: fast intraday moves (minutes to a few hours).
- Recommendation: focus on SMC + Wyckoff.
Smart DCA on very low timeframes may introduce excessive noise.
- Day Trading
- Timeframes: 15M, 1H, 4H
- Provides a good balance between signal quality and frequency.
- Recommendation: use the full stack – SMC + DCA + Volume Profile + Wyckoff + Dashboard.
- Swing Trading & Position Investing
- Timeframes: Daily, Weekly
- Emphasis on Smart DCA + Volume Profile.
- SMC and Wyckoff are used mainly to fine-tune swing entries within larger trends.
### 9.2 Scenario A – Scalping Long
Example: 5-Minute Chart
1. Price is declining into a green OB (Bullish Demand).
2. A candle with a long lower wick and bullish close (Pin Bar / Rejection) forms inside the OB.
3. A Spring diamond appears below the same candle → very strong confluence.
4. The Dashboard shows at least WEAK LONG ↗, ideally STRONG LONG 🚀.
5. Entry:
- On the close of the confirmation candle, or
- On the first pullback into the mid-range of that candle.
6. Stop-loss:
- Slightly below the OB.
7. Targets:
- Nearby bearish FVG above, and/or
- The next red OB.
### 9.3 Scenario B – Day-Trading Short
Recommended Timeframes: 1H or 4H
1. The market completes a strong impulsive move upward.
2. Price enters a red Order Block (Supply).
3. In the same zone, a purple FVG appears or remains unfilled.
4. On a lower timeframe (e.g., 15M), RSI enters overbought territory and a DCA Sell signal appears.
5. The main timeframe Dashboard (1H) shows WEAK SHORT ↘ or STRONG SHORT 🩸.
Trade Plan
- Open a short near the upper boundary of the red OB.
- Place the stop above the OB or above the last swing high.
- Targets:
- A yellow FVG lower on the chart, and/or
- The next green OB (Demand) below.
### 9.4 Scenario C – Swing / Investment with Smart DCA
Timeframes: Daily / Weekly
1. On the daily or weekly chart, each time a green “DCA” label appears:
- Allocate a fixed fraction of your capital (e.g., 3–5%) to that asset.
2. Check whether this DCA zone aligns with the orange POC of the Volume Profile:
- If yes → the quality of the entry zone is significantly higher.
3. If the DCA signal sits inside a daily green OB, the probability of a medium-term bottom increases.
4. Always build the position laddered, never all-in at a single price.
Exits for investors:
- Near weekly red OBs or large purple FVG zones.
- Ideally via partial profit-taking rather than closing 100% at once.
### 9.5 Case Study 1 – BTCUSDT (15-Minute)
- Context: Price has sold off down towards 65,000 USD.
- A green OB had previously formed at that level.
- Near the lower boundary of this OB, a partially filled yellow FVG is present.
- As price returns to this region, a Spring appears.
- The Dashboard shifts from NEUTRAL / WAIT to WEAK LONG ↗.
Plan
- Enter a long near the OB low.
- Place stop below the Spring low.
- First target: a purple FVG around 66,200.
- Second (optional) target: the first red OB above that level.
### 9.6 Case Study 2 – Meme Coin (PEPE – 4H)
- After a strong pump, price enters a corrective phase.
- On the 4H chart, RSI drops below 30; price breaks below the lower Bollinger Band → a DCA label prints.
- The Volume Profile shows the POC at approximately the same level.
- The Dashboard displays STRONG LONG 🚀.
Plan
- Execute laddered buys in the combined DCA + POC zone.
- Place a protective stop below the last significant swing low.
- Target: an expected 20–30% upside move towards the next red OB or purple FVG.
## Chapter 10 – Risk Management, Psychology & Advanced Tuning
### 10.1 Risk Management
No signal, regardless of its strength, replaces risk control.
Recommendations:
- In futures, do not expose more than 1–3% of account equity to risk per trade.
- Adjust leverage to the volatility of the instrument (lower leverage for highly volatile altcoins).
- Place stop-losses in zones where the idea is clearly invalidated:
- Below/above the relevant Order Block or Spring, not randomly in the middle of the structure.
### 10.2 Market-Specific Parameter Tuning
- Calmer Markets (e.g., major FX pairs)
- `ob_period`: 3–5.
- `bb_mult`: 2.0 is usually sufficient.
- Highly Volatile Markets (Crypto, news-driven assets)
- `ob_period`: 7–10 to highlight only the most robust OBs.
- `bb_mult`: 2.5–3.0 so that only extreme deviations trigger DCA.
- `vol_ma_len`: increase (e.g., to ~30) so that Spring triggers only on truly exceptional
volume spikes.
### 10.3 Trading Psychology
- STRONG LONG 🚀 does not mean “risk-free”.
It means the probability of a successful long, given the model’s logic, is higher than average.
- Treat Mars Signals as a confirmation and context system, not a full replacement for your own decision-making.
- Example of disciplined thinking:
- The Dashboard prints STRONG LONG,
- But price is simultaneously testing a multi-month macro resistance or a major negative news event is imminent,
- In such cases, trade smaller, widen stops appropriately, or skip the trade.
## Chapter 11 – Technical Notes & FAQ
### 11.1 Does the Script Repaint?
- Order Blocks and Springs are based on completed pivot structures and confirmed candles.
- Until a pivot is confirmed, an OB does not exist; after confirmation, behavior is stable under classic SMC assumptions.
- The script is designed to be structurally consistent rather than repainting signals arbitrarily.
### 11.2 Computational Load of Volume Profile
- On the last bar, the script processes up to `vp_lookback` bars × `vp_rows` rows.
- On very low timeframes with heavy zooming, this can become demanding.
- If you experience performance issues:
- Reduce `vp_lookback` or `vp_rows`, or
- Temporarily disable Volume Profile (`show_vp = false`).
### 11.3 Multi-Timeframe Behavior
- This version of the script is not internally multi-timeframe.
All logic (OB, DCA, Spring, Volume Profile) is computed on the active timeframe only.
- Practical workflow:
- Analyze overall structure and key zones on higher timeframes (4H / Daily).
- Use lower timeframes (15M / 1H) with the same tool for timing entries and exits.
## Conclusion
Mars Signals – Ultimate Institutional Suite v3.0 (Joker) is a multi-layer trading framework that unifies:
- Price structure (Order Blocks & FVG),
- Statistical behavior (Smart DCA via RSI + Bollinger),
- Volume distribution by price (Volume Profile with POC, HVN, LVN),
- Liquidity events (Wyckoff Spring),
into a single, coherent system driven by a transparent Confluence Scoring Engine.
The final output is presented in clear, actionable language:
> STRONG LONG / WEAK LONG / NEUTRAL / WEAK SHORT / STRONG SHORT
The system is designed to support professional decision-making, not to replace it.
Used together with strict risk management and disciplined execution,
Mars Signals – UIS v3.0 (Joker) can serve as a central reference manual and operational guide
for your trading workflow, from scalping to swing and investment positioning.

MULTI-CONDITION RSI SIGNAL GENERATOR═══════════════════════════════════════════════
MULTI-CONDITION RSI SIGNAL GENERATOR
═══════════════════════════════════════════════
OVERVIEW:
This indicator generates trading signals based on Relative Strength Index (RSI) movements with multiple confirmation layers designed to filter false signals and identify high-probability reversal opportunities.
═══════════════════════════════════════════════
WHAT MAKES THIS ORIGINAL:
═══════════════════════════════════════════════
Unlike basic RSI indicators that simply plot overbought/oversold crossovers, this system combines FOUR distinct confirmation mechanisms:
1. PERSISTENCE FILTERING - Requires RSI to remain in extreme zones for a minimum duration
2. LOOKBACK VALIDATION - Verifies recent extreme zone visits before signaling
3. DIVERGENCE DETECTION - Identifies price/RSI divergence for stronger signals
4. MOMENTUM CONFIRMATION - Provides trend-continuation entries via midline crosses
This multi-layered approach significantly reduces whipsaw trades that plague simple RSI crossover systems.
═══════════════════════════════════════════════
HOW IT WORKS (TECHNICAL METHODOLOGY):
═══════════════════════════════════════════════
STEP 1: RSI CALCULATION
- Standard RSI calculation using user-defined period (default: 14)
- Monitors two extreme zones: Overbought (default: 70) and Oversold (default: 30)
STEP 2: PERSISTENCE FILTERING
The script counts how many bars RSI has spent in extreme zones within the lookback period:
- For overbought signals: Counts bars where RSI > 70
- For oversold signals: Counts bars where RSI < 30
- Signal only triggers if count >= Minimum Duration (default: 4 bars)
This filters out brief spikes that immediately reverse, focusing on sustained extreme conditions that are more likely to lead to genuine reversals.
STEP 3: LOOKBACK VALIDATION
- Checks if RSI reached extreme zones within the Lookback Bars period (default: 20)
- Uses ta.highest() and ta.lowest() functions to verify recent extremes
- Ensures we're trading reversals from meaningful extremes, not random crossovers
STEP 4: BASIC SIGNAL GENERATION
- BUY SIGNAL: RSI crosses above the oversold level (30) after meeting persistence and lookback conditions
- SELL SIGNAL: RSI crosses below the overbought level (70) after meeting persistence and lookback conditions
STEP 5: DIVERGENCE DETECTION
The script identifies two types of divergence over the Divergence Lookback period (default: 5 bars):
A) BULLISH DIVERGENCE (indicates potential upward reversal):
- Price makes a lower low (current low < previous low)
- RSI makes a higher low (current RSI low > previous RSI low)
- Suggests weakening downward momentum
B) BEARISH DIVERGENCE (indicates potential downward reversal):
- Price makes a higher high (current high > previous high)
- RSI makes a lower high (current RSI high < previous RSI high)
- Suggests weakening upward momentum
STEP 6: STRONG SIGNAL CONFIRMATION
- STRONG BUY: Basic buy signal + bullish divergence present
- STRONG SELL: Basic sell signal + bearish divergence present
- These represent the highest-probability setups
STEP 7: MOMENTUM SIGNALS (OPTIONAL)
- MOMENTUM BUY: RSI crosses above 50 after being oversold (trend continuation)
- MOMENTUM SELL: RSI crosses below 50 after being overbought (trend continuation)
- Smaller signals for traders who want trend-following entries
═══════════════════════════════════════════════
SIGNAL TYPES AND VISUAL INDICATORS:
═══════════════════════════════════════════════
📈 GREEN TRIANGLE (below bar) - Standard Buy Signal
RSI crossed above oversold level with confirmation filters
📉 RED TRIANGLE (above bar) - Standard Sell Signal
RSI crossed below overbought level with confirmation filters
🔵 BLUE TRIANGLE (below bar) - Strong Buy Signal
Buy signal + bullish divergence (HIGHEST PRIORITY)
🟣 PURPLE TRIANGLE (above bar) - Strong Sell Signal
Sell signal + bearish divergence (HIGHEST PRIORITY)
🟢 GREEN CIRCLE (small) - Momentum Buy
RSI crosses above 50 after oversold conditions
🔴 RED CIRCLE (small) - Momentum Sell
RSI crosses below 50 after overbought conditions
BACKGROUND SHADING:
- Light red background: RSI currently overbought
- Light green background: RSI currently oversold
═══════════════════════════════════════════════
PARAMETER SETTINGS:
═══════════════════════════════════════════════
1. OVERBOUGHT LEVEL (default: 70, range: 50-90)
- Higher values = fewer but stronger overbought signals
- Lower values = more sensitive to overbought conditions
- Recommended: 70 for standard markets, 80 for crypto/volatile assets
2. OVERSOLD LEVEL (default: 30, range: 10-50)
- Lower values = fewer but stronger oversold signals
- Higher values = more sensitive to oversold conditions
- Recommended: 30 for standard markets, 20 for crypto/volatile assets
3. RSI PERIOD (default: 14, range: 2-50)
- Standard RSI calculation period
- Lower = more sensitive/faster signals
- Higher = smoother/slower signals
- Recommended: 14 (industry standard)
4. MINIMUM DURATION (default: 4, range: 1-20)
- Required bars in extreme zone before signal
- Higher values = fewer signals but better quality
- Lower values = more signals but more false positives
- Recommended: 3-5 for day trading, 5-10 for swing trading
5. LOOKBACK BARS (default: 20, range: 5-100)
- How far back to check for extreme zone visits
- Should match your typical trading timeframe
- Recommended: 20 for intraday, 50 for daily charts
6. DIVERGENCE LOOKBACK (default: 5, range: 2-20)
- Period for comparing price/RSI highs and lows
- Lower values = more frequent divergence signals
- Higher values = more significant divergences
- Recommended: 5-10 depending on timeframe
═══════════════════════════════════════════════
HOW TO USE THIS INDICATOR:
═══════════════════════════════════════════════
RECOMMENDED TRADING APPROACH:
1. PRIMARY ENTRIES: Focus on Strong Buy/Sell signals (blue/purple triangles)
- These have the highest win rate due to divergence confirmation
- Wait for price action confirmation (support/resistance, candlestick patterns)
2. SECONDARY ENTRIES: Regular Buy/Sell signals (green/red triangles)
- Use these when Strong signals are infrequent
- Require additional confirmation from other indicators or chart patterns
3. TREND CONTINUATION: Momentum signals (small circles)
- Best used when overall trend is clear
- Not recommended for reversal trading
4. FILTER TRADES: Use background shading as context
- Be cautious entering longs when background is red (overbought)
- Be cautious entering shorts when background is green (oversold)
RISK MANAGEMENT GUIDELINES:
- Never risk more than 2-5% of capital per trade
- Use stop losses below recent swing lows (buys) or above swing highs (sells)
- Target at least 1.5:1 reward-to-risk ratio
- Consider position sizing based on signal strength
TIMEFRAME RECOMMENDATIONS:
- 15min - 1hour: Day trading with adjusted parameters (lower minimum duration)
- 4hour - Daily: Swing trading with default parameters
- Weekly: Position trading with increased lookback periods
COMPLEMENTARY TOOLS:
This indicator works best when combined with:
- Support and resistance levels
- Trend indicators (moving averages, trend lines)
- Volume analysis
- Price action patterns (engulfing candles, pin bars)
═══════════════════════════════════════════════
LIMITATIONS AND CONSIDERATIONS:
═══════════════════════════════════════════════
- This is NOT a standalone trading system - requires additional analysis
- RSI-based strategies perform best in ranging/choppy markets
- May generate fewer signals in strong trending markets
- Divergence signals can be early - wait for price confirmation
- Not recommended for highly illiquid assets
- Backtest on your specific market before live trading
- No indicator is 100% accurate - always use proper risk management
═══════════════════════════════════════════════
TECHNICAL NOTES:
═══════════════════════════════════════════════
- Code is original and does not reuse external libraries
- Uses Pine Script v5 native functions only
- Alert conditions included for all signal types
- No repainting - signals appear and remain fixed
- Efficient calculation methods minimize processing load
═══════════════════════════════════════════════
ALERT SETUP:
═══════════════════════════════════════════════
Four alert conditions are available:
1. "Buy Alert" - Triggers on standard buy signals
2. "Sell Alert" - Triggers on standard sell signals
3. "Strong Buy Alert" - Triggers on divergence-confirmed buy signals
4. "Strong Sell Alert" - Triggers on divergence-confirmed sell signals
To set up alerts: Right-click chart → Add Alert → Select desired condition
═══════════════════════════════════════════════
This indicator is provided for educational and informational purposes. Always practice proper risk management and never trade with money you cannot afford to lose.

FVG Zones with Signals█ OVERVIEW
"FVG Zones with Signals" is a technical analysis tool that identifies Fair Value Gaps (FVG) on the chart and draws customizable zones in the form of boxes. It is ideal for traders using price action and market structure strategies, helping to identify potential imbalance zones and trading opportunities based on breakout and exit signals. With flexible size filter settings, box styles, and signal options, the indicator ensures clarity and precision on the chart.
█ CONCEPTS
The indicator is designed to identify potential entry points for trades based on FVG breakouts or retests. For chart clarity, a size filter for FVGs is included, based on a multiplier of the average candle size over a specified period.
Why are FVGs important? FVG zones represent areas of market imbalance, often attracting price back to "fill" the gap. Larger gaps (with a higher size multiplier) have a greater chance of being retested, as they indicate deeper imbalances—leaving more unexecuted orders in those zones, which attracts liquidity. Market makers and institutions often return to these levels to "refresh" liquidity before further moves. However, not every large FVG is retested quickly—in strong trends, smaller imbalances may be ignored, and the location (e.g., near swing highs/lows) is critical for retest probability.
█ FEATURES
- FVG Detection: Identifies bullish and bearish FVGs based on size filters (Candle Size Period and FVG Size Multiplier), with automatic initialization of historical gaps up to 500 candles back.
- Customizable Boxes: Draws FVG boxes with adjustable border colors, background gradients, border styles (solid, dashed, dotted), border widths, and transparency for both the background and the 50% FVG midline.
- Breakout and Exit Signals: Generates "Break" signals (green upward triangle for breakouts above bearish FVG, red downward triangle for breakouts below bullish FVG) and "Exit" signals (circles for exiting the zone), with options to select signal types (Break, Exit, or Both). A break signal causes the box to disappear, leaving a triangle as a trace of the breakout, which may serve as a signal to open a position. Exit signals (circles) may also indicate entry opportunities but require additional confirmation, such as alignment with the main trend.
- Midline: Automatically draws a dashed line at the 50% FVG level with adjustable transparency, aiding in assessing price reactions within the zone.
- Box Limitation: Automatically removes old or inactive FVGs after 500 candles to avoid chart clutter.
- Alerts: Built-in alerts for all signal types, including price and FVG type descriptions.
█ HOW TO USE
Add to Chart: Apply the indicator to your TradingView chart via the Pine Editor or Indicators menu.
Configure Settings:
- FVG Settings: Adjust Candle Size Period (default 20) and FVG Size Multiplier (default 1) to filter out small gaps—higher values generate fewer but more significant FVGs.
- Box Settings: Configure colors and styles for bullish (green) and bearish (red) boxes, including background transparency (default 80) and midline transparency.
- Signal Settings: Select signal types (Break, Exit, or Both) in Signal Type. Breakout signals appear after a candle closes outside the zone, while exit signals appear when exiting an FVG without a full breakout.
- Styling: Customize signal colors (green for buy/up, red for sell/down) and shape sizes.
Interpreting Signals:
- Break Up Signal: A green triangle below the bar indicates a breakout above a bearish FVG, suggesting potential continuation of an uptrend.
- Break Down Signal: A red triangle above the bar indicates a breakout below a bullish FVG, suggesting potential continuation of a downtrend.
- Exit Up/Down Signal: A green/red circle indicates an exit from an FVG without a full breakout, which may signal the end of a correction or preparation for a reversal.
- FVG Zones: If the price returns to an FVG and fills the gap, it may indicate equilibrium; an unfilled gap often leads to a retest.
- Use signals in conjunction with other technical analysis tools for confirmation, such as RSI (to identify overbought/oversold conditions) or MACD (to confirm momentum). Analyze FVGs from higher timeframes—these zones act as stronger imbalance levels and carry greater structural significance.
Exit signals (retests without breakouts) tend to be most effective when traded in line with the current trend.
█ APPLICATIONS
- Price Action Trading: Use FVG zones as dynamic support and resistance levels. In an uptrend, look for buying opportunities in bullish FVGs, where price often tests the gap before continuing. Combining with RSI, MACD, or Fibonacci levels enhances the significance of zones.
- Breakout Strategies: Trade based on breakout signals from FVGs. A buy signal after breaking a bearish FVG may indicate a strong upward impulse, especially when supported by a rising MACD or RSI exiting oversold conditions.
Larger FVG gaps (higher multiplier) have a greater chance of retest, as they indicate deeper imbalances.
█ NOTES
- Test the indicator across different timeframes and markets (stocks, forex, crypto) to optimize size filters for your trading style.
- The indicator initializes historical FVGs up to 500 candles back, which may slow loading on longer charts.
- For best results, use on high-liquidity markets where FVGs are more frequently retested.
- In consolidation zones, the indicator may generate more false signals, so additional confirmation is recommended.

Cyclic Reversal Engine [AlgoPoint]Overview
Most indicators focus on price and momentum, but they often ignore a critical third dimension: time. Markets move in rhythmic cycles of expansion and contraction, but these cycles are not fixed; they speed up in trending markets and slow down in choppy conditions.
The Cyclic Reversal Engine is an advanced analytical tool designed to decode this rhythm. Instead of relying on static, lagging formulas, this indicator learns from past market behavior to anticipate when the current trend is statistically likely to reach its exhaustion point, providing high-probability reversal signals.
It achieves this by combining a sophisticated time analysis with a robust price-action confirmation.
How It Works: The Core Logic
The indicator operates on a multi-stage process to identify potential turning points in the market.
1. Market Regime Analysis (The Brain): Before analyzing any cycles, the indicator first diagnoses the current "personality" of the market. Using a combination of the ADX, Choppiness Index, and RSI, it classifies the market into one of three primary regimes:
- Trending: Strong, directional movement.
- Ranging: Sideways, non-directional chop.
- Reversal: An over-extended state (overbought/oversold) where a turn is imminent.
2. Adaptive Cycle Learning (The "Machine Learning" Aspect): This is the indicator's smartest feature. It constantly analyzes past cycles by measuring the bar-count between significant swing highs and swing lows. Crucially, it learns the average cycle duration for each specific market regime. For example, it learns that "in a strong trending market, a new swing low tends to occur every 35 bars," while "in a ranging market, this extends to 60 bars."
3. The Countdown & Timing Signal: The indicator identifies the last major swing high or low and starts a bar-by-bar countdown. Based on the current market regime, it selects the appropriate learned cycle length from its memory. When the bar count approaches this adaptive target, the indicator determines that a reversal is "due" from a timing perspective.
4. Price Confirmation (The Trigger): A signal is never generated based on timing alone. Once the timing condition is met (the cycle is "due"), the indicator waits for a final price-action confirmation. The default confirmation is the RSI entering an extreme overbought or oversold zone, signaling momentum exhaustion. The signal is only triggered when Time + Price Confirmation align.
How to Use This Indicator
- The Dashboard: The panel in the bottom-right corner is your command center.
- Market Regime: Shows the current market personality analyzed by the engine.
- Adaptive Cycle / Bar Count: This is the core of the indicator. It shows the target cycle length for the current regime (e.g., 50) and the current bar count since the last swing point (e.g., 45). The background turns orange when the bar count enters the "due zone," indicating that you should be on high alert for a reversal.
- BUY/SELL Signals: A label appears on the chart only when the two primary conditions are met:
The timing is right (Bar Count has reached the Adaptive Cycle target).
The price confirms exhaustion (RSI is in an extreme zone).
A BUY signal suggests a downtrend cycle is likely complete, and a SELL signal suggests an uptrend cycle is likely complete.
Key Settings
- Pivot Lookback: Controls the sensitivity of the swing point detection. Higher values will identify more significant, longer-term cycles.
- Market Regime Engine: The ADX, Choppiness, and RSI settings can be fine-tuned to adjust how the indicator classifies the market's personality.
- Require Price Confirmation: You can toggle the RSI confirmation on or off. It is highly recommended to keep it enabled for higher-quality signals.

Cointegration Buy and Sell Signals [EdgeTerminal]The Cointegration Buy And Sell Signals is a sophisticated technical analysis tool to spot high-probability market turning points — before they fully develop on price charts.
Most reversal indicators rely on raw price action, visual patterns, or basic and common indicator logic — which often suffer in noisy or trending markets. In most cases, they lag behind the actual change in trend and provide useless and late signals.
This indicator is rooted in advanced concepts from statistical arbitrage, mean reversion theory, and quantitative finance, and it packages these ideas in a user-friendly visual format that works on any timeframe and asset class.
It does this by analyzing how the short-term and long-term EMAs behave relative to each other — and uses statistical filters like Z-score, correlation, volatility normalization, and stationarity tests to issue highly selective Buy and Sell signals.
This tool provides statistical confirmation of trend exhaustion, allowing you to trade mean-reverting setups. It fades overextended moves and uses signal stacking to reduce false entries. The entire indicator is based on a very interesting mathematically grounded model which I will get into down below.
Here’s how the indicator works at a high level:
EMAs as Anchors: It starts with two Exponential Moving Averages (EMAs) — one short-term and one long-term — to track market direction.
Statistical Spread (Regression Residuals): It performs a rolling linear regression between the short and long EMA. Instead of using the raw difference (short - long), it calculates the regression residual, which better models their natural relationship.
Normalize the Spread: The spread is divided by historical price volatility (ATR) to make it scale-invariant. This ensures the indicator works on low-priced stocks, high-priced indices, and crypto alike.
Z-Score: It computes a Z-score of the normalized spread to measure how “extreme” the current deviation is from its historical average.
Dynamic Thresholds: Unlike most tools that use fixed thresholds (like Z = ±2), this one calculates dynamic thresholds using historical percentiles (e.g., top 10% and bottom 10%) so that it adapts to the asset's current behavior to reduce false signals based on market’s extreme volatility at a certain time.
Z-Score Momentum: It tracks the direction of the Z-score — if Z is extreme but still moving away from zero, it's too early. It waits for reversion to start (Z momentum flips).
Correlation Check: Uses a rolling Pearson correlation to confirm the two EMAs are still statistically related. If they diverge (low correlation), no signal is shown.
Stationarity Filter (ADF-like): Uses the volatility of the regression residual to determine if the spread is stationary (mean-reverting) — a key concept in cointegration and statistical arbitrage. It’s not possible to build an exact ADF filter in Pine Script so we used the next best thing.
Signal Control: Prevents noisy charts and overtrading by ensuring no back-to-back buy or sell signals. Each signal must alternate and respect a cooldown period so you won’t be overwhelmed and won’t get a messy chart.
Important Notes to Remember:
The whole idea behind this indicator is to try to use some stat arb models to detect shifting patterns faster than they appear on common indicators, so in some cases, some assumptions are made based on historic values.
This means that in some cases, the indicator can “jump” into the conclusion too quickly. Although we try to eliminate this by using stationary filters, correlation checks, and Z-score momentum detection, there is still a chance some signals that are generated can be too early, in the stock market, that's the same as being incorrect. So make sure to use this with other indicators to confirm the movement.
How To Use The Indicator:
You can use the indicator as a standalone reversal system, as a filter for overbought and oversold setups, in combination with other trend indicators and as a part of a signal stack with other common indicators for divergence spotting and fade trades.
The indicator produces simple buy and sell signals when all criteria is met. Based on our own testing, we recommend treating these signals as standalone and independent from each other . Meaning that if you take position after a buy signal, don’t wait for a sell signal to appear to exit the trade and vice versa.
This is why we recommend using this indicator with other advanced or even simple indicators as an early confirmation tool.
The Display Table:
The floating diagnostic table in the top-right corner of the chart is a key part of this indicator. It's a live statistical dashboard that helps you understand why a signal is (or isn’t) being triggered, and whether the market conditions are lining up for a potential reversal.
1. Z-Score
What it shows: The current Z-score value of the volatility-normalized spread between the short EMA and the regression line of the long EMA.
Why it matters: Z-score tells you how statistically extreme the current relationship is. A Z-score of:
0 = perfectly average
> +2 = very overbought
< -2 = very oversold
How to use it: Look for Z-score reaching extreme highs or lows (beyond dynamic thresholds). Watch for it to start reversing direction, especially when paired with green table rows (see below)
2. Z-Score Momentum
What it shows: The rate of change (ROC) of the Z-score:
Zmomentum=Zt − Zt − 1
Why it matters: This tells you if the Z-score is still stretching out (e.g., getting more overbought/oversold), or reverting back toward the mean.
How to use it: A positive Z-momentum after a very low Z-score = potential bullish reversal A negative Z-momentum after a very high Z-score = potential bearish reversal. Avoid signals when momentum is still pushing deeper into extremes
3. Correlation
What it shows: The rolling Pearson correlation coefficient between the short EMA and long EMA.
Why it matters: High correlation (closer to +1) means the EMAs are still statistically connected — a key requirement for cointegration or mean reversion to be valid.
How to use it: Look for correlation > 0.7 for reliable signals. If correlation drops below 0.5, ignore the Z-score — the EMAs aren’t moving together anymore
4. Stationary
What it shows: A simplified "Yes" or "No" answer to the question:
“Is the spread statistically stable (stationary) and mean-reverting right now?”
Why it matters: Mean reversion strategies only work when the spread is stationary — that is, when the distance between EMAs behaves like a rubber band, not a drifting cloud.
How to use it: A "Yes" means the indicator sees a consistent, stable spread — good for trading. "No" means the market is too volatile, disjointed, or chaotic for reliable mean reversion. Wait for this to flip to "Yes" before trusting signals
5. Last Signal
What it shows: The last signal issued by the system — either "Buy", "Sell", or "None"
Why it matters: Helps avoid confusion and repeated entries. Signals only alternate — you won’t get another Buy until a Sell happens, and vice versa.
How to use it: If the last signal was a "Buy", and you’re watching for a Sell, don’t act on more bullish signals. Great for systems where you only want one position open at a time
6. Bars Since Signal
What it shows: How many bars (candles) have passed since the last Buy or Sell signal.
Why it matters: Gives you context for how long the current condition has persisted
How to use it: If it says 1 or 2, a signal just happened — avoid jumping in late. If it’s been 10+ bars, a new opportunity might be brewing soon. You can use this to time exits if you want to fade a recent signal manually
Indicator Settings:
Short EMA: Sets the short-term EMA period. The smaller the number, the more reactive and more signals you get.
Long EMA: Sets the slow EMA period. The larger this number is, the smoother baseline, and more reliable trend bases are generated.
Z-Score Lookback: The period or bars used for mean & std deviation of spread between short and long EMAs. Larger values result in smoother signals with fewer false positives.
Volatility Window: This value normalizes the spread by historical volatility. This allows you to prevent scale distortion, showing you a cleaner and better chart.
Correlation Lookback: How many periods or how far back to test correlation between slow and long EMAs. This filters out false positives when EMAs lose alignment.
Hurst Lookback: The multiplier to approximate stationarity. Lower leads to more sensitivity to regime change, higher produces a more stricter filtering.
Z Threshold Percentile: This value sets how extreme Z-score must be to trigger a signal. For example, 90 equals only top/bottom 10% of extremes, 80 = more frequent.
Min Bars Between Signals: This hard stop prevents back-to-back signals. The idea is to avoid over-trading or whipsaws in volatile markets even when Hurst lookback and volatility window values are not enough to filter signals.
Some More Recommendations:
We recommend trying different EMA pairs (10/50, 21/100, 5/20) for different asset behaviors. You can set percentile to 85 or 80 if you want more frequent but looser signals. You can also use the Z-score reversion monitor for powerful confirmation.

Trend Trader-RemasteredThe script was originally coded in 2018 with Pine Script version 3, and it was in invite only status. It has been updated and optimised for Pine Script v5 and made completely open source.
Overview
The Trend Trader-Remastered is a refined and highly sophisticated implementation of the Parabolic SAR designed to create strategic buy and sell entry signals, alongside precision take profit and re-entry signals based on marked Bill Williams (BW) fractals. Built with a deep emphasis on clarity and accuracy, this indicator ensures that only relevant and meaningful signals are generated, eliminating any unnecessary entries or exits.
Key Features
1) Parabolic SAR-Based Entry Signals:
This indicator leverages an advanced implementation of the Parabolic SAR to create clear buy and sell position entry signals.
The Parabolic SAR detects potential trend shifts, helping traders make timely entries in trending markets.
These entries are strategically aligned to maximise trend-following opportunities and minimise whipsaw trades, providing an effective approach for trend traders.
2) Take Profit and Re-Entry Signals with BW Fractals:
The indicator goes beyond simple entry and exit signals by integrating BW Fractal-based take profit and re-entry signals.
Relevant Signal Generation: The indicator maintains strict criteria for signal relevance, ensuring that a re-entry signal is only generated if there has been a preceding take profit signal in the respective position. This prevents any misleading or premature re-entry signals.
Progressive Take Profit Signals: The script generates multiple take profit signals sequentially in alignment with prior take profit levels. For instance, in a buy position initiated at a price of 100, the first take profit might occur at 110. Any subsequent take profit signals will then occur at prices greater than 110, ensuring they are "in favour" of the original position's trajectory and previous take profits.
3) Consistent Trend-Following Structure:
This design allows the Trend Trader-Remastered to continue signaling take profit opportunities as the trend advances. The indicator only generates take profit signals in alignment with previous ones, supporting a systematic and profit-maximising strategy.
This structure helps traders maintain positions effectively, securing incremental profits as the trend progresses.
4) Customisability and Usability:
Adjustable Parameters: Users can configure key settings, including sensitivity to the Parabolic SAR and fractal identification. This allows flexibility to fine-tune the indicator according to different market conditions or trading styles.
User-Friendly Alerts: The indicator provides clear visual signals on the chart, along with optional alerts to notify traders of new buy, sell, take profit, or re-entry opportunities in real-time.

Stronger Buy/Sell Signals This custom Pine Script indicator is designed to detect strong buy and sell signals based on price action trends and momentum, with an emphasis on using two simple moving averages (SMAs) for trend identification and RSI (Relative Strength Index) impulses for additional confirmation. The script is optimized to ensure that signals are not triggered too frequently, only highlighting strong trend-based opportunities. Additionally, the script is built as an overlay to keep the chart clean and prevent any visual shrinking caused by extra indicators.
Key Features
1. Moving Averages (SMAs):
- 11-period SMA (short-term trend): This moving average is used to track short-term price movement and serves as the primary trend filter.
- 50-period SMA (medium-term trend): This moving average is used to track the medium-term price trend, providing additional confirmation for trend direction.
The price must be above both SMAs for a buy signal or below both SMAs for a sell signal, ensuring that signals are only triggered in well-defined trends.
2. RSI Momentum Confirmation:
- Although the RSI is not displayed on the chart, it plays a critical role in filtering the signals.
- The RSI is calculated using the standard 14-period formula, and an additional condition requires that the RSI must show an upward or downward momentum (impulse) for buy or sell signals, respectively.
- The RSI impulse is measured by comparing the RSI value to its 5-period moving average:
- Upward impulse for a buy signal.
- Downward impulse for a sell signal.
3. Buy Signal:
- A strong buy signal is triggered when:
- The price is above both the 11-period and 50-period SMAs (confirming a bullish trend).
- The RSI is showing upward momentum, implying growing buying pressure.
- When both of these conditions are met, a green "Strong Buy" label will appear below the price bars, indicating a strong buying opportunity.
4. Sell Signal:
- A strong sell signal is triggered when:
- The price is below both the 11-period and 50-period SMAs (confirming a bearish trend).
- The RSI is showing downward momentum, implying growing selling pressure.
- When both of these conditions are met, a red "Strong Sell" label will appear above the price bars, indicating a strong selling opportunity.
5. No RSI Display:
- While the RSI is used for internal signal filtering, it is not displayed on the chart. This decision ensures that the chart remains uncluttered, with only the important buy/sell signals and moving averages visible.
6. Overlay-Only Indicator:
- This script is designed as an overlay indicator, meaning it plots directly on the price chart without adding additional panes. This helps the chart maintain its size and avoids shrinking the view.
---
Use Case
This indicator is ideal for traders who want to:
- Focus on strong, trend-confirming signals while avoiding noise from weaker setups.
- Trade in alignment with the trend , as defined by both short-term (11-SMA) and medium-term (50-SMA) price action.
- Filter signals based on momentum without cluttering their charts with additional indicators.
Customization Options
- SMA Periods : You can adjust the periods for the 11-SMA and 50-SMA depending on your preferred timeframe and trading strategy.
- RSI Conditions : If you want to add or remove sensitivity from the buy and sell signals, you can modify the RSI impulse logic to adjust the thresholds for what qualifies as an upward or downward impulse.
---
Conclusion
The "Stronger Buy/Sell Signals" Pine Script is a powerful trend-following tool that uses a combination of moving averages and RSI momentum to generate reliable trading signals. The indicator is designed to help traders stay in strong trends, while filtering out weaker signals that don't meet strict criteria. By not displaying the RSI directly and keeping the chart focused on key signals, this script maintains a clean and functional trading setup.
This indicator is best used by traders who prefer clear visual guidance for buying and selling opportunities, especially in trending markets.
---
Feel free to adjust the parameters to suit your specific trading style! Let me know if you'd like any additional features or modifications.
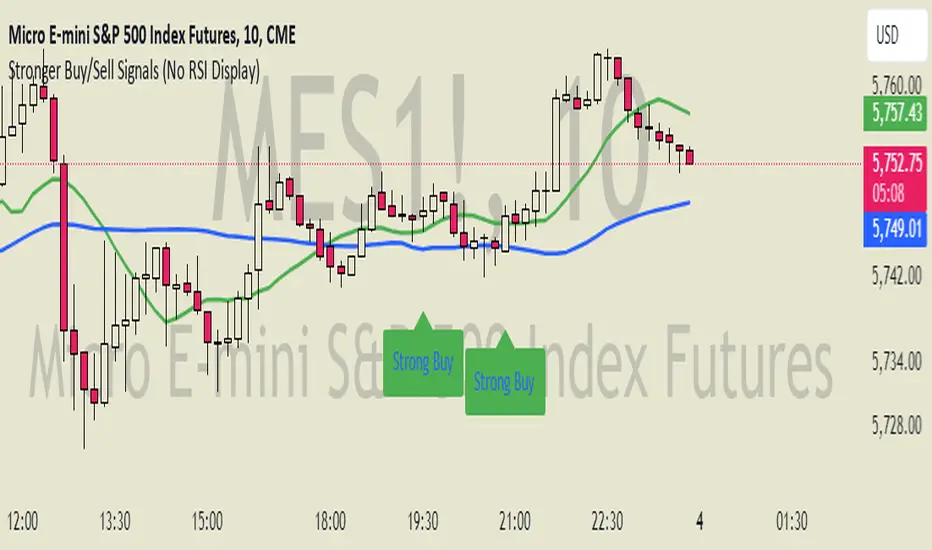
Supertrend with Extreme SignalsOriginality and Usefulness
The "Supertrend with Extreme Signals" indicator is an innovative tool I've developed to combine the strengths of the Supertrend indicator with the RSI (Relative Strength Index). This combination enhances the accuracy of entry and exit signals, making it more useful for traders looking to gain a comprehensive understanding of market conditions.
Justification for Mashup:
Supertrend: This is a trend-following indicator that identifies the current market trend and potential reversal points by adjusting dynamically based on market volatility.
RSI: A momentum oscillator that measures the speed and change of price movements. It helps pinpoint overbought and oversold conditions, adding an extra layer of confirmation to trend signals.
By merging these two indicators, the script filters out false signals and improves the precision of trade entries and exits. The Supertrend identifies the trend direction, while the RSI confirms the strength and potential reversals within that trend.
Description
Overview
The "Supertrend with Extreme Signals" indicator is a powerful hybrid tool that brings together the trend-following capability of the Supertrend and the momentum analysis of RSI. This integration provides clear buy and sell signals, helping traders make more informed decisions.
What It Does
Trend Identification: Utilizes the Supertrend to determine the prevailing market trend.
Signal Confirmation: Uses RSI to confirm signals by identifying overbought and oversold conditions.
Buy and Sell Signals: Generates buy signals when the price crosses above the Supertrend line and RSI indicates oversold conditions. Generates sell signals when the price crosses below the Supertrend line and RSI indicates overbought conditions.
How It Works
Supertrend Calculation:
Calculates the Average True Range (ATR) to assess market volatility.
Computes upper and lower levels based on the mid-price and ATR.
Determines trend direction by smoothing these levels over a specified period.
Dynamically adjusts the Supertrend value based on market conditions.
RSI Calculation:
Calculates the RSI over a defined period to measure price momentum.
Uses RSI levels to identify overbought (above 70) and oversold (below 30) conditions.
Signal Generation:
Buy Signal: Triggered when the price crosses above the Supertrend line and RSI is below the oversold threshold.
Sell Signal: Triggered when the price crosses below the Supertrend line and RSI is above the overbought threshold.
How to Use It
Trend Following: Use the Supertrend color to identify the current trend (green for uptrend, red for downtrend).
Entry Signals: Look for buy signals (green label) when the price crosses above the Supertrend line and RSI is in the oversold zone.
Exit Signals: Look for sell signals (red label) when the price crosses below the Supertrend line and RSI is in the overbought zone.
Visual Confirmation: The background color changes based on the trend direction, providing a quick visual cue for the current market state.
This script is especially useful for traders who combine trend-following strategies with momentum indicators. It helps filter out false signals and provides a robust framework for identifying profitable trading opportunities.
Concepts Underlying Calculations
ATR (Average True Range): Measures market volatility by calculating the average range of price movements over a specified period.
Supertrend: A trend-following indicator that adjusts dynamically based on market volatility.
RSI (Relative Strength Index): A momentum oscillator that measures the speed and change of price movements, helping to identify overbought and oversold conditions.
By combining these concepts, the "Supertrend with Extreme Signals" indicator offers a balanced approach to trading. It considers both trend direction and market momentum, making it a powerful tool for improving trading performance through informed market analysis.

Volatility Adaptive Signal Tracker (VAST)The Adaptive Trend Following Buy/Sell Signals Pine Script is designed to help traders identify and capitalize on market trends using an adaptive trend-following strategy. This script focuses on generating reliable buy and sell signals by analyzing market trends and volatility. It simplifies the trading process by providing clear signals without plotting additional lines, making it easy to use and interpret.
Key Features:
Adaptive Trend Following:
The script employs an adaptive trend-following approach that leverages market volatility to generate buy and sell signals. This method is effective in both trending and volatile markets.
Inputs and Customization:
The script includes customizable parameters for the Simple Moving Average (SMA) length, the Average True Range (ATR) length, and the ATR multiplier. These inputs allow traders to adjust the sensitivity of the signals to match their trading style and market conditions.
Signal Generation:
Buy Signal: Generated when the closing price crosses above the upper adaptive band, indicating a potential upward trend.
Sell Signal: Generated when the closing price crosses below the lower adaptive band, indicating a potential downward trend.
Visual Signals:
The script uses plotshape to mark buy signals with green labels below the bars and sell signals with red labels above the bars. This clear visual representation helps traders quickly identify trading opportunities.
Alert Conditions:
The script sets up alert conditions for both buy and sell signals. Traders can use these alerts to receive notifications when a signal is generated, ensuring they do not miss any trading opportunities.
How It Works:
SMA Calculation: The script calculates the Simple Moving Average (SMA) over a specified period, which helps in identifying the general trend direction.
ATR Calculation: The Average True Range (ATR) is calculated to measure market volatility.
Adaptive Bands: Upper and lower adaptive bands are created by adding and subtracting a multiple of the ATR to the SMA, respectively.
Signal Logic: Buy signals are generated when the closing price crosses above the upper band, while sell signals are generated when the closing price crosses below the lower band.
Example Use Case:
A trader looking to capitalize on medium-term trends in the Nifty futures market can use this script to receive timely buy and sell signals. By customizing the SMA length and ATR parameters, the trader can fine-tune the script to match their trading strategy, ensuring they enter and exit trades at optimal points.
Benefits:
Simplicity: The script provides clear buy and sell signals without cluttering the chart with additional lines or indicators.
Adaptability: Customizable parameters allow traders to adapt the script to various market conditions and trading styles.
Alerts: Built-in alert conditions ensure traders receive timely notifications, helping them to act quickly on trading signals.
How to Use:
Open TradingView: Go to the TradingView website and log in.
Create a New Chart: Click on the “Chart” button to open a new chart.
Open the Pine Script Editor: Click on the “Pine Editor” tab at the bottom of the chart.
Create a New Script: Delete any default code in the Pine Script editor and paste the provided script.
Add to Chart: Click on the “Add to Chart” button to compile and add the script to your chart.
Save the Script: Click “Save” and name the script.
Set Alerts: Right-click on the chart, select “Add Alert,” and choose the appropriate condition to set alerts for buy and sell signals.

Gold Option Signals with EMA and RSIIndicators:
Exponential Moving Averages (EMAs): Faster to respond to recent price changes compared to simple moving averages.
RSI: Measures the magnitude of recent price changes to evaluate overbought or oversold conditions.
Signal Generation:
Buy Call Signal: Generated when the short EMA crosses above the long EMA and the RSI is not overbought (below 70).
Buy Put Signal: Generated when the short EMA crosses below the long EMA and the RSI is not oversold (above 30).
Plotting:
EMAs: Plotted on the chart to visualize trend directions.
Signals: Plotted as shapes on the chart where conditions are met.
RSI Background Color: Changes to red for overbought and green for oversold conditions.
Steps to Use:
Add the Script to TradingView:
Open TradingView, go to the Pine Script editor, paste the script, save it, and add it to your chart.
Interpret the Signals:
Buy Call Signal: Look for green labels below the price bars.
Buy Put Signal: Look for red labels above the price bars.
Customize Parameters:
Adjust the input parameters (e.g., lengths of EMAs, RSI levels) to better fit your trading strategy and market conditions.
Testing and Validation
To ensure that the script works as expected, you can test it on historical data and validate the signals against known price movements. Adjust the parameters if necessary to improve the accuracy of the signals.

Confirmed Pivots + MACD Signals (with BOS Lines)Confirmed Pivots + MACD Signals
This indicator combines confirmed swing highs/lows (pivots) with MACD-based momentum signals to highlight key reversal and continuation points on the chart.
Core Logic
Confirmed Pivots:
The script identifies swing highs and lows using the user-defined pivot confirmation length.
Once a structure is broken beyond the last pivot, that level becomes a confirmed support (CL) or resistance (CH) line.
These levels are plotted as dashed horizontal rays and labeled directly on the chart.
MACD Integration:
The classic MACD crossover/under logic is used:
Bullish Crossover: MACD line crosses above the Signal line.
Bearish Crossunder: MACD line crosses below the Signal line.
Signal Filtering by Proximity:
A Proximity Zone (%) defines how close price must be to an active support or resistance to trigger a signal.
Buy Signal: When price is within the support zone and a bullish MACD crossover occurs.
Sell Signal: When price is within the resistance zone and a bearish MACD crossunder occurs.
Inputs
Pivot Confirmation Length: Bars used to confirm swing points.
MACD Fast/Slow/Signal Lengths: Standard MACD settings.
Proximity Zone (%): Defines zone width (e.g., 1% around active level).
Output
Labels: "CH" (Confirmed High) and "CL" (Confirmed Low) with color-coded dashed lines.
Signals: "BUY" and "SELL" markers appear when both pivot and MACD conditions align.
Tips
Works best on higher timeframes (H1 and above).
Combine with price action or trend filters for confirmation.
Use proximity percentage according to volatility (e.g., smaller % for low-vol assets).
⚠️ Disclaimer:
This script is provided for educational and informational purposes only.
It does not constitute financial or investment advice, and the author is not responsible for any financial losses that may occur from its use.
Always perform your own analysis and use this indicator together with other technical and risk management tools before making trading decisions.
---------------------------------------------------------------------------------------------
سقف و کف تاییدشده + سیگنالهای MACD
این اندیکاتور ترکیبی از شناسایی سقفها و کفهای تاییدشده (Pivot High/Low) به همراه سیگنالهای مومنتوم MACD است که نقاط برگشت یا ادامهی روند را روی چارت مشخص میکند.
🔹 منطق عملکرد
تایید سقف و کفها:
ابتدا سقف و کفهای محلی بر اساس تعداد کندلهای تنظیمشده شناسایی میشوند.
وقتی ساختار قیمتی از آخرین سقف یا کف عبور کند، آن سطح به عنوان حمایت یا مقاومت تاییدشده در نظر گرفته شده و با برچسبهای “CL” (کف تاییدشده) و “CH” (سقف تاییدشده) و خطوط نقطهچین رسم میشود.
ادغام با MACD:
از منطق کلاسیک کراساور/کراسآندر MACD استفاده شده است:
کراس صعودی: عبور خط MACD از بالای خط سیگنال.
کراس نزولی: عبور خط MACD از زیر خط سیگنال.
فیلتر سیگنال با ناحیه مجاور:
با استفاده از درصد ناحیه مجاور (Proximity Zone %)، فقط زمانی سیگنال صادر میشود که قیمت نزدیک حمایت یا مقاومت فعال باشد.
سیگنال خرید: وقتی قیمت در ناحیهی حمایت و همزمان MACD صعودی شود.
سیگنال فروش: وقتی قیمت در ناحیهی مقاومت و همزمان MACD نزولی شود.
تنظیمات ورودی
طول تأیید پیوتها
تنظیمات MACD (Fast, Slow, Signal)
درصد ناحیه مجاور برای فعال شدن سیگنالها
خروجیها
برچسبهای “CL” و “CH” برای سطوح تاییدشده
نشانگرهای “BUY” و “SELL” در محل صدور سیگنال
نکات کاربردی
بهترین عملکرد در تایمفریمهای بالاتر (۱ ساعته به بالا)
برای دقت بیشتر، آن را با فیلتر روند یا پرایساکشن ترکیب کنید
درصد ناحیه مجاور را با توجه به نوسانات دارایی تنظیم کنید
