R Dominant Range [CRT] by Sergi SernaR Dominant Range identifies the most influential R range located to the left of the current price action. It highlights the dominant zone that still impacts market behavior, helping traders understand which range is controlling the current structure.
Tìm kiếm tập lệnh với "smart"

Custom Horizontal Lines | Trade Symmetry📊 Custom Horizontal Lines
🔍 Overview
The Custom Horizontal Lines is a precision utility designed for traders who perform manual higher-timeframe analysis and want to preserve their marked price levels directly on the chart.
It doesn’t calculate or detect anything automatically — instead, it acts as your personal level memory, preserving your analyzed zones and reference prices throughout the session.
Ideal for traders who manually mark the High, Low, Open, Close, Mean Thresholds, and Quarter Levels of Order Blocks, Fair Value Gaps, Inversion Fair Value Gaps and Wicks before the trading day begins.
⚙️ Key Features
✅ Manual Level Entry — Input your analyzed price levels (OB, FVG, WICK,etc) directly into the indicator settings.
✅ Preserved Levels — Once entered, your lines stay visible and consistent — even after switching symbols, timeframes, or reloading the chart.
✅ Supports All Level Types — Store any kind of manually defined level: OB highs/lows, FVG boundaries, Wicks, Mean Thresholds, Quarter levels, or custom reference prices.
✅ Clean Visualization — Customize line color, style, and labels for easy visual organization.
✅ Session-Ready Workflow — Built for pre-market preparation — enter your HTF levels once, and trade around them all day.
✅ No Auto Calculations — 100% manual by design — ensuring only your analyzed levels are shown, exactly as you defined them.
💡 How to Use
Open the indicator’s settings and manually enter those price values.
The indicator will plot and preserve those exact levels on your chart.
Switch to your lower timeframe and observe how price reacts around them — without ever needing to redraw.
🎯 Why It’s Useful
Keeps your HTF levels organized and persistent across sessions.
Saves time by avoiding redrawing.
Fits perfectly into ICT / Smart Money trading workflows.
Ensures full manual control and precision over what’s displayed on your chart.
🧩 Ideal For
ICT and Smart Money traders
Institutional-style manual analysts
Traders marking Mean Thresholds, or Quarter Levels of OBs, FVGs, Wicks etc
Anyone who wants a clean, reliable way to preserve their manual analysis

Opening Range Breakout with Multi-Timeframe Liquidity]═══════════════════════════════════════
OPENING RANGE BREAKOUT WITH MULTI-TIMEFRAME LIQUIDITY
═══════════════════════════════════════
A professional Opening Range Breakout (ORB) indicator enhanced with multi-timeframe liquidity detection, trading session visualization, volume analysis, and trend confirmation tools. Designed for intraday trading with comprehensive alert system.
───────────────────────────────────────
WHAT THIS INDICATOR DOES
───────────────────────────────────────
This indicator combines multiple trading concepts:
- Opening Range Breakout (ORB) - Customizable time period detection with automatic high/low identification
- Multi-Timeframe Liquidity - HTF (Higher Timeframe) and LTF (Lower Timeframe) key level detection
- Trading Sessions - Tokyo, London, New York, and Sydney session visualization
- Volume Analysis - Volume spike detection and strength measurement
- Multi-Timeframe Confirmation - Trend bias from higher timeframes
- EMA Integration - Trend filter and dynamic support/resistance
- Smart Alerts - Quality-filtered breakout notifications
───────────────────────────────────────
HOW IT WORKS
───────────────────────────────────────
OPENING RANGE BREAKOUT (ORB):
Concept:
The Opening Range is a period at the start of a trading session where price establishes an initial high and low. Breakouts beyond this range often indicate the direction of the day's trend.
Detection Method:
- Default: 15-minute opening range (configurable)
- Custom Range: Set specific session times with timezone support
- Automatically identifies ORH (Opening Range High) and ORL (Opening Range Low)
- Tracks ORB mid-point for reference
Range Establishment:
1. Session starts (or custom time begins)
2. Tracks highest high and lowest low during the period
3. Range confirmed at end of opening period
4. Levels extend throughout the session
Breakout Detection:
- Bullish Breakout: Close above ORH
- Bearish Breakout: Close below ORL
- Mid-point acts as bias indicator
Visual Display:
- Shaded box during range formation
- Horizontal lines for ORH, ORL, and mid-point
- Labels showing level values
- Color-coded fills based on selected method
Fill Color Methods:
1. Session Comparison:
- Green: Current OR mid > Previous OR mid
- Red: Current OR mid < Previous OR mid
- Gray: Equal or first session
- Shows day-over-day momentum
2. Breakout Direction (Recommended):
- Green: Price currently above ORH (bullish breakout)
- Red: Price currently below ORL (bearish breakout)
- Gray: Price inside range (no breakout)
- Real-time breakout status
MULTI-TIMEFRAME LIQUIDITY:
Two-Tier System for comprehensive level identification:
HTF (Higher Timeframe) Key Liquidity:
- Default: 4H timeframe (configurable to Daily, Weekly)
- Identifies major institutional levels
- Uses pivot detection with adjustable parameters
- Suitable for swing highs/lows where large orders rest
LTF (Lower Timeframe) Key Liquidity:
- Default: 1H timeframe (configurable)
- Provides precision entry/exit levels
- Finer granularity for intraday trading
- Captures minor swing points
Calculation Method:
- Pivot high/low detection algorithm
- Configurable left bars (lookback) and right bars (confirmation)
- Timeframe multiplier for accurate multi-timeframe detection
- Automatic level extension
Mitigation System:
- Tracks when levels are swept (broken)
- Configurable mitigation type: Wick or Close-based
- Option to remove or show mitigated levels
- Display limit prevents chart clutter
Asset-Specific Optimization:
The indicator includes quick reference settings for different assets:
- Major Forex (EUR/USD, GBP/USD): Default settings optimal
- Crypto (BTC/ETH): Left=12, Right=4, Display=7
- Gold: HTF=1D, Left=20
TRADING SESSIONS:
Four Major Sessions with Full Customization:
Tokyo Session:
- Default: 04:00-13:00 UTC+4
- Asian trading hours
- Often sets daily range
London Session:
- Default: 11:00-20:00 UTC+4
- Highest liquidity period
- Major institutional activity
New York Session:
- Default: 16:00-01:00 UTC+4
- US market hours
- High-impact news events
Sydney Session:
- Default: 01:00-10:00 UTC+4
- Earliest Asian activity
- Lower volatility
Session Features:
- Shaded background boxes
- Session name labels
- Optional open/close lines
- Session high/low tracking with colored lines
- Each session has independent color settings
- Fully customizable times and timezones
VOLUME ANALYSIS:
Volume-Based Trade Confirmation:
Volume MA:
- Configurable period (default: 20)
- Establishes average volume baseline
- Used for spike detection
Volume Spike Detection:
- Identifies when volume exceeds MA * multiplier
- Default: 1.5x average volume
- Confirms breakout strength
Volume Strength Measurement:
- Calculates current volume as percentage of average
- Shows relative volume intensity
- Used in alert quality filtering
High Volume Bars:
- Identifies bars above 50th percentile
- Additional confirmation layer
- Indicates institutional participation
MULTI-TIMEFRAME CONFIRMATION:
Trend Bias from Higher Timeframes:
HTF 1 (Trend):
- Default: 1H timeframe
- Uses EMA to determine intermediate trend
- Compares current timeframe EMA to HTF EMA
HTF 2 (Bias):
- Default: 4H timeframe
- Uses 50 EMA for longer-term bias
- Confirms overall market direction
Bias Classifications:
- Bullish Bias: HTF close > HTF 50 EMA AND Current EMA > HTF1 EMA
- Bearish Bias: HTF close < HTF 50 EMA AND Current EMA < HTF1 EMA
- Neutral Bias: Mixed signals between timeframes
EMA Stack Analysis:
- Compares EMA alignment across timeframes
- +1: Bullish stack (lower TF EMA > higher TF EMA)
- -1: Bearish stack (lower TF EMA < higher TF EMA)
- 0: Neutral/crossed
Usage:
- Filters false breakouts
- Confirms trend direction
- Improves trade quality
EMA INTEGRATION:
Dynamic EMA for Trend Reference:
Features:
- Configurable period (default: 20)
- Customizable color and width
- Acts as dynamic support/resistance
- Trend filter for ORB trades
Application:
- Above EMA: Favor long breakouts
- Below EMA: Favor short breakouts
- EMA cross: Potential trend change
- Distance from EMA: Momentum gauge
SMART ALERT SYSTEM:
Quality-Filtered Breakout Notifications:
Alert Types:
1. Standard ORB Breakout
2. High Quality ORB Breakout
Quality Criteria:
- Volume Confirmation: Volume > 1.2x average
- MTF Confirmation: Bias aligned with breakout direction
Standard Alert:
- Basic breakout detection
- Price crosses ORH or ORL
- Icon: 🚀 (bullish) or 🔻 (bearish)
High Quality Alert:
- Both volume AND MTF confirmed
- Stronger probability setup
- Icon: 🚀⭐ (bullish) or 🔻⭐ (bearish)
Alert Information Includes:
- Alert quality rating
- Breakout level and current price
- Volume strength percentage (if enabled)
- MTF bias status (if enabled)
- Recommended action
One Alert Per Bar:
- Prevents alert spam
- Uses flag system to track sent alerts
- Resets on new ORB session
───────────────────────────────────────
HOW TO USE
───────────────────────────────────────
OPENING RANGE SETUP:
Basic Configuration:
1. Select time period for opening range (default: 15 minutes)
2. Choose fill color method (Breakout Direction recommended)
3. Enable historical data display if needed
Custom Range (Advanced):
1. Enable Custom Range toggle
2. Set specific session time (e.g., 0930-0945)
3. Select appropriate timezone
4. Useful for specific market opens (NYSE, LSE, etc.)
LIQUIDITY LEVELS SETUP:
Quick Configuration by Asset:
- Forex: Use default settings (Left=15, Right=5)
- Crypto: Set Left=12, Right=4, Display=7
- Gold: Set HTF=1D, Left=20
HTF Liquidity:
- Purpose: Major support/resistance levels
- Recommended: 4H for day trading, 1D for swing trading
- Use as profit targets or reversal zones
LTF Liquidity:
- Purpose: Entry/exit refinement
- Recommended: 1H for day trading, 4H for swing trading
- Use for position management
Mitigation Settings:
- Wick-based: More sensitive (default)
- Close-based: More conservative
- Remove or Show mitigated levels based on preference
TRADING SESSIONS SETUP:
Enable/Disable Sessions:
- Master toggle for all sessions
- Individual session controls
- Show/hide session names
Session High/Low Lines:
- Enable to see session extremes
- Each session has custom colors
- Useful for range trading
Customization:
- Adjust session times for your broker
- Set timezone to match your location
- Customize colors for visibility
VOLUME ANALYSIS SETUP:
Enable Volume Analysis:
1. Toggle on Volume Analysis
2. Set MA length (20 recommended)
3. Adjust spike multiplier (1.5 typical)
Usage:
- Confirm breakouts with volume
- Identify climactic moves
- Filter false signals
MULTI-TIMEFRAME SETUP:
HTF Selection:
- HTF 1 (Trend): 1H for day trading, 4H for swing
- HTF 2 (Bias): 4H for day trading, 1D for swing
Interpretation:
- Trade only with bias alignment
- Neutral bias: Be cautious
- Bias changes: Potential reversals
EMA SETUP:
Configuration:
- Period: 20 for responsive, 50 for smoother
- Color: Choose contrasting color
- Width: 1-2 for visibility
Usage:
- Filter trades: Long above, Short below
- Dynamic support/resistance reference
- Trend confirmation
ALERT SETUP:
TradingView Alert Creation:
1. Enable alerts in indicator settings
2. Enable ORB Breakout Alerts
3. Right-click chart → Add Alert
4. Select this indicator
5. Choose "Any alert() function call"
6. Configure delivery method (mobile, email, webhook)
Alert Filtering:
- All alerts include quality rating
- High Quality alerts = Volume + MTF confirmed
- Standard alerts = Basic breakout only
───────────────────────────────────────
TRADING STRATEGIES
───────────────────────────────────────
CLASSIC ORB STRATEGY:
Setup:
1. Wait for opening range to complete
2. Price breaks and closes above ORH or below ORL
3. Volume > average (if enabled)
4. MTF bias aligned (if enabled)
Entry:
- Bullish: Buy on break above ORH
- Bearish: Sell on break below ORL
- Consider retest entries for better risk/reward
Stop Loss:
- Bullish: Below ORL or range mid-point
- Bearish: Above ORH or range mid-point
- Adjust based on volatility
Targets:
- Initial: Range width extension (ORH + range width)
- Secondary: HTF liquidity levels
- Final: Session high/low or major support/resistance
ORB + LIQUIDITY CONFLUENCE:
Enhanced Setup:
1. Opening range established
2. HTF liquidity level near or beyond ORH/ORL
3. Breakout occurs with volume
4. Price targets the liquidity level
Entry:
- Enter on ORB breakout
- Target the HTF liquidity level
- Use LTF liquidity for position management
Management:
- Partial profits at ORB + range width
- Move stop to breakeven at LTF liquidity
- Final exit at HTF liquidity sweep
ORB REJECTION STRATEGY (Counter-Trend):
Setup:
1. Price breaks above ORH or below ORL
2. Weak volume (below average)
3. MTF bias opposite to breakout
4. Price closes back inside range
Entry:
- Failed bullish break: Short below ORH
- Failed bearish break: Long above ORL
Stop Loss:
- Beyond the failed breakout level
- Or beyond session extreme
Target:
- Opposite end of opening range
- Range mid-point for partial profit
SESSION-BASED ORB TRADING:
Tokyo Session:
- Typically narrower ranges
- Good for range trading
- Wait for London open breakout
London Session:
- Highest volume and volatility
- Strong ORB setups
- Major liquidity sweeps common
New York Session:
- Strong trending moves
- News-driven volatility
- Good for momentum trades
Sydney Session:
- Quieter conditions
- Suitable for range strategies
- Sets up Tokyo session
EMA-FILTERED ORB:
Rules:
- Only take bullish breaks if price > EMA
- Only take bearish breaks if price < EMA
- Ignore counter-trend breaks
Benefits:
- Reduces false signals
- Aligns with larger trend
- Improves win rate
───────────────────────────────────────
CONFIGURATION GUIDE
───────────────────────────────────────
OPENING RANGE SETTINGS:
Time Period:
- 15 min: Standard for most markets
- 30 min: Wider range, fewer breakouts
- 60 min: For slower markets or swing trades
Custom Range:
- Use for specific market opens
- NYSE: 0930-1000 EST
- LSE: 0800-0830 GMT
- Set timezone to match exchange
Historical Display:
- Enable: See all previous session data
- Disable: Cleaner chart, current session only
LIQUIDITY SETTINGS:
Left Bars (5-30):
- Lower: More frequent, sensitive levels
- Higher: Fewer, more significant levels
- Recommended: 15 for most markets
Right Bars (1-25):
- Confirmation period
- Higher: More reliable, less frequent
- Recommended: 5 for balance
Display Limit (1-20):
- Number of active levels shown
- Higher: More context, busier chart
- Recommended: 7 for clarity
Extension Options:
- Short: Levels visible near formation
- Current: Extended to current bar (recommended)
- Max: Extended indefinitely
VOLUME SETTINGS:
MA Length (5-50):
- Shorter: More responsive to spikes
- Longer: Smoother baseline
- Recommended: 20 for balance
Spike Multiplier (1.0-3.0):
- Lower: More sensitive spike detection
- Higher: Only extreme spikes
- Recommended: 1.5 for day trading
MULTI-TIMEFRAME SETTINGS:
HTF 1 (Trend):
- 5m chart: Use 15m or 1H
- 15m chart: Use 1H or 4H
- 1H chart: Use 4H or 1D
HTF 2 (Bias):
- One level higher than HTF 1
- Provides longer-term context
- Don't use same as HTF 1
EMA SETTINGS:
Length:
- 20: Responsive, more signals
- 50: Smoother, stronger filter
- 200: Long-term trend only
Style:
- Choose contrasting color
- Width 1-2 for visibility
- Match your trading style
───────────────────────────────────────
BEST PRACTICES
───────────────────────────────────────
Chart Timeframe Selection:
- ORB Trading: Use 5m or 15m charts
- Session Review: Use 1H or 4H charts
- Swing Trading: Use 1H or 4H charts
Quality Over Quantity:
- Wait for high-quality alerts (volume + MTF)
- Avoid trading every breakout
- Focus on confluence setups
Risk Management:
- Position size based on range width
- Wider ranges = smaller positions
- Use stop losses always
- Take partial profits at targets
Market Conditions:
- Best results in trending markets
- Reduce position size in choppy conditions
- Consider session overlaps for volatility
- Avoid trading near major news if inexperienced
Continuous Improvement:
- Track win rate by session
- Note which confluence factors work best
- Adjust settings based on market volatility
- Review performance weekly
───────────────────────────────────────
PERFORMANCE OPTIMIZATION
───────────────────────────────────────
This indicator is optimized with:
- max_bars_back declarations for efficient processing
- Conditional calculations based on enabled features
- Proper memory management for drawing objects
- Minimal recalculation on each bar
Best Practices:
- Disable unused features (sessions, MTF, volume)
- Limit historical display to reduce rendering
- Use appropriate timeframe for your strategy
- Clear old drawing objects periodically
───────────────────────────────────────
EDUCATIONAL DISCLAIMER
───────────────────────────────────────
This indicator combines established trading concepts:
- Opening Range Breakout theory (price action)
- Liquidity level detection (pivot analysis)
- Session-based trading (time-of-day patterns)
- Volume analysis (confirmation technique)
- Multi-timeframe analysis (trend alignment)
All calculations use standard technical analysis methods:
- Pivot high/low detection algorithms
- Moving averages for trend and volume
- Session time filtering
- Timeframe security functions
The indicator identifies potential trading setups but does not predict future price movements. Success requires proper application within a complete trading strategy including risk management, position sizing, and market context.
───────────────────────────────────────
USAGE DISCLAIMER
───────────────────────────────────────
This tool is for educational and analytical purposes. Opening Range Breakout trading involves substantial risk. The alert system and quality filters are designed to identify potential setups but do not guarantee profitability. Always conduct independent analysis, use proper risk management, and never risk capital you cannot afford to lose. Past performance does not indicate future results. Trading intraday breakouts requires experience and discipline.
───────────────────────────────────────
CREDITS & ATTRIBUTION
───────────────────────────────────────
ORIGINAL SOURCE:
This indicator builds upon concepts from LuxAlgo's-ORB

Retail vs Banker Net Positions – Symmetry BreakRetail vs Banker Net Positions – Symmetry Break (Institution Focus)
Description:
This advanced indicator is a volume-proxy-based positioning tool that separates institutional vs. retail behavior using bar structure, trend-following logic, and statistical analysis. It identifies net position flows over time, detects institutional aggression spikes, and highlights symmetry breaks—those moments when institutional action diverges sharply from retail behavior. Designed for intraday to swing traders, this is a powerful tool for gauging smart money activity and retail exhaustion.
What It Does:
Separates Volume into Two Groups:
Institutional Proxy: Volume on large bars in trend direction
Retail Proxy: Volume on small or counter-trend bars
Calculates Net Positions (%):
Smooths cumulative buying vs. selling behavior for each group over time.
Highlights Symmetry Breaks:
Alerts when institutions make statistically abnormal moves while retail is quiet or doing the opposite.
Detects Extremes in Institutional Activity:
Flags major tops/bottoms in institutional positioning using swing pivots or rolling windows.
Retail Sentiment Flips:
Marks when the retail line crosses the zero line (e.g., flipping from net short to net long).
How to Use It:
Interpreting the Two Lines:
Aqua/Orange Line (Institutional Proxy):
Rising above zero = Net buying bias
Falling below zero = Net selling bias
Lime/Red Line (Retail Proxy):
Green = Retail buying; Red = Retail selling
Watch for crosses of zero for sentiment shifts
Spotting Symmetry Breaks:
Pink Circle or Background Highlight =
Institutions made a sharp, outsized move while retail was:
Quiet (low ROC), or
Moving in the opposite direction
These often precede explosive directional moves or stop hunts.
Institutional Extremes:
Marked with aqua (top) or orange (bottom) dots
Based on swing pivot logic or rolling highs/lows in institutional positioning
Optional filter: Only show extremes that coincide with a symmetry break
Settings You Can Tune:
Lookback lengths for trend, z-scores, smoothing
Z-Score thresholds to control sensitivity
Retail quiet filters to reduce false positives
Cool-down timer to avoid rapid repeat signals
Toggle visual aids like shading, markers, and threshold lines
Alerts Included:
-Retail flips (green/red)
- Institutional symmetry breaks
- Institutional extreme tops/bottoms
Strategy Tip:
Use this indicator to track institutional accumulation or distribution phases and catch asymmetric inflection points where the "smart money" acts decisively. Confluence with price structure or FVGs (Fair Value Gaps) can further enhance signal quality.

Strat 3-Bar (Outside Bar) AlertThis indicator automatically detects and alerts you when a Strat 3-Bar (Outside Bar) forms on any chart or timeframe.
An Outside Bar (3) occurs when both sides of the previous candle’s range are taken out — the high breaks above the prior bar’s high AND the low breaks below its low. It signals expansion in price discovery and potential reversals or continuations.
📈 How to Use:
1. Add this script to your chart.
2. Look for red “3” labels or triangles above outside bars.
3. To get alerts, click the TradingView alert icon (⏰):
• Condition → Strat 3-Bar (Outside Bar) Alert
• Option → “Outside Bar (3) Detected”
• Choose “Once per bar close.”
💡 Pro Tips:
- Use with Strat Assist for visual context.
- Combine with timeframe continuity for directional bias.
- Great on 15-min, 1H, and Daily charts.
---
👩🏽💻 Shared with love by Yolanda
Inspired by community discussions with Jalen (ChatGPT)
Let’s keep building each other up and mastering The Strat together! 💛
TheStrat, outsidebar, 3bar, priceaction, tradingstrategy, alert, reversal, continuation, stratassist, strat, technicalanalysis, pinev6, smartmoney

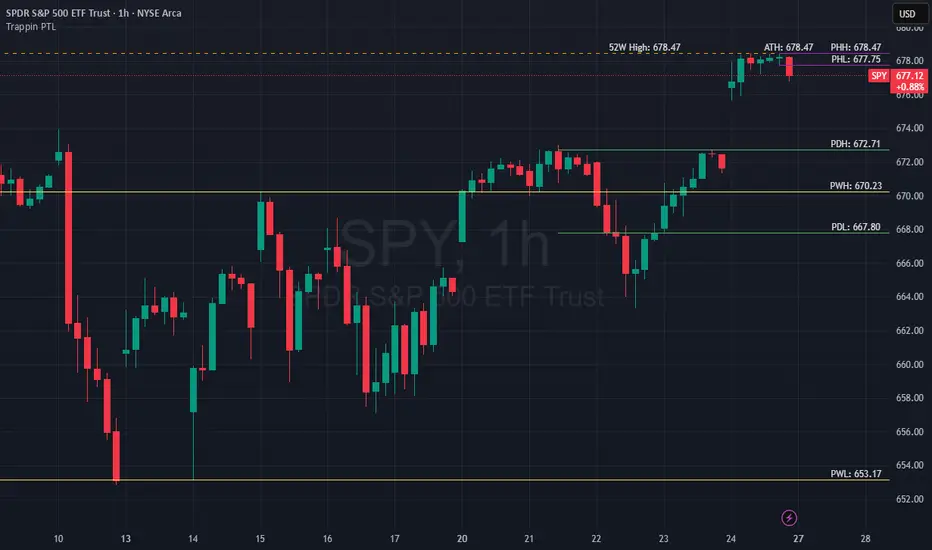
Trappin Previous Timeframe LevelsTrappin Previous Timeframe Levels (Trappin PTL)
Overview
Trappin PTL is a comprehensive multi-timeframe support and resistance indicator that displays key price levels from multiple timeframes on a single chart. This indicator helps traders identify critical price zones where reversals or breakouts are likely to occur, making it ideal for both intraday and swing trading strategies.
💡 Origin Story
I got tired of manually drawing these lines that I learned from watching Wallstreet Trapper on Trappin Tuesdays YouTube live streams. After repeatedly marking the same previous timeframe levels on every chart, I decided to automate the process. Hope it helps you as much as it helps me!
Key Features
📊 Multiple Timeframe Levels
The indicator tracks and displays high/low levels from:
Previous Hour (PHH/PHL) - Purple lines
Previous Day (PDH/PDL) - Green lines
Previous Week (PWH/PWL) - Yellow lines
Previous Month (PMH/PML) - Blue lines
All-Time High (ATH) - Red line
52-Week High - Orange line
🎨 Fully Customizable
Colors - Change the color of each timeframe independently
Line Styles - Choose between Solid, Dashed, or Dotted lines
Line Widths - Adjust thickness from 1-4 pixels
All settings organized in intuitive groups for easy access
📍 Smart Line Extension
Lines extend back to show when the level was established
Lines project forward to show current relevance
Historical context helps identify key support/resistance zones
🏷️ Clear Price Labels
Each level displays its exact price value (no currency symbols)
Labels positioned horizontally to avoid overlap
Adaptive text color for visibility on any chart theme (dark or light mode)
Why "Trappin"?
The name is a tribute to Wallstreet Trapper and his Trappin Tuesdays YouTube live streams, where I learned the importance of marking previous timeframe levels. The name also reflects the indicator's purpose: identifying price levels where traders often get "trapped" - whether it's bulls getting trapped below resistance or bears getting trapped above support. These levels represent zones where significant order flow and liquidity exist, making them prime areas for reversals or breakouts.
Credits
Created by resoh
Inspired by Wallstreet Trapper and Trappin Tuesdays YouTube live streams
This indicator is provided for educational and informational purposes. Always practice proper risk management and conduct your own analysis before making trading decisions.
Version History
v1.0 - Initial Release
Multi-timeframe high/low levels
All-time high tracking
52-week high tracking
Fully customizable colors, styles, and widths
Adaptive labels with price display
Smart line extension showing historical context
Equinox Wolf - ICT MacrosEquinox Wolf – ICT Macros plots the key ICT session macro windows on your chart so you can focus on how price behaves inside each time range. The script anchors every session to America/New_York time, updates live or in backtesting, and only keeps the current trading day on screen, avoiding clutter from prior sessions. Each window can be toggled individually, the box fill, borders, and high/low/equilibrium levels share global color and style controls, and the levels extend forward until the next macro begins. Use it to highlight the ICT LND, NYAM, lunch, afternoon, and final-hour ranges and monitor how price reacts around their highs, lows, and midpoints.

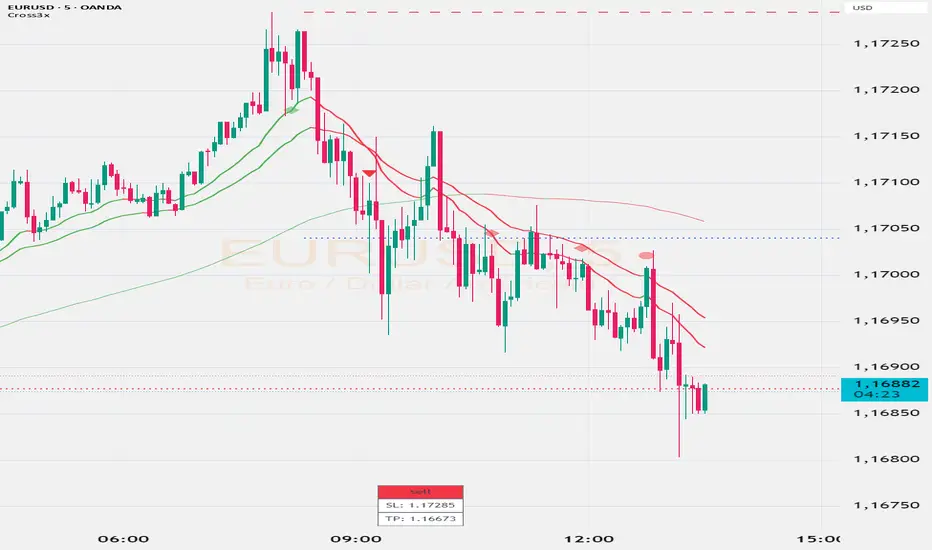
Cross3x v2Cross3x – Smart Trend & Rejection Detection System
Cross3x is a precision trading indicator designed for traders who combine trend-following with early reversal detection. Built on a triple moving average core, it delivers high-quality signals with minimal noise and maximum clarity.
Core Features:
Trend Filtered Crossover: Uses a fast EMA (18), slow EMA (33), and long-term SMA (99) to generate reliable entry signals only in the direction of the dominant trend.
Dynamic SL/TP/BE Management:
Stop Loss placed at the lowest/highest extreme over a user-defined lookback.
Take Profit calculated using a customizable Risk/Reward ratio.
Break-Even level set as a percentage between entry and TP (e.g., 10% = BE just above entry).
Early Rejection Signals: Flags potential reversals when price tests a moving average with a long wick during a countertrend candle — ideal for spotting pullbacks before the next leg.
Green flag: "Potential Long Setup" after a bullish rejection.
Red flag: "Potential Short Setup" after a bearish rejection.
Confirmation Points: Circles appear when price retraces cleanly after a crossover, signaling optimal entry zones.
Interactive Dashboard: Real-time table showing current signal, SL, and TP levels.
Customizable Alerts: Fully configurable alerts for entries, confirmation points, and rejection setups.
Why Use Cross3x?
It doesn’t just follow trends — it anticipates them. By combining classical crossovers with smart rejection logic and structured risk management, Cross3x helps you enter earlier, manage risk better, and stay aligned with market momentum.
Perfect for swing traders, intraday scalpers, and algorithmic strategies seeking a clean, robust foundation.
Usage Tips:
Combine "Potential" flags with order blocks or key levels for higher accuracy.
Use confirmation circles as entry triggers after early setups.
Adjust RR and BE% based on volatility and trading style.
Deploy Cross3x to turn simple crossovers into a complete trading methodology.
Swing Points & Liquidity — ENHANCED PRO (Dark/Light Mode)This indicator — “Swing Points & Liquidity — ENHANCED PRO (Dark/Light Mode)” — automatically detects and visualizes swing highs, swing lows, and liquidity levels on the chart with rich analytics and customizable visuals.
🔍 Core Features
Smart Swing Detection: Identifies pivot highs/lows based on adjustable left/right bar settings.
Liquidity Visualization: Draws dynamic boxes and lines for liquidity pools and swing zones.
Volume & OI Integration: Filters and colors levels using volume and Open Interest Δ (change).
Strength Meter: Highlights strong liquidity levels with color gradients based on OI + volume intensity.
Automatic Trendlines: Connects swing points with selectable style and width.
Fibonacci Mapping: Automatically projects fib retracements (23.6%, 38.2%, 50%, 61.8%, 78.6%) from swing-to-swing for confluence zones.
Statistics Panel: Displays live metrics — total levels, active/filled count, success rate, and average strength.
Alerts System: Alerts for new swing formations and when price touches or breaks a level.
Multi-Timeframe Option: Analyze swing structures from higher timeframes on any chart.
Dual Theme Mode: Fully optimized for both Dark and Light interface preferences.
⚙️ Advanced Options
Adjustable lookback range
Hide or extend filled levels
Configurable volume and OI thresholds
Supports multiple OI data sources (Binance, BitMEX, Kraken)
Fully dynamic text, color, and label alignment settings
💡 Use Case
Perfect for Smart Money Concept (SMC) and ICT-style analysis, liquidity sweeps, and swing-based trading.
Traders can quickly visualize where liquidity sits, track how it gets filled, and monitor structure shifts in real time.

US30 Quarter Levels (125-point grid) by FxMogul🟦 US30 Quarter Levels — Trade the Index Like the Banks
Discover the Dow’s hidden rhythm.
This indicator reveals the institutional quarter levels that govern US30 — spaced every 125 points, e.g. 45125, 45250, 45375, 45500, 45625, 45750, 45875, 46000, and so on.
These are the liquidity magnets and reaction zones where smart money executes — now visualized directly on your chart.
💼 Why You Need It
See institutional precision: The Dow respects 125-point cycles — this tool exposes them.
Catch reversals before retail sees them: Every impulse and retracement begins at one of these zones.
Build confluence instantly: Perfectly aligns with your FVGs, OBs, and session highs/lows.
Trade like a professional: Turn chaos into structure, and randomness into rhythm.
⚙️ Key Features
Automatically plots US30 quarter levels (…125 / …250 / …375 / …500 / …625 / …750 / …875 / …000).
Color-coded hierarchy:
🟨 xx000 / xx500 → major institutional levels
⚪ xx250 / xx750 → medium-impact levels
⚫ xx125 / xx375 / xx625 / xx875 → intraday liquidity pockets
Customizable window size, label spacing, and line extensions.
Works across all timeframes — from 1-minute scalps to 4-hour macro swings.
Optimized for clean visualization with no clutter.
🎯 How to Use It
Identify liquidity sweeps: Smart money hunts stops at these quarter zones.
Align structure: Combine with session opens, order blocks, or FVGs.
Set precision entries & exits: Trade reaction-to-reaction with tight risk.
Plan daily bias: Watch how New York respects these 125-point increments.
🧭 Designed For
Scalpers, day traders, and swing traders who understand that US30 doesn’t move randomly — it moves rhythmically.
Perfect for traders using ICT, SMC, or liquidity-based frameworks.
⚡ Creator’s Note
“Every 125 points, the Dow breathes. Every 1000, it shifts direction.
Once you see the rhythm, you’ll never unsee it.”
— FxMogul

Friday & Monday HighlighterFriday & Monday Institutional Range Marker — Know Where Big Firms Set the Trap!
🧠 Description
This indicator automatically highlights Friday and Monday sessions on your chart — days when institutional players and algorithmic firms (like Citadel, Jane Street, or Tower Research) quietly shape the upcoming week’s price structure.
🔍 Why Friday & Monday matter
Friday : Large institutions often book profits or hedge into the weekend. Their final-hour moves reveal the next week’s bias.
Monday : Big players rebuild positions, absorbing liquidity left behind by retail traders.
Together, these two days define the range traps and breakout zones that often control price action until midweek.
> In short, the Friday–Monday high and low often act as invisible walls — guiding scalpers, option sellers, and swing traders alike.
🧩 What this tool does
✅ Highlights Friday (red) and Monday (green) sessions
✅ Adds optional day labels above bars
✅ Works across all timeframes (best on 15min to 1hr charts)
✅ Helps you visually identify where institutions likely built their positions
Use it to quickly spot:
* Range boundaries that trap traders
* Gap zones likely to get filled
* High–low sweeps before reversals
⚙️ Recommended Use
1. Mark Friday’s high–low → Watch for liquidity sweeps on Monday.
2. When Monday holds above Friday’s high , breakout continuation is likely.
3. When Monday fails below Friday’s low , expect a reversal or trap.
4. Combine this with OI shifts, IV crush, and FII–DII flow data for confirmation.
⚠️ Disclaimer
This indicator is for **educational and analytical purposes only**.
It does **not constitute financial advice** or a trading signal.
Markets are dynamic — always perform your own research before trading or investing.

Illuminati Zone🟣 Illuminati Zone — Hidden Power of the 11 PM NZ Candle
The Illuminati Zone reveals the hidden footprints of liquidity and market imbalance formed by the 11 PM New Zealand 15-minute candle — a time when global liquidity transitions between major sessions.
This candle often defines key intraday supply and demand boundaries, serving as a magnet for price and a pivot point for high-probability reversals or breakouts.
🧠 How it works
Automatically detects and marks the 11 PM NZ 15-minute candle each day.
Draws a translucent zone box between its high and low.
Extends two reference lines at +1 × range and –1 × range above and below the zone — ideal for spotting overextensions or liquidity sweeps.
Supports custom lookback, colors, and visual options.
💡 How to use it
Watch how price interacts with the zone — rejection often signals smart-money activity.
Use +1 and –1 levels as overextended zones for potential reversals or breakout retests.
Combine with your own confluence tools or volume analysis for precision entries.
⚙️ Customization Options
Target hour (NZ time)
Days back to display
Zone and line colors
Transparency and visual preferences
🔮 Pro Tip: Pair it with a volume or imbalance indicator for surgical-level precision in identifying where smart money positions are built or released.

Wyckoff Effort vs. Result📌 Wyckoff Effort vs. Result (E/R) – Visualizing Supply & Demand Imbalance with Volume Confirmation
📖 Overview
The Wyckoff Effort vs. Result (E/R) indicator is designed to help traders interpret market behavior through the lens of volume vs. price movement — a foundational concept in Richard Wyckoff’s methodology.
This tool aims to highlight moments where the “effort” (volume) is not in proportion to the “result” (price movement) — giving insight into potential accumulation or distribution events.
By detecting high-volume candles and classifying them based on their price direction, the indicator visualizes zones where smart money might be active .
⚙️ How It Works
1. Effort Accumulation (High Volume Down Bar):
• When a candle closes lower than it opens (down bar) and has above-average volume , it’s marked as potential absorption of selling pressure (effort to push down met by buying).
• These candles are colored red and the open level is plotted, acting as a potential support or re-test zone.
2. Effort Distribution (High Volume Up Bar):
• When a candle closes higher than it opens (up bar) and has above-average volume , it’s marked as potential distribution (effort to push up absorbed by sellers).
• These candles are colored green and the open level is plotted , acting as a potential resistance or rejection zone.
3. Average Volume Calculation:
• The script calculates a simple moving average (SMA) of volume over a user-defined lookback period.
• If current volume exceeds the average multiplied by a set threshold, it’s treated as a high-effort bar .
🧪 Inputs
Input Description
Average Volume Lookback - Number of bars used to calculate the volume average
High Volume Multiplier. - Multiplier to define what qualifies as “high volume”
🖥️ Visual Output
• 🔴 Red candles = High volume on a down bar → possible accumulation
• 🟢 Green candles = High volume on an up bar → possible distribution
• 📉 Horizontal lines at bar open price mark the potential zones where effort occurred
These zones can serve as:
• Areas of support/resistance
• Trap zones where smart money absorbs liquidity
• Entry/exit filters when combined with price action
🧠 How to Use
• Use in combination with price structure, support/resistance, and volume profile tools
• Watch how price reacts when it revisits the plotted lines
• Look for effort bars that fail to lead to continuation, signaling potential reversal
• Can be used in scalping, swing trading, or Wyckoff-style phase analysis
🔒 Technical Notes
• ✅ Does not repaint
• ✅ Built with Pine Script v6
• ✅ Lightweight and customizable
• ❌ Does not generate buy/sell signals — it provides context, not predictions

Key-Levels - D/W/M High-Low + Fib + MA🧭 Key-Levels – D/W/M High-Low + Fibonacci + Moving Averages
A complete multi-timeframe analysis toolkit that combines Daily, Weekly, and Monthly high/low levels, Fibonacci retracements, and customizable moving averages — all in one clean, efficient display.
Ideal for traders who want to identify key reaction zones, retracement levels, and trend alignment across multiple timeframes.
🔹 Features
1. Prior High/Low Levels
Plots Daily (PDH/PDL), Weekly (PWH/PWL), and Monthly (PMH/PML) key levels
Adjustable colors, styles (Solid / Dashed / Dotted), and line widths
Optional midline display for each timeframe
Displays live labels with price values and % difference from current close
Extend lines rightward to project future price interactions
2. Fibonacci Retracement
Auto-detects swing highs/lows using configurable pivot lengths
Smart pivot logic prioritizes major swings based on % span
Auto-orients retracements depending on trend direction
Customizable visibility and color for each Fibonacci level
Supports 0.236 → 1.618 levels, with optional auto-extension in uptrend scenarios
Displays ratio + price for each level label
3. Pivot Labels
Optionally show pivot high/low labels with customizable text and background colors
Independent control of left/right length and label style
4. Moving Averages
Up to three customizable MAs (default: 8 EMA, 21 EMA, 50 SMA)
Choose between EMA or SMA for each
Toggle individual or all moving averages
Adjustable lengths, colors, and line widths
5. Alerts
Built-in alert condition for price crossing a user-defined level
Clean alert message format with ticker symbol and live price
⚙️ Customization
Flexible style controls for lines, labels, and colors
Adjustable right-extension length for projecting levels
Font size and visibility toggles for all elements
Smart grouping for intuitive settings management
📈 Ideal For
Identifying key reversal or breakout zones
Spotting Fibonacci confluence between retracements and prior highs/lows
Tracking trend structure via multi-timeframe MAs
Swing traders, intraday traders, and technical analysts
💡 Summary
Key-Levels – D/W/M High-Low + Fib + MA is a professional-grade indicator designed to simplify complex multi-timeframe analysis.
It helps you see the bigger picture, find actionable zones, and trade with confidence.
🧩 Compatible with any market and timeframe.

HUNT_line [Dr.Forexy]HUNT_line Indicator
📊 **Category:** Price Action & Market Structure
⏰ **Recommended Timeframe:** 5-minute and higher
🎯 **Purpose:** Advanced market structure visualization for professional traders
⸻
⚡ **Key Features:**
• Break of Structure (BOS) and Change of Character (CHOCH) detection
• Internal & Swing Market Structure analysis
• Order Blocks identification with smart filtering
• Fair Value Gaps (FVG) visualization
• Premium/Discount Zones
• Multi-timeframe support
• Real-time structure alerts
⸻
🛠 **How to Use:**
1. Apply on 5M or higher timeframes for best results
2. Monitor BOS/CHOCH for trend direction changes
3. Use Order Blocks as potential support/resistance areas
4. Watch for FVG fills as price inefficiency zones
5. Combine multiple confluences for higher probability setups
⸻
⚠️ **Risk Disclaimer:**
This indicator is for educational purposes only.
Not financial advice. Always conduct your own research.
⸻
🔹 **Credits:**
Inspired by LuxAlgo's "Smart Money Concepts" with custom improvements

Candle Opens by HAZED🎯 Candle Opens by HAZED - Multi-Timeframe Open Levels Indicator
📊 Overview
This powerful indicator displays multiple timeframe opening prices on your chart, providing crucial reference levels that institutional traders and algorithms frequently monitor. Track up to 7 different timeframe opens simultaneously, from 1-hour to yearly, with advanced visualization features including dynamic coloring, heatmap analysis, and real-time status tracking.
✨ Key Features
📈 Multi-Timeframe Support:
- 1H, 4H, Daily, Weekly, Monthly, Quarterly, and Yearly opens
- Each timeframe can be individually enabled/disabled
- Automatic visibility adjustment based on chart timeframe
🎨 Dynamic Visual System:
- Smart Color Coding: Lines automatically change color based on price position (green above, red below)
- Customizable Styling: Adjust line thickness, transparency, and colors
- Intelligent Line Positioning: Choose between equal-length or staggered lines for better visibility
- Enhanced Labels: Display timeframe only or include price with colored background
🌈 Advanced Heatmap:
- Background coloring shows overall market sentiment across all timeframes
- Gradient or solid color modes
- Instantly see when multiple timeframes align bullish or bearish
📊 Status Table Dashboard:
- Real-time overview of all active opens
- Shows current price position relative to each open
- Simplified view when all timeframes align
- Customizable position and font style
⚙️ Professional Tools:
- Alert system for new open levels
- Extended hours session support
- Price discovery mode for EOD/intraday discrepancies
- Left/right line extensions for enhanced visibility
💡 Trading Applications
Support & Resistance:
Opening prices act as natural support/resistance levels. Price often reacts at these levels, providing entry/exit opportunities.
Trend Confirmation:
When price is above multiple opens (especially higher timeframes), it confirms bullish momentum. The opposite indicates bearish pressure.
Mean Reversion:
Price tends to revert to significant opens, particularly daily and weekly levels. Use these as targets for counter-trend trades.
Breakout Trading:
Monitor when price breaks above/below clustered opens for potential continuation moves.
Risk Management:
Use opens as logical stop-loss levels or position sizing references based on distance from key opens.
🔧 Indicator Settings
Timeframes Section:
- Toggle each timeframe on/off
- Customize individual colors
Visual Style Section:
- Dynamic Colors: Auto-color based on price position
- Line Thickness: 1-4 pixels
- Transparency: 0-80%
- Extension Length: How far lines extend right
- Label Style: Plain or enhanced with price
Heatmap Section:
- Enable/disable background coloring
- Adjust transparency
- Choose gradient or solid zones
Status Table Section:
- Position on chart
- Font selection
Advanced Section:
- Enable alerts for new opens
- Price discovery mode
- Extended hours inclusion
]📈 Best Practices
1. Timeframe Selection:
- For intraday: Focus on 1H, 4H, and Daily
- For swing trading: Daily, Weekly, Monthly
- For position trading: Monthly, Quarterly, Yearly
2. Color Coding:
- Enable dynamic colors for instant sentiment reading
- Use heatmap for overall market bias
3. Confluence Zones:
- Pay special attention when multiple opens cluster
- These zones often produce stronger reactions
4. Alignment Signals:
- When all timeframes show same color = strong trend
- Mixed colors = potential consolidation or reversal zone
🎯 Pro Tips
- Volume Confirmation: Combine with volume indicators to confirm reactions at open levels
- Multiple Instruments: Compare opens across correlated assets for divergences
- News Events: Opens often act as magnets after major news releases
- Options Trading: Weekly and monthly opens align with options expiry levels
- Algorithmic Levels: Many algorithms use these opens for entries/exits
🔄 Updates in Version 8.3
- Added 1H and 4H timeframe support
- Enhanced dynamic color system
- Implemented heatmap visualization
- Added real-time status table
- Optimized performance for smoother operation
- Improved label styling options
- Better yearly timeframe detection
⚡ Performance Optimizations
This indicator uses advanced Pine Script v6 features for optimal performance:
- Efficient object reuse instead of recreation
- Smart calculation loops
- Minimal repainting
- Optimized for real-time updates
📝 Notes
- Works on all markets (stocks, forex, crypto, futures)
- Best on timeframes lower than the opens you're tracking
- Lines automatically hide when their timeframe is lower than chart timeframe
- Past opens are not displayed (indicator shows current opens only)
🙏 Credits & Support
Created by HAZED | Version 8.3
Optimized for TradingView Pine Script v6
For questions, suggestions, or bug reports, please comment below.
If you find this indicator useful, please consider leaving a like and a follow!
Remember: No indicator is perfect. Always use proper risk management and combine multiple confirmation signals in your trading decisions.

ICT Venom Trading Model [TradingFinder] SMC NY Session 2025SetupIntroduction
The ICT Venom Model is one of the most advanced strategies in the ICT framework, designed for intraday trading on major US indices such as US100, US30, and US500. This model is rooted in liquidity theory, time and price dynamics, and institutional order flow.
The Venom Model focuses on detecting Liquidity Sweeps, identifying Fair Value Gaps (FVG), and analyzing Market Structure Shifts (MSS). By combining these ICT core concepts, traders can filter false breakouts, capture sharp reversals, and align their entries with the real institutional liquidity flow during the New York Session.
Key Highlights of ICT Venom Model :
Intraday focus : Optimized for US indices (US100, US30, US500).
Time element : Critical window is 08:00–09:30 AM (Venom Box).
Liquidity sweep logic : Price grabs liquidity at 09:30 AM open.
Confirmation tools : MSS, CISD, FVG, and Order Blocks.
Dual setups : Works in both Bullish Venom and Bearish Venom conditions.
At its core, the ICT Venom Strategy is a framework that explains how institutional players manipulate liquidity pools by engineering false breakouts around the initial range of the market. Between 08:00 and 09:30 AM New York time, a range called the “Venom Box” is formed.
This range acts as a trap for retail traders, and once the 09:30 AM market open occurs, price usually sweeps either the high or the low of this box to collect stop-loss liquidity. After this liquidity grab, the market often reverses sharply, giving birth to a classic Bullish Venom Setup or Bearish Venom Setup
The Venom Model (ICT Venom Trading Strategy) is not just a pattern recognition tool but a precise institutional trading model based on time, liquidity, and market structure. By understanding the Initial Balance Range, watching for Liquidity Sweeps, and entering trades from FVG zones or Order Blocks, traders can anticipate market reversals with high accuracy. This strategy is widely respected among ICT followers because it offers both risk management discipline and clear entry/exit conditions. In short, the Venom Model transforms liquidity manipulation into actionable trading opportunities.
Bullish Setup :
Bearish Setup :
🔵 How to Use
The ICT Venom Model is applied by observing price behavior during the early hours of the New York session. The first step is to define the Initial Range, also called the Venom Box, which is formed between 08:00 and 09:30 AM EST. This range marks the high and low points where institutional traders often create traps for retail participants. Once the official market opens at 09:30 AM, price usually sweeps either the top or bottom of this box to collect liquidity.
After this liquidity grab, the market tends to reverse in alignment with the true directional bias. To confirm the setup, traders look for signals such as a Market Structure Shift (MSS), Change in State of Delivery (CISD), or the appearance of a Fair Value Gap (FVG). These elements validate the reversal and provide precise levels for trade execution.
🟣 Bullish Setup
In a Bullish Venom Setup, the market first sweeps the low of the Venom Box after 09:30 AM, triggering sell-side liquidity collection. This downward move is often sharp and deceptive, designed to stop out retail long positions and attract new sellers. Once liquidity is taken, the market typically shifts direction, forming an MSS or CISD that signals a reversal to the upside.
Traders then wait for price to retrace into a Fair Value Gap or a demand-side Order Block created during the reversal leg. This retracement offers the ideal entry point for long positions. Stop-loss placement should be just below the liquidity sweep low, while profit targets are set at the Venom Box high and, if momentum continues, at higher session or daily highs.
🟣 Bearish Setup
In a Bearish Venom Setup, the process is similar but reversed. After the Initial Range is defined, if price breaks above the Venom Box high following the 09:30 AM open, it signals a false breakout designed to collect buy-side liquidity. This move usually traps eager buyers and clears out stop-losses above the high.
After the liquidity sweep, confirmation comes through an MSS or CISD pointing to a reversal downward. At this stage, traders anticipate a retracement into a Fair Value Gap or a supply-side Order Block formed during the reversal. Short entries are taken within this zone, with stop-loss positioned just above the liquidity sweep high. The logical profit targets include the Venom Box low and, in stronger bearish momentum, deeper session or daily lows.
🔵 Settings
Refine Order Block : Enables finer adjustments to Order Block levels for more accurate price responses.
Mitigation Level OB : Allows users to set specific reaction points within an Order Block, including: Proximal: Closest level to the current price. 50% OB: Midpoint of the Order Block. Distal: Farthest level from the current price.
FVG Filter : The Judas Swing indicator includes a filter for Fair Value Gap (FVG), allowing different filtering based on FVG width: FVG Filter Type: Can be set to "Very Aggressive," "Aggressive," "Defensive," or "Very Defensive." Higher defensiveness narrows the FVG width, focusing on narrower gaps.
Mitigation Level FVG : Like the Order Block, you can set price reaction levels for FVG with options such as Proximal, 50% OB, and Distal.
CISD : The Bar Back Check option enables traders to specify the number of past candles checked for identifying the CISD Level, enhancing CISD Level accuracy on the chart.
🔵 Conclusion
The ICT Venom Model is more than just a reversal setup; it is a complete intraday trading framework that blends liquidity theory, time precision, and market structure analysis. By focusing on the Initial Range between 08:00 and 09:30 AM New York time and observing how price reacts at the 09:30 AM open, traders can identify liquidity sweeps that reveal institutional intentions.
Whether in a Bullish Venom Setup or a Bearish Venom Setup, the model allows for precise entries through Fair Value Gaps (FVGs) and Order Blocks, while maintaining clear risk management with well-defined stop-loss and target levels.
Ultimately, the ICT Venom Model provides traders with a structured way to filter false moves and align their trades with institutional order flow. Its strength lies in transforming liquidity manipulation into actionable opportunities, giving intraday traders an edge in timing, accuracy, and consistency. For those who master its logic, the Venom Model becomes not only a strategy for entry and exit, but also a deeper framework for understanding how liquidity truly drives price in the New York session.

ICT SMC — OB & FVG (Enhanced v6)This indicator is a comprehensive implementation of ICT Smart Money Concepts (SMC), focusing on Order Blocks (OB) and Fair Value Gaps (FVG) with enhanced detection logic and session-based filtering.
🔍 Key Features
Impulse-Based OB Detection: Identifies bullish and bearish order blocks using configurable impulse bar logic and ATR-based movement thresholds.
Fair Value Gap Detection: Highlights FVGs based on price displacement logic, helping traders spot potential inefficiencies in price action.
Session Filtering: Allows users to filter signals based on major trading sessions (Sydney, Tokyo, London, New York).
Trend & Volume Confirmation: Integrates EMA slope, market structure breaks, and volume analysis to score trade signals.
Visual Zones: Displays OB and FVG zones using colored boxes with customizable transparency and color settings.
Signal Alerts: Generates long/short trade signals based on a scoring system and session validation, with built-in alert conditions.
⚙️ Customization
Adjustable EMA and ATR lengths
Configurable impulse bar count and movement thresholds
Toggleable session filters
Custom colors for OB and FVG zones
📈 Use Cases
This tool is ideal for traders who follow ICT concepts and want a visual, automated way to identify high-probability zones and trade setups based on smart money principles.

SCTI - D14SCTI - D14 Comprehensive Technical Analysis Suite
English Description
SCTI D14 is an advanced multi-component technical analysis indicator designed for professional traders and analysts. This comprehensive suite combines multiple analytical tools into a single, powerful indicator that provides deep market insights across various timeframes and methodologies.
Core Components:
1. EMA System (Exponential Moving Averages)
13 customizable EMA lines with periods ranging from 8 to 2584
Fibonacci-based periods (8, 13, 21, 34, 55, 89, 144, 233, 377, 610, 987, 1597, 2584)
Color-coded visualization for easy trend identification
Individual toggle controls for each EMA line
2. TFMA (Multi-Timeframe Moving Averages)
Cross-timeframe analysis with 3 independent EMA calculations
Real-time labels showing trend direction and price relationships
Customizable timeframes for each moving average
Percentage deviation display from current price
3. PMA (Precision Moving Average Cloud)
7-layer moving average system with customizable periods
Fill areas between moving averages for trend visualization
Support and resistance zone identification
Dynamic color-coded trend clouds
4. VWAP (Volume Weighted Average Price)
Multiple anchor points (Session, Week, Month, Quarter, Year, Earnings, Dividends, Splits)
Standard deviation bands for volatility analysis
Automatic session detection and anchoring
Statistical price level identification
5. Advanced Divergence Detector
12 technical indicators for divergence analysis (MACD, RSI, Stochastic, CCI, Williams %R, Bias, Momentum, OBV, VW-MACD, CMF, MFI, External)
Regular and hidden divergences detection
Bullish and bearish signals with visual confirmation
Customizable sensitivity and filtering options
Real-time alerts for divergence formations
6. Volume Profile & Node Analysis
Comprehensive volume distribution analysis
Point of Control (POC) identification
Value Area High/Low (VAH/VAL) calculations
Volume peaks and troughs detection
Support and resistance levels based on volume
7. Smart Money Concepts
Market structure analysis with Break of Structure (BOS) and Change of Character (CHoCH)
Internal and swing structure detection
Equal highs and lows identification
Fair Value Gaps (FVG) detection and visualization
Liquidity zones and institutional flow analysis
8. Trading Sessions
9 major trading sessions (Asia, Sydney, Tokyo, Shanghai, Hong Kong, Europe, London, New York, NYSE)
Real-time session status and countdown timers
Session volume and performance tracking
Customizable session boxes and labels
Statistical session analysis table
Key Features:
Modular Design: Enable/disable any component independently
Real-time Analysis: Live updates with market data
Multi-timeframe Support: Works across all chart timeframes
Customizable Alerts: Set alerts for any detected pattern or signal
Professional Visualization: Clean, organized display with customizable colors
Performance Optimized: Efficient code for smooth chart performance
Use Cases:
Trend Analysis: Identify market direction using multiple EMA systems
Entry/Exit Points: Use divergences and structure breaks for timing
Risk Management: Utilize volume profiles and session analysis for better positioning
Multi-timeframe Analysis: Confirm signals across different timeframes
Institutional Analysis: Track smart money flows and market structure
Perfect For:
Day traders seeking comprehensive market analysis
Swing traders needing multi-timeframe confirmation
Professional analysts requiring detailed market structure insights
Algorithmic traders looking for systematic signal generation
---
中文描述
SCTI - D14是一个先进的多组件技术分析指标,专为专业交易者和分析师设计。这个综合套件将多种分析工具整合到一个强大的指标中,在各种时间框架和方法论中提供深度市场洞察。
核心组件:
1. EMA系统(指数移动平均线)
13条可定制EMA线,周期从8到2584
基于斐波那契的周期(8, 13, 21, 34, 55, 89, 144, 233, 377, 610, 987, 1597, 2584)
颜色编码可视化,便于趋势识别
每条EMA线的独立切换控制
2. TFMA(多时间框架移动平均线)
跨时间框架分析,包含3个独立的EMA计算
实时标签显示趋势方向和价格关系
每个移动平均线的可定制时间框架
显示与当前价格的百分比偏差
3. PMA(精密移动平均云)
7层移动平均系统,周期可定制
移动平均线间填充区域用于趋势可视化
支撑阻力区域识别
动态颜色编码趋势云
4. VWAP(成交量加权平均价格)
多个锚点(交易时段、周、月、季、年、财报、分红、拆股)
标准差带用于波动性分析
自动时段检测和锚定
统计价格水平识别
5. 高级背离检测器
12个技术指标用于背离分析(MACD、RSI、随机指标、CCI、威廉姆斯%R、Bias、动量、OBV、VW-MACD、CMF、MFI、外部指标)
常规和隐藏背离检测
看涨看跌信号配视觉确认
可定制敏感度和过滤选项
背离形成的实时警报
6. 成交量分布与节点分析
全面的成交量分布分析
控制点(POC)识别
价值区域高/低点(VAH/VAL)计算
成交量峰值和低谷检测
基于成交量的支撑阻力水平
7. 聪明钱概念
市场结构分析,包括结构突破(BOS)和结构转变(CHoCH)
内部和摆动结构检测
等高等低识别
公允价值缺口(FVG)检测和可视化
流动性区域和机构资金流分析
8. 交易时区
9个主要交易时段(亚洲、悉尼、东京、上海、香港、欧洲、伦敦、纽约、纽交所)
实时时段状态和倒计时器
时段成交量和表现跟踪
可定制时段框和标签
统计时段分析表格
主要特性:
模块化设计:可独立启用/禁用任何组件
实时分析:随市场数据实时更新
多时间框架支持:适用于所有图表时间框架
可定制警报:为任何检测到的模式或信号设置警报
专业可视化:清洁、有序的显示界面,颜色可定制
性能优化:高效代码确保图表流畅运行
使用场景:
趋势分析:使用多重EMA系统识别市场方向
入场/出场点:利用背离和结构突破进行时机选择
风险管理:利用成交量分布和时段分析进行更好定位
多时间框架分析:在不同时间框架间确认信号
机构分析:跟踪聪明钱流向和市场结构
适用于:
寻求全面市场分析的日内交易者
需要多时间框架确认的摆动交易者
需要详细市场结构洞察的专业分析师
寻求系统化信号生成的算法交易者

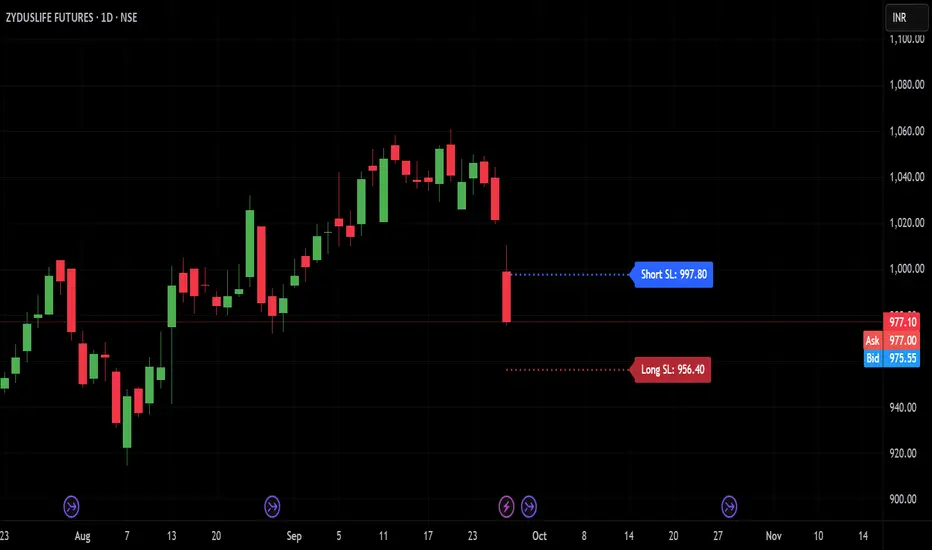
TRP Stop-Loss_Trailing SL# TRP Stop-Loss Indicator
## Overview
The TRP (True Range Percentage) Stop-Loss indicator is an advanced volatility-based stop-loss tool that provides dynamic position protection based on market volatility. Unlike traditional ATR-based indicators, TRP calculates volatility as a percentage of price, offering superior adaptability across different price ranges and market conditions.
## What is TRP and Why It's Superior to ATR
### TRP (True Range Percentage)
TRP calculates the true range as a percentage of the closing price, providing a **normalized volatility measure**. The formula is:
```
TRP = (True Range / Close) × 100
```
### Key Advantages of TRP over ATR:
1. **Price-Normalized Volatility**: TRP automatically adjusts for different price levels, making it equally effective whether you're trading a $10 stock or a $1000 stock.
2. **Percentage-Based Risk**: TRP gives you direct percentage risk values, making position sizing and risk management more intuitive.
3. **Better Cross-Market Comparison**: Unlike ATR, TRP allows you to compare volatility across different instruments on an equal basis.
4. **Adaptive to Market Conditions**: TRP naturally scales with price movements, providing more relevant stop-loss levels during trending markets.
5. **Consistent Risk Exposure**: Maintains consistent percentage risk regardless of the underlying asset's price level.
## Indicator Features
### 🎯 **Dual Stop-Loss System**
- **Long SL**: Red line below price for long positions
- **Short SL**: Blue line above price for short positions
- Independent control for each direction
### ⚙️ **Advanced Calculation Options**
#### **Multiple TRP Calculation Sources:**
- **Current Candle**: Uses real-time running candle data
- **Previous Close**: Uses completed candle data (default)
- **Last Green Candle**: For longs - uses TRP from the most recent bullish candle
- **Last Red Candle**: For shorts - uses TRP from the most recent bearish candle
#### **Independent Multipliers:**
- Separate multiplier controls for long and short stop-losses
- Adjust risk levels independently (0.1x to 10x+ range)
- Fine-tune stop-loss distance based on your risk tolerance
### 📊 **Visual Customization**
- **Line Styles**: Solid, dashed, or dotted lines
- **Custom Colors**: Separate color controls for long/short SL
- **Line Width**: Adjustable thickness (1-10)
- **Extension**: Customizable projection bars to the right
### 🏷️ **Smart Labeling System**
- **Value Display**: Shows exact SL price on the right side of lines
- **Toggle Control**: Enable/disable labels as needed
- **Size Options**: 5 different label sizes (tiny to huge)
- **Color Coordination**: Labels match their respective line colors
### ⏰ **Multi-Timeframe Support**
- Calculate TRP on any timeframe while viewing on another
- Default: Daily TRP calculation for intraday charts
- Maintains calculation integrity across timeframe switches
## How to Use
### Basic Setup:
1. Add the indicator to your chart
2. Select your preferred timeframe for TRP calculation
3. Choose calculation source for long and short positions
4. Adjust multipliers based on your risk tolerance
### Risk Management Applications:
- **Conservative**: Use 0.5-0.8 multipliers for tighter stops
- **Standard**: Use 1.0 multiplier for normal volatility-based stops
- **Aggressive**: Use 1.2-2.0 multipliers for wider stops in volatile markets
### Advanced Strategies:
- **Trend Following**: Use "Last Green/Red Candle" sources to adapt to momentum changes
- **Breakout Trading**: Use "Current Candle" for real-time stop adjustments
- **Swing Trading**: Use "Previous Close" for stable, confirmed levels
## Key Benefits
✅ **Dynamic Adaptation**: Automatically adjusts to changing market volatility
✅ **Percentage Risk Control**: Direct percentage-based risk management
✅ **Multi-Strategy Compatible**: Works with scalping, day trading, and swing trading
✅ **Visual Clarity**: Clean, professional chart display with customizable appearance
✅ **Real-Time Updates**: Instant recalculation when settings change
✅ **No Overlapping Lines**: Smart line management prevents chart clutter
## Best Practices
1. **Backtest First**: Test different multiplier settings on historical data
2. **Market Adaptation**: Adjust multipliers based on current market volatility regime
3. **Combine with Other Signals**: Use TRP stops with your existing entry signals
4. **Position Sizing**: Use TRP percentage values for consistent position sizing
5. **Regular Review**: Periodically review and adjust settings based on performance
## Technical Specifications
- **Pine Script Version**: v6
- **Overlay**: Yes (draws directly on price chart)
- **Calculations**: Based on 50-period EMA of TRP values
- **Updates**: Real-time with automatic line management
- **Performance**: Optimized for fast execution and minimal lag
This indicator is ideal for traders who want professional-grade, volatility-adaptive stop-loss management with the flexibility to fine-tune risk parameters across different market conditions and trading styles.
SMC BOS - Structure Breaks & Median Continuation ProjectionsThis tool shows what usually happens after a Break of Structure (BOS).
It scans past BOS events on your chart, finds the ones most similar to the latest break (using ATR to filter by volatility), and then plots the median continuation path.
Optional percentile bands (P10–P90) display the possible range of outcomes around the median.
Key features:
• Automatic detection of bullish and bearish BOS events
• Library of past BOS with adjustable size and spacing
• ATR-based similarity and recency weighting
• Median continuation projections with optional percentile bands
• Customizable colors, signals, and stats table
• Works on any market and timeframe
Use cases:
• See how price typically behaves after a BOS
• Support SMC analysis with data-driven projections
• Improve trade planning by visualizing likely continuations
• Apply across crypto, forex, stocks, and futures
Originality:
Instead of only marking BOS, this script learns from history and projects forward the median path of the most similar past cases, adjusted for volatility. It turns BOS signals into practical continuation scenarios.
Instructions:
Add the indicator to your chart. When a BOS is detected, the projection is drawn automatically.
Use the settings to adjust the library, ATR weighting, projection style, percentile bands, and the display of signals or stats.
For questions or customization, contact Julien Eche (Julien_Eche) on TradingView.

DashBoard 2.3.1📌 Indicator Name:
DashBoard 2.3 – Smart Visual Market Overlay
📋 Description:
DashBoard 2.3 is a clean, efficient, and highly informative market overlay, designed to give you real-time context directly on your chart — without distractions. Whether you're swing trading or investing long-term, this tool keeps critical market data at your fingertips.
🔍 Key Features:
Symbol + Timeframe + Market Cap
Shows the current ticker and timeframe, optionally with real-time market cap.
ATR 14 with Volatility Signal
Displays ATR with color-coded risk levels:
🟢 Low
🟡 Moderate
🔴 High
⚫️ Extreme
You can choose between Daily ATR or timeframe-based ATR (auto-adjusted to chart resolution).
Adaptive Labeling
The ATR label updates to reflect the resolution:
ATR 14d (daily)
ATR 14W (weekly)
ATR 14H (hourly), etc.
Moving Average Tracker
Instantly shows whether price is above or below your selected moving average (e.g., 150 MA), with green/red indication.
Earnings Countdown
Clearly shows how many days remain until the next earnings report.
Industry & Sector Info (optional)
Useful for thematic or sector-based trading strategies.
Fully Customizable UI
Choose positioning, padding, font size, and which data to show. Designed for minimalism and clarity.
✅ Smart Logic:
Color dots appear only in relevant conditions (e.g., ATR color signals shown only on daily when enabled).
ATR display automatically reflects your time frame, if selected.
Clean chart integration – the overlay sits quietly in a corner, enhancing your analysis without intruding.
🧠 Ideal for:
Swing traders, position traders, and investors who want fast, high-impact insights directly from the chart.
Anyone looking for a compact, beautiful, and informative dashboard while they trade.

Simple Technicals Table📊 Simple Technicals Table
🎯 A comprehensive technical analysis dashboard displaying key pivot points and moving averages across multiple timeframes
📋 OVERVIEW
The Simple Technicals Table is a powerful indicator that organizes essential trading data into a clean, customizable table format. It combines Fibonacci-based pivot points with critical moving averages for both daily and weekly timeframes, giving traders instant access to key support/resistance levels and trend information.
Perfect for:
Technical analysts studying multi-timeframe data
Chart readers needing quick reference levels
Market researchers analyzing price patterns
Educational purposes and data visualization
🚀 KEY FEATURES
📊 Dual Timeframe Analysis
Daily (D1) and Weekly (W1) data side-by-side
Real-time updates as market conditions change
Seamless comparison between timeframes
🎯 Fibonacci Pivot Points
R3, R2, R1 : Resistance levels using Fibonacci ratios (38.2%, 61.8%, 100%)
PP : Central pivot point from previous period's data
S1, S2, S3 : Support levels with same methodology
📈 Complete EMA Suite
EMA 10 : Short-term trend identification
EMA 20 : Popular swing trading reference
EMA 50 : Medium-term trend confirmation
EMA 100 : Institutional support/resistance
EMA 200 : Long-term trend determination
📊 Essential Indicators
RSI 14 : Momentum for overbought/oversold conditions
ATR 14 : Volatility measurement for risk management
🎨 Full Customization
9 table positions : Place anywhere on your chart
5 text sizes : Tiny to huge for optimal visibility
Custom colors : Background, headers, and text
Optional pivot lines : Visual weekly levels on chart
⚙️ HOW IT WORKS
Fibonacci Pivot Calculation:
Pivot Point (PP) = (High + Low + Close) / 3
Range = High - Low
Resistance Levels:
R1 = PP + (Range × 0.382)
R2 = PP + (Range × 0.618)
R3 = PP + (Range × 1.000)
Support Levels:
S1 = PP - (Range × 0.382)
S2 = PP - (Range × 0.618)
S3 = PP - (Range × 1.000)
Smart Price Formatting:
< $1: 5 decimal places (crypto-friendly)
$1-$10: 4 decimal places
$10-$100: 3 decimal places
> $100: 2 decimal places
📊 TECHNICAL ANALYSIS APPLICATIONS
⚠️ EDUCATIONAL PURPOSE ONLY
This indicator is designed solely for technical analysis and educational purposes . It provides data visualization to help understand market structure and price relationships.
📈 Data Analysis Uses
Support & Resistance Identification : Visualize Fibonacci-based pivot levels
Trend Analysis : Study EMA relationships and price positioning
Multi-Timeframe Study : Compare daily and weekly technical data
Market Structure : Understand key technical levels and indicators
📚 Educational Benefits
Learn about Fibonacci pivot point calculations
Understand moving average relationships
Study RSI and ATR indicator values
Practice multi-timeframe technical analysis
🔍 Data Visualization Features
Organized table format for easy data reading
Color-coded levels for quick identification
Real-time technical indicator values
Historical data integrity maintained
🛠️ SETUP GUIDE
1. Installation
Search "Simple Technicals Table" in indicators
Add to chart (appears in middle-left by default)
Table displays automatically on any timeframe
2. Customization
Table Position : Choose from 9 locations
Text Size : Adjust for screen resolution
Colors : Match your chart theme
Pivot Lines : Toggle weekly level visualization
3. Optimization Tips
Use larger text on mobile devices
Dark backgrounds work well with light text
Enable pivot lines for visual reference
✅ BEST PRACTICES
Recommended Usage:
Use for technical analysis and educational study only
Combine with other analytical methods for comprehensive analysis
Study multi-timeframe data relationships
Practice understanding technical indicator values
Important Notes:
Levels based on previous period's data
Most effective in trending markets
No repainting - uses confirmed data only
Works on all instruments and timeframes
🔧 TECHNICAL SPECS
Performance:
Pine Script v5 optimized code
Minimal CPU/memory usage
Real-time data updates
No lookahead bias
Compatibility:
All chart types (Candlestick, Bar, Line)
Any instrument (Stocks, Forex, Crypto, etc.)
All timeframes supported
Mobile and desktop friendly
Data Accuracy:
Precise floating-point calculations
Historical data integrity maintained
No future data leakage
📱 DEVICE SUPPORT
✅ Desktop browsers (Chrome, Firefox, Safari, Edge)
✅ TradingView mobile app (iOS/Android)
✅ TradingView desktop application
✅ Light and dark themes
✅ All screen resolutions
📋 VERSION INFO
Version 1.0 - Initial Release
Fibonacci-based pivot calculations
Dual timeframe support (Daily/Weekly)
Complete EMA suite (10, 20, 50, 100, 200)
RSI and ATR indicators
Fully customizable interface
Optional pivot line visualization
Smart price formatting
Mobile-optimized display
⚠️ DISCLAIMER
This indicator is designed for technical analysis, educational and informational purposes ONLY . It provides data visualization and technical calculations to help users understand market structure and price relationships.
⚠️ NOT FOR TRADING DECISIONS
This tool does NOT provide trading signals or investment advice
All data is for analytical and educational purposes only
Users should not base trading decisions solely on this indicator
Always conduct thorough research and analysis before making any financial decisions
📚 Educational Use Only
Use for learning technical analysis concepts
Study market data and indicator relationships
Practice chart reading and data interpretation
Understand mathematical calculations behind technical indicators
The Simple Technicals Table provides technical data visualization to assist in market analysis education. It does not constitute financial advice, trading recommendations, or investment guidance. Users are solely responsible for their own research and decisions.
Author: ToTrieu
Version: 1.0
Category: Technical Analysis / Support & Resistance
License: Open source for educational use
💬 Questions? Comments? Feel free to reach out!
