LIT - ConfirmationsOverview
The LIT - Confirmations Indicator is a dynamic checklist tool designed for traders who uses LIT Strategy (Liquidity Inducement Theory) following liquidity and smart money concepts as benefit. This tool allows users to document and track essential trading confirmations directly on their TradingView charts, offering a structured and visual approach to market analysis.
What Makes This Unique?
Unlike other open-source tools, the LIT - Confirmations Indicator introduces a fully interactive and customizable table directly on the chart. This table provides real-time feedback with clear ✅ (checked) and ❌ (unchecked) visual indicators for each confirmation. The user can position the table on the chart according to their preference, ensuring it integrates seamlessly into their trading workflow without obscuring critical chart data.
How It Works
1. Predefined Confirmations
The indicator includes a set of commonly used trading confirmations:
Identify Liquidity: Mark areas where liquidity might pool.
Inducement: Confirm the presence of inducements before market reversals.
Relevant Break of Structure (BOS): Validate critical structural changes.
Mitigation after RBoS: Check for mitigation following a BOS.
Smart Money Trap (SMT): Identify traps often utilized by smart money.
Timing: Ensure trades are entered during high-probability time windows.
Mitigation to the Leftside: Confirm whether price action aligns with prior mitigations.
Set Targets: Define and document logical take-profit or stop-loss levels.
2.Interactive Table Display
A table is dynamically created on the chart, showing all confirmations with their current state (checked or unchecked).
Users can choose the position of the table (top, middle, or bottom and left, center, or right) and customize its background color for better visibility.
3. Customization
All confirmations are toggled through the input settings, allowing traders to adapt the indicator to their unique strategies.
The display can be easily adjusted to match the trader’s preferences without cluttering the chart.
How to Use
1. Add the indicator to your chart.
2. Open the settings panel to activate the relevant confirmations for your analysis.
3. Use the Display Settings section to adjust the table's position and background color.
4. View the table on your chart to track selected confirmations in real-time.
Who Is This For?
This indicator is ideal for traders who:
Use Liquidity Inducent Theory strategy in their analysis.
Prefer a structured and systematic trading approach.
Need an on-chart tool to document confirmations without relying on external notes or tools.
Why Closed Source?
The logic behind the interactive table and confirmation system is specifically tailored to LIT practitioners and is not publicly available in existing open-source scripts. The closed-source nature of this script protects its unique implementation, ensuring the integrity and exclusivity of the tool.
Disclaimer
This indicator does not provide trading signals or strategies. It is a tool to document user-defined confirmations and should be used in conjunction with a thorough understanding of market behavior and risk management practices.
Tìm kiếm tập lệnh với "smt"

90 Minute Cycles Full90-Minute Cycles Indicator for London and NY Sessions
This is a more streamlined version of the 90-minute cycle indicator by sunwoo101.
The 90-Minute Cycles Indicator is built to help traders easily follow and trade around key market cycles during the London and New York sessions. Marking important 90-minute intervals and highlighting the True Cycle Open Price provides clear visual cues to help you make more informed trading decisions.
Key Features:
90-Minute Cycles for London and NY: The indicator automatically draws vertical lines marking every 90-minute cycle for the London and NY sessions. These lines are great for timing your trades and spotting potential shifts in market momentum.
True Cycle Open Price: A horizontal line is drawn at the True Cycle Open Price, which stays visible throughout the session. This gives you a key reference point for price levels that tend to act as support or resistance.
Customizable Visuals: You can fully personalize the indicator’s appearance - adjusting the colors and line styles and even controlling when the lines appear - so it blends perfectly with your existing charts.
All Cycles Drawn from the Start: Unlike other indicators, this one draws all the 90-minute cycles right when the session begins, so you can see the full day’s potential market moves as soon as the first cycle starts.
What’s Different About This Indicator:
London Session Support: In addition to the NY session, you now have 90-minute cycles for the London session, complete with its own True Cycle Open Price.
Better Customization: You have more control over the visual aspects of the indicator, so it can be tailored to fit your specific charting preferences.
Complete Cycle Visibility: All cycles are drawn immediately when the session starts, providing a full view of the day’s key moments right from the opening.
How to Use:
This indicator is perfect for scalping and short-term trading. Whether trading Forex or Indices and following SMT concepts, the cycle timing can help you pinpoint the best times for entering and exiting trades. The True Cycle Open Price is a crucial level of support or resistance throughout the session, making it a key marker to watch.
Scalpers: Use the 90-minute cycle lines to time your trades with the market's rhythm.
Day Traders: This indicator tracks the London and NY sessions, making it an excellent tool for day trading strategies where timing is critical.
Multi-Session Support:
Whether you're trading the London or New York session, the indicator will automatically adjust to your time zone and align the cycles to the relevant session. This helps you stay on top of key market activity across major trading hubs without changing anything manually.

[UST] Protein+Support/Resistance Script: A Comprehensive Overview
Thanks to Pmgjiv for providing the foundation to this improved Version.
In the world of trading, having a robust support and resistance analysis tool can make a significant difference in decision-making and overall strategy. Let's delve into the enhancements made to the support/resistance script and how each component contributes to a trader's arsenal:
Changes and improvements made for the script to help Traders make better rational decisions in their Trading:
1. Multiple Timeframes:
Integrating multiple timeframes into the analysis provides a multi-dimensional view of the market. Traders can now assess price action across different time horizons simultaneously. This feature allows for a deeper understanding of market dynamics and helps in identifying significant support and resistance levels across various timeframes.
2. Timeframe Labels Inside Zones:
By including timeframe labels within the zones, traders can easily identify the origin of each support or resistance level. This contextual information enhances clarity and facilitates more informed decision-making, especially when navigating through multiple timeframes.
3. Visual Zone Update:
Visual updates on zones enable traders to track changes in support and resistance levels in real-time. This dynamic feature enhances the analytical process by providing immediate insights into evolving market conditions, thereby enabling traders to adapt their strategies accordingly.
4. Zones Hit:
Understanding the frequency and intensity of zone hits offers valuable insights into the strength and relevance of support and resistance levels. Traders can gauge the significance of each zone based on its historical interaction with price, thereby gaining a deeper understanding of market sentiment and potential trading opportunities.
5. Option to Turn off Current Timeframe:
The ability to toggle off the current timeframe streamlines chart analysis by focusing only on the most critical support and resistance zones. This decluttering feature helps traders prioritize key levels, reducing cognitive overload and enhancing decision-making efficiency.
Explanation of Additional Functions:
a. Lookback:
The 'lookback' parameter allows traders to customize the age of support and resistance zones based on their trading style and preferences. By adjusting the lookback setting, traders can choose whether to prioritize recent price action or consider historical data, thus tailoring the analysis to their specific trading strategies.
b. Swinglength:
Swinglength determines the sensitivity of the support and resistance zones. By modifying this parameter, traders can control how aggressively the script identifies pivot points. A higher swinglength value results in smoother, more stable zones, whereas a lower value increases sensitivity, capturing smaller price movements.
c. ZigZag Indicator:
The ZigZag indicator plays a pivotal role in identifying significant price reversals. Its period setting determines the number of price bars considered before confirming a pivot point. Traders can utilize this indicator to identify key turning points in the market, aiding in the identification of robust support and resistance levels.
Impact of Sensitivity on Zones:
Adjusting the sensitivity of the ZigZag indicator directly influences the identification and delineation of support and resistance zones. Higher sensitivity levels result in fewer but more robust zones, capturing significant price movements. Conversely, lower sensitivity levels yield more zones, accommodating smaller price fluctuations but potentially introducing noise into the analysis.
d. S/R Range:
The ability to adjust the width of support and resistance zones allows traders to customize the breadth of key areas on a chart. Choosing a wider range encompasses a broader spectrum of prices, thereby identifying more comprehensive support and resistance levels. This flexibility enables traders to adapt their analysis to different market conditions and trading strategies.
Utilization in Trading:
Comprehensive Analysis: By incorporating multiple timeframes, traders gain a holistic view of market dynamics, enabling them to identify high-probability trading opportunities across various horizons.
Contextual Understanding: Timeframe labels within zones provide context, helping traders understand the significance of each level in relation to different timeframes and market conditions.
Real-time Adaptability: Visual zone updates facilitate real-time analysis, allowing traders to adjust their strategies promptly in response to changing market conditions.
Informed Decision-making: By considering zone hits, traders can assess the strength and relevance of support and resistance levels, enhancing their ability to make informed trading decisions.
Customized Analysis: Adjustable parameters such as lookback, swinglength, and sensitivity empower traders to tailor the analysis to their individual trading styles and preferences, enhancing precision and effectiveness.
In summary, these enhancements to the support/resistance script provide traders with a powerful toolkit for analyzing market dynamics, identifying key levels, and executing well-informed trading strategies across various timeframes and market conditions.

Order-Block Detector ICT/SMT + FVG + SignalsOrderBlock-Finder
This script shows order-blocks (OB) and fair-value-gaps (FVG). Additionaly there are entry signals for OB and FVG. The Dist-Parameter tell how many candles should exist between the beginning of the OB or FVG and the pullback.
Order-Blocks
An order block in trading typically refers to a significant grouping of buy or sell orders at a particular price level within a financial market. These blocks of orders can influence price movement when they are executed. Here's a breakdown:
Buy Order Block: This occurs when there's a large concentration of buy orders at a specific price level. It indicates a significant interest among traders to purchase the asset if the price reaches that level.
Sell Order Block: Conversely, a sell order block happens when there's a notable accumulation of sell orders at a particular price level. This suggests that many traders are willing to sell the asset if the price reaches that level.
Impact on Price: Order blocks can influence price movement because when the market approaches these levels, the orders within the block may be triggered, leading to increased buying or selling pressure, depending on the type of block. This surge in trading activity can cause the price to either bounce off the level or break through it.
Support and Resistance: Order blocks are often associated with support and resistance levels. A buy order block may act as support, preventing the price from falling further, while a sell order block may serve as resistance, hindering upward price movement.
Fair-Value-Gap
The fair value gap in trading refers to the difference between the current market price of an asset and its calculated fair value. This concept is often used in financial markets, especially in the context of stocks and other securities. Here's a breakdown:
Market Price: The market price is the price at which an asset is currently trading in the market. It is determined by the interaction of supply and demand forces, as well as various other factors such as news, sentiment, and economic conditions.
Fair Value: Fair value represents the estimated intrinsic value of an asset based on fundamental analysis, which includes factors such as earnings, dividends, cash flow, growth prospects, and prevailing interest rates. It's essentially what an asset should be worth based on its fundamentals.
Fair Value Calculation: Analysts and investors use various methods to calculate the fair value of an asset. Common approaches include discounted cash flow (DCF) analysis, comparable company analysis (CCA), and dividend discount models (DDM), among others.
Fair Value Gap: The fair value gap is the numerical difference between the calculated fair value of an asset and its current market price. If the market price is higher than the fair value, it suggests that the asset may be overvalued. Conversely, if the market price is lower than the fair value, it indicates that the asset may be undervalued.
Trading Implications: Traders and investors often pay attention to the fair value gap to identify potential trading opportunities. If the market price deviates significantly from the fair value, it may present opportunities to buy or sell the asset with the expectation that the market price will eventually converge towards its fair value.

Price PressureDescription:
The Price Pressure Indicator, developed by OmegaTools, is a robust and versatile tool designed to assist traders in analyzing market dynamics and identifying potential trend shifts. This open-source script, offers a unique approach to understanding price pressure over specified periods, enhancing the user's ability to make informed trading decisions.
Key Features:
1. Dynamic Length Configuration: The indicator allows users to customize the length parameter, ranging from 9 to 100, providing flexibility in adapting to different market conditions.
2. Extensions Control: Traders can fine-tune the extension levels (ob) between 50 and 90, allowing for precise adjustments based on their risk tolerance and trading preferences.
3. Normalization and Oscillation: The script employs a normalization function to standardize price data, offering a clearer representation of market pressure. The resulting oscillator visualizes the normalized pressure, highlighting potential market trends.
4. Pressure Calculation: The indicator calculates price pressure by considering the difference between the previous high and the current close, as well as the difference between the current close and the previous low. This innovative approach enhances the accuracy of pressure analysis.
5. Smoothing Option: While the script currently uses a simple moving average for smoothing, traders have the option to explore other smoothing methods by uncommenting the "smt" input line.
6. Visual Clarity: The indicator provides a visually intuitive representation of pressure and signal lines, aiding traders in quickly interpreting market conditions. The color-coded display enhances user experience, with the ability to discern bullish and bearish pressures.
7. Premium and Discount Zones: The script identifies premium and discount areas, assisting traders in spotting potential buying or selling opportunities. The premium and discount lines can be adjusted based on individual risk tolerance and strategy.
How to Use:
1. Adjust the length and extension parameters based on your trading preferences.
2. Interpret the oscillator and signal lines for insights into market pressure.
3. Utilize premium and discount zones to identify potential entry or exit points.
4. Experiment with different smoothing options for a customized analysis.
Concepts and Methodology:
The Price Pressure Indicator utilizes a normalization function and oscillation to quantify market pressure. By calculating the difference between highs and lows, the script provides a nuanced understanding of current market conditions. The smoothing option further refines the analysis, offering traders a comprehensive tool for trend identification.
Explore, experiment, and leverage the power of the Price Pressure Indicator to enhance your trading strategy on TradingView.

Overlay Mini Plot(s) of Correlated Asset(s)Overlay a small plot of a correlated asset of your choosing. Shrink/expand, Set vertical and horizontal position, plot multiple mini-plots via duplicate indicators with varied settings.
Plots the last X bars of any asset; including the live candle currently painting
Useful for low time frame trading when you want to see correlated asset price movement right alongside the price movement you're watching.
Useful for quick and simple comparisons; when you don't want the clutter of split screen or multi-pane view.
Useful for backtesting.
Price scale agnostic; just plots the shape of the recent price action, with several optional labels: Asset+timeframe | Live Price | Highest price over X bars | Lowest price over X bars.
Works fine with all the assets i've tested it on.
~~User inputs~~
-number of bars to paint.
-horizontal offset: plot to right X bars or to left X bars
-vertical offset: shift up or down, shrink or expand; by using 2 'spacer' inputs
-color/transparancy of candles and price labels.
-width (pixels) of candle bodies.
-choose to display price labels or not
-choose to display asset label or not
~~Tips~~
--Add several of these indicators; changing the vertical 'Shift/Shrink' settings on each to visually separate them.
--In the above chart or EurUsd, there are three indicators =>> three mini-plots overlaid: DXY, EurGbp and GbpUsd. Using the following settings for Space Above:Space Below: DXY- 0.1:4.5 | EurGbp- 1.8:1.8 | GbpUsd- 4.5:0.1
--the more you add, the more you'll have to vertically shrink the plots
© twingall

Fair Value Gap / FVG - HTF Orderflow bias / trendCalculates Fair Value Gap (FVG) as a counter and plots it below price.
FVG Counter value resets to +ve or -ve once the FVG counter reverses direction.
Use this script to find a bias to trade with.
Best used on HTF (like 1W, 1D), so the bias can be transferred to LTF (like 4H, 1H).
If you end up using this script, please leave a comment below on how you used it. I can try to incorporate those ideas in an update.
Cheers!

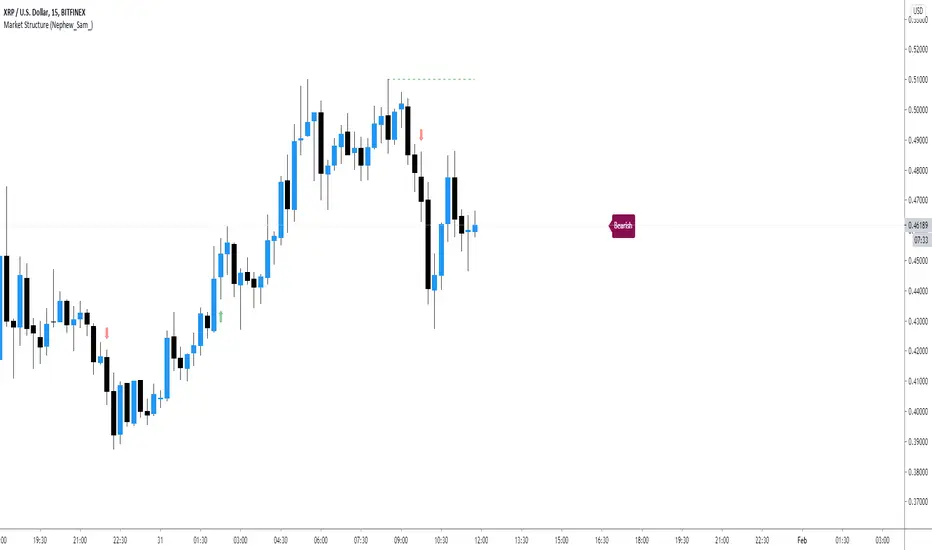
Market Structure (Nephew_Sam_)This indicator consists of 3 features:
1. Plots label to the right for current market structure
2. Plots dashed line to show where the next market structure would be
3. Draws arrows above/below historical market structure breaks
This might get a little to noisy in ranging markets or lower timeframes but it does the job.
Credits to @SimpleCryptoLife for the source code.
This script is take from the indicator "True Market Structure" which is created by the above mentioned user
Copyright rules for reusing the script:
// == COPYRIGHT ==
// Script by @SimpleCrpytoLife. This script is open-source.
// --> If you use ideas from it, you don't need to ask or give credit to me.
// --> If you copy code out of here to adapt for your own script, it must be open-source. You don't need to ask permission, just credit @SimpleCryptoLife.
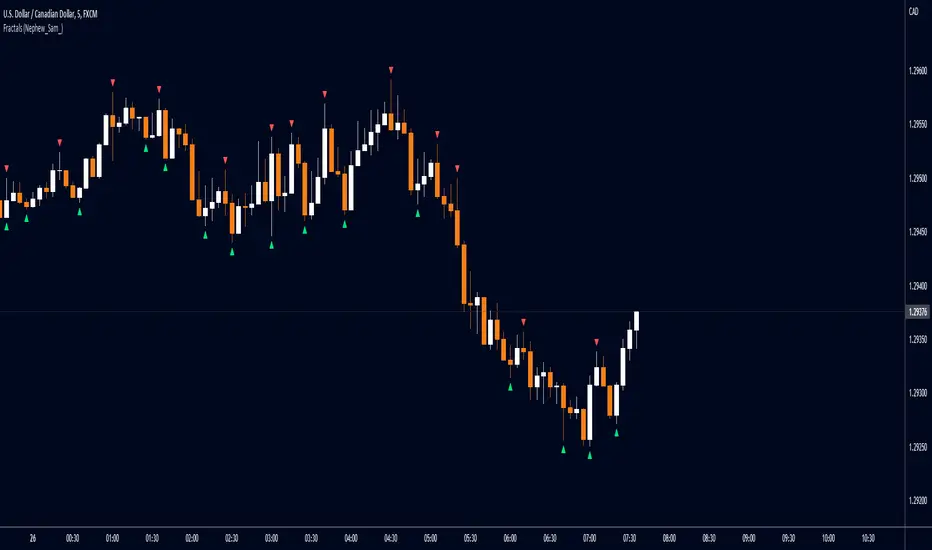
Fractals (Nephew_Sam_)Regular and Williams fractal
1. Plots 3 and 5 bar fractal point
2. Plots significant highs/lows lines
Credits to @RicardoSantos, Code taken from his open source script (V9).