Open Interest Profile (OI)- By LeviathanThis script implements the concept of Open Interest Profile, which can help you analyze the activity of traders and identify the price levels where they are opening/closing their positions. This data can serve as a confluence for finding the areas of support and resistance , targets and placing stop losses. OI profiles can be viewed in the ranges of days, weeks, months, Tokyo sessions, London sessions and New York sessions.
A short introduction to Open Interest
Open Interest is a metric that measures the total amount of open derivatives contracts in a specific market at a given time. A valid contract is formed by both a buyer who opens a long position and a seller who opens a short position. This means that OI represents the total value of all open longs and all open shorts, divided by two. For example, if Open Interest is showing a value of $1B, it means that there is $1B worth of long and $1B worth of short contracts currently open/unsettled in a given market.
OI increasing = new long and short contracts are entering the market
OI decreasing = long and short contracts are exiting the market
OI unchanged = the net amount of positions remains the same (no new entries/exits or just a transfer of contracts occurring)
About this indicator
*This script is basically a modified version of my previous "Market Sessions and Volume Profile by @LeviathanCapital" indicator but this time, profiles are generated from Tradingview Open Interest data instead of volume (+ some other changes).
The usual representation of OI shows Open Interest value and its change based on time (for a particular day, time frame or each given candle). This indicator takes the data and plots it in a way where you can see the OI activity (change in OI) based on price levels. To put it simply, instead of observing WHEN (time) positions are entering/exiting the market, you can now see WHERE (price) positions are entering/exiting the market. This is the same concept as when it comes to Volume and Volume profile and therefore, similar strategies and ways of understanding the given data can be applied here. You can even combine the two to gain an edge (eg. high OI increase + Volume Profile showing dominant market selling = possible aggressive shorts taking place)
Green nodes = OI increase
Red nodes = OI decrease
A cluster of large green nodes can be used for support and resistance levels (*trapped traders theory) or targets (lots of liquidations and stop losses above/below), OI Profile gaps can present an objective for the price to fill them (liquidity gaps, imbalances, inefficiencies, etc), and more.
Indicator settings
1. Session/Lookback - Choose the range from where the OI Profile will be generated
2. OI Profile Mode - Mode 1 (shows only OI increase), Mode 2 (shows both OI increase and decrease), Mode 3 (shows OI decrease on left side and OI increase on the right side).
3. Show OI Value Area - Shows the area where most OI activity took place (useful as a range or S/R level )
4. Show Session Box - Shows the box around chosen sessions/lookback
5. Show Profile - Show/hide OI Profile
6. Show Current Session - Show/hide the ongoing session
7. Show Session Labels - Show/hide the text labels for each session
8. Resolution - The higher the value, the more refined a profile is, but fewer profiles are shown on the chart
9. OI Value Area % - Choose the percentage of VA (same as in Volume Profile's VA)
10. Smooth OI Data - Useful for assets that have very large spikes in OI over large bars, helps create better profiles
11. OI Increase - Pick the color of OI increase nodes in the profile
12. OI Decrease - Pick the color of OI decrease nodes in the profile
13. Value Area Box - Pick the color of the Value Area Box
14. Session Box Thickness - Pick the thickness of the lines surrounding the chosen sessions
Advice
The indicator calculates the profile based on candles - the more candles you can show, the better profile will be formed. This means that it's best to view most sessions on timeframes like 15min or lower. The only exception is the Monthly profile, where timeframes above 15min should be used. Just take a few minutes and switch between timeframes and sessions and you will figure out the optimal settings.
This is the first version of Open Interest Profile script so please understand that it will be improved in future updates.
Thank you for your support.
** Some profile generation elements are inspired by @LonesomeTheBlue's volume profile script
Tìm kiếm tập lệnh với "stop loss"

CHN BUY SELLCHN BUY SELL is formed from two RSI indicators, those are RSI 14 and RSI 7 . I use RSI 14 to determine the trend and RSI 7 to find entry points.
+ Long (BUY) Signal:
- RSI 14 will give a "BUY" signal, then RSI 7 will give entry point to LONG when the candle turns yellow.
+ Short (SELL) Signal:
- RSI 14 will give a "EXIT" signal, then RSI 7 will give entry point to SHORT when the candle turns purple.
+ About Take Profit and Stop Loss:
- With Gold, I usually set Stop Loss and Take Profit at 50 pips
- With currency pairs, I usually keep my Stop Loss and Take Profit at 30 pips
- With crypto, I usually keep Stop Loss and Take Profit at 1.5%
Recommended to use in time frame M15 and above .
This method can be used to trade Forex, Gold and Crypto.
My idea is formed on the view that when the price is moving strongly, the RSI 14 will tell us what the current trend is through a "BUY" or "EXIT" signal. When RSI 14 reaches the oversold area it will form a "BUY" signal and when it reaches the overbought area it will give an "EXIT" signal. I believe that when the price reaches the oversold or overbought area, the price momentum has also decreased and is about to reverse.
After receiving a signal from RSI 14, my job is to wait for an Entry signal from RSI 7. When RSI 7 reaches the overbought area, a yellow candle will appear and that's when we enter a LONG order. When the RSI 7 reaches the oversold area, a purple candle will appear and that's when we enter a SHORT order.

Position Size Calc. (Risk Management Tool)Programmed this tool to help prevent overtrading.
Example of application:
Suppose you want to trade ETHUSDT on a 1 minute chart and you are only willing to risk $10 in one single trade. This way, if you get stopped out, then you will only lose $10. Say you are using ATR based stop loss at 2x current ATR to set the initial stop. All these variables are now fixed, so you must make an adjustment to the size of your position.
Quick illustration: Tolerable loss per trade is $10 , the current ATR of ETHUSDT is $4.06, the size of your stop is $8.12 (4.06*2), then your position size should be 1.2 ETH ($10/$8.12).
This script will constantly monitor the current ATR and display the optimal position size on chart. Tolerable loss (aka "Risk amount") is defined by user in settings. Lines showing the size of SL and TPs on chart are optional, it was added to the script to help users draw the long/short position measuring tools built into TradingView.
Other notes: Always consider market liquidity, size of bid-ask spreads, and the possibilities of gap ups/downs. It can never be guaranteed that stop market/limit orders will get filled at desirable prices. Actual stop losses might differ.

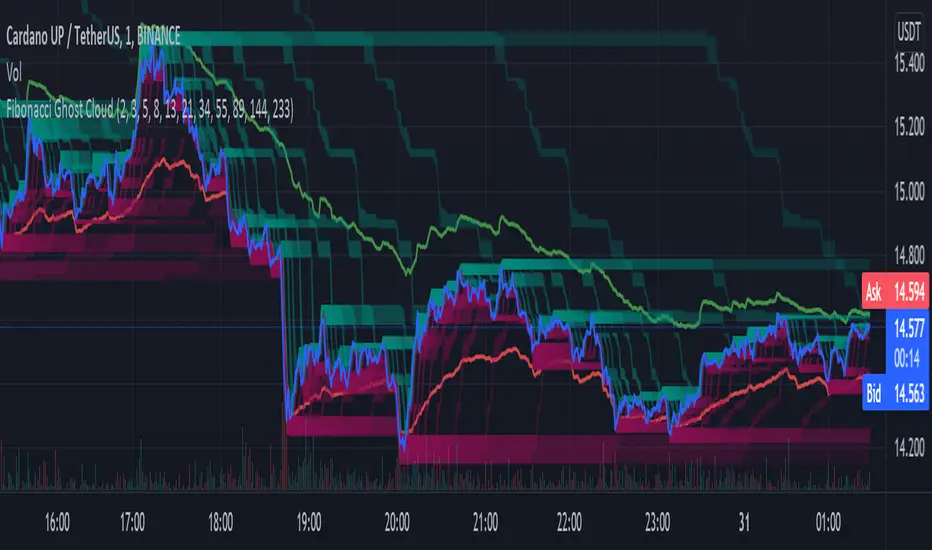
Fibonacci Ghost CloudHello my nocturnal minions.... This is your dark knight in the crypto light.... your alpha and omega, your crypto king reigning wisdom down from my gilded throne of code!
Enjoy the spooky Fibonacci Ghost Cloud. Shadows of previous Fibonacci look-back levels provide possible entries, stop losses, and take profit levels for intrepid crypto travelers.
DESCRIPTION
This indicator is front weighted by using the Fibonacci integer sequence..... 2,3,5,8,13. Each green and red "ghost" is a reflection of the highest highs and lowest lows of a given FIB lookback. The guide lines, red and green, are averages of the highs (green) and the lows (red).
USAGE
The "ghosts" can be used as possible support and resistance levels. They diminish in intensity (they become more transparent) as these ghosts move back further in time. When multiple greens overlap it is an indicator of a lot of recent price action at that level. The same is true of overlapping red.
In addition, the amount of ghosts above and/or below are indicative of recent price action taking place at a higher or a lower level
CURRENT PRICE IS LOWER THAN RECENT PA - There will be many green ghosts above, but few or no red ghosts below.
CURRENT PRICE IS HIGHER THAN RECENT PA- There will be many red ghosts below, but few or no green above
TAKE PROFIT - Possible take profit targets could be on the approach to a previous green level
STOP LOSS - Possible stop losses could be at lower red level
Like Bollinger bands, the green and red "average" lines can help to indicate that a security is oversold or underbought according to how close it is to a recent average. Nearing the red line can indicate that the security is oversold - and the converse is also true.
DERIVATIONS
Within the code is additional greyed-out lines which could be activated allowing you to target the open or close, instead of the High-Low - the current settings
SETTINGS:
You can change the FIB levels and substitute your own integer sequence to use as the lookback.
Feel free to offer feedback and/or suggest features you would like to have added.
XABCD Harmonic Pattern Custom Range Interactive█ OVERVIEW
This indicator was designed based on Harmonic Pattern Book written by Scott Carney. It was simplified to user who may always used tools such as XABCD Pattern and Long Position / Short Position, which consume a lot of time, recommended for both beginner and expert of Harmonic Pattern Traders. XABCD Pattern require tool usage of Magnet tool either Strong Magnet, Week Magnet or none, which cause error or human mistake especially daily practice.
Simplified Guideline by sequence for Harmonic Pattern if using manual tools :
Step 1 : Trade Identification - XABCD Pattern
Step 2 : Trade Execution - Any manual tools of your choice
Step 3 : Trade Management - Position / Short Position
█ INSPIRATION
Inspired by design, code and usage of CAGR. Basic usage of custom range / interactive, pretty much explained here . Credits to TradingView.
I use a lot of XABCD Pattern and Long Position / Short Position, require 5 to 10 minutes on average, upon determine the validity of harmonic pattern.
Upon creating this indicator, I believed that time can be reduced, gain more confidence, reduce error during drawing XABCD, which helps most of harmonic pattern users.
█ FEATURES
Table can positioned by any postion and font size can be resized.
Table can be display through optimized display or manual control.
Validility of harmonic pattern depends on BC ratio.
Harmonic pattern can be displayed fully or optimized while showing BC ratio validity.
Trade Execution at point D can be displayed on / off.
Stop Loss and Take Profit can be calculated automatically or manually.
Optimized table display based extend line setup and profit and loss setup.
Execution zone can be offset to Point C, by default using Point D.
Currency can be show or hide.
Profit and Loss can be displayed on axis once line is extended.
█ HOW TO USE
Step 1 : Trade Identification - Draw points from Point X to Point C. Dont worry about magnet, point will attached depends on High or Low of the candle.
Step 2 : Trade Execution - Check the validity of BC to determine the validity of harmonic pattern generated. Pattern only generate 1 pattern upon success. Otherwise, redraw to other points.
Step 3 : Trade Management - Determine the current candle either reach Point D or Potential Reversal Zone (PRZ). Check for Profit & Loss once reach PRZ.
█ USAGE LIMITATIONS
Harmonic Patterns only limits to patterns mentioned in Harmonic Trading Volume 3 due to other pattern may have other or different philosophy.
Only can be used for Daily timeframe and below due to bar_time is based on minutes by default.
Not recommended for Weekly and Monthly timeframe.
If Point X, A, B, C and D is next to each other, it is recommend to use lower timeframe.
Automated alert is not supported for this release. However, alert can be done manually. Alert will updated on the version.
█ PINE SCRIPT LIMITATIONS
Known bug for when calculate time in array, causing label may not appeared or offset.
Unable to convert to library due to usage of array.get(). I prefer usage for a combination of array.get(id, 0), array.get(id, 1), array.get(id, 2) into custom function, however I faced this issue during make arrays of label. Index can be simply refered as int, for id, i not sure, already try id refered as simple, nothing happens.
linefill.new() will appeared as diamond box if overused.
Text in box.new() unable to use ternary condition or switch to change color. Bgcolor also affected.
Label display is larger than XABCD tool. Hopefully in future, have function to resize label similar to XABCD tools.
█ IMPORTANTS
Trade Management (Profit & Loss) is calculated from Point A to D.
Take Profit is calculated based on ratio 0.382 and 0.618 of Point A to D.
Always check BC validity before proceed to Trade Management.
Length of XABCD is equal to XAB plus BCD, where XAB and BCD are one to one ratio. Length is measured in time.
Use other oscillator to countercheck. Normally use built-in Relative Strength Index (RSI) and Divergence Indicator to determine starting point of Point X and A.
█ HARMONIC PATTERNS SUPPORTED
// Credits to Scott M Carney, author of Harmonic Trading Volume 3: Reaction vs. Reversal
Alt Bat - Page 101
Bat - Page 98
Crab - Page 104
Gartley - Page 92
Butterfly - Page 113
Deep Crab - Page 107
Shark - Page 119 - 220
█ FAQ
Pattern such as 5-0, perfect XABCD and ABCD that not included, will updated on either next version or new release.
Point D time is for approximation only, not including holidays and extended session.
Basic explaination for Harmonic Trading System (Trade Identification, Trade Execution and Trade Management).
Harmonic Patterns values is pretty much summarized here including Stop Loss.
Basic explanation for Alt Bat, Bat, Crab, Gartley, Deep Crab and Butterfly.
█ USAGE / TIPS EXAMPLES (Description explained in each image)

Average Band by HarmanUsually, Moving Averages (Simple & Exponential) consider "close" of each candle to form a line for a particular period. In this indicator, we have considered all the parameters (Open, Close, Low & High) of each candle to form a Band or a wave which act as a zone to provide support & resistance. It works well on all the time frames. It perfectly works on lower time frames of 15 min & 5 min for intraday trades and even for scalping. There is a line that moves very near to candles known as "Candle Line" provide support & resistance to each individual candle and a leading line which moves ahead also acts as support & resistance and helps in determining trend direction.
How to use the indicator ?
Indicator consists of 3 components :
1) A Band or wave of 3 lines (upper, middle & lower line)
2) A "Candle Line" which moves along with the candles
3) A Leading line which moves ahead of the candles
Method 1 : When candles are being formed above the candle line (line near to candles) and it crosses the band or wave from below to upside, then long trade can be initiated. Similarly, When candles are being formed below the Candle line and it crosses the band or wave from upside then short trade can be initiated. Stop loss can be maintained below the band for Long trade and above the band for short trade. Candle line can be used to trail the stop loss.
Method 2: If candles moves above and below of the band very often and frequently and candle line is in the middle of candles then it is NO TRADING ZONE. If you still want to trade, then select a higher time frame and check the price movement. If there is a stability in the higher time frame, then take the trade in the higher timeframe with stable movement.
Method 3 : Candle line acts as "First line of Defence". In a uptrend, all the candles are formed above the candle line and in case of down trend, all the candles are formed below the candle line. When a newly formed candle cross the candle line then you can book profit. For Example : In uptrend , candles are being formed above the line, when a new candle started forming below the line and when the complete candle is formed below the line, profit can be booked. Vice-versa in case of downtrend.
Method 4: Direction of leading line, band and candle line helps in determining the trend. If all these three components are in upward direction, price trend is upward and if all these three components are in downward direction, then price trend is downward. When, leading line and band cross each other from opposite direction for consecutive 2-3 times, then price movement is sideways.
Method 5 : Thickness of band play an important role in determining price action. If band is narrow, it means small candles are being formed and no any huge price movement is observed in this period. When band started expanding, it signifies that big candles are begin to form and there is a more price movement than before. Similarly, If contraction of band started, it means that small candles are being formed and there is low price movement as compared to the price movement when Band was expanded. If Band is expanded (wider) and volumes are high, It means the Band will act as strong Support or Resistance than usual. In case, candles and candle line cross the expanded Band, you can enter the Long or Short trade.
Method 6: When the Band, leading line and candle line collides or meet at a single point, then it is either strong support or resistance.
Method 7 : Usage in Scalping : Select the shorter time frame of 1 min or 5 min. If the candles are crossing the band very frequently in 1 min, then select 5 min time frame or wait for few minutes for stability. Now, when candles started forming above the candle line and it crosses the band from below then take a long position and book profit after few candles above the band. Place stop loss below the Band. Similarly, when candles started forming below the candle line and it crosses the band from above, then enter into short trade and book profit after few candles. Place stop loss above the band in the case of short trade.
You can combine above methods to give a sharp edge to your trade and increase the probability of your winning in the trade.
Indicator Settings : Default period selected is 50 for both the Band and leading line. You can change the period to 26 or 100 or 200. Select the period and check the chart, if the indicator looks fine and smooth, then you can use your settings. For most of the time, default settings work perfectly.
Proudly Developed by :
Harmandeep Singh
Graduate in Computer Science with Physics & Mathematics
MBA in Business Marketing and Finance
Experienced Computer programmer & Software developer
Stock Market & Crypto Trader

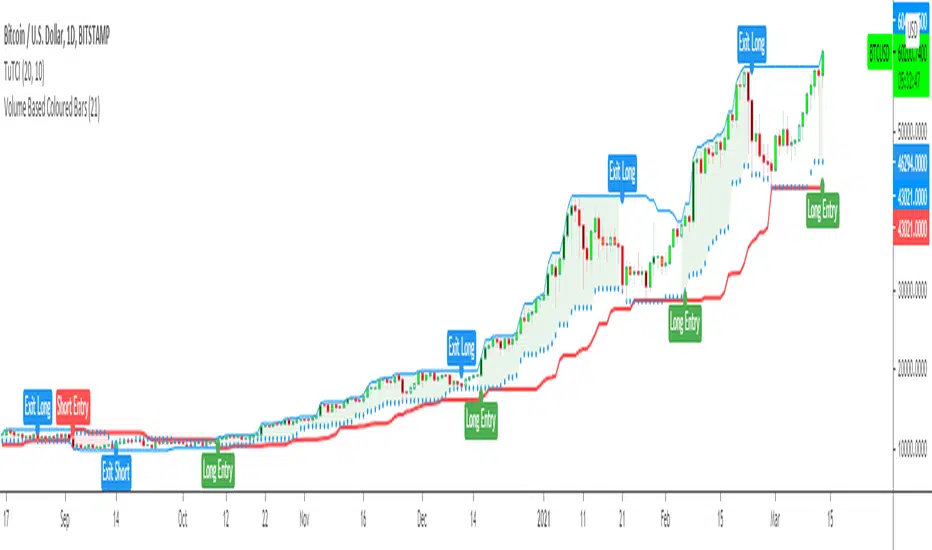
Turtle Trade Channels Indicator TUTCILegendary trade system which proved that great traders can be made, not born.
Turtle Trade Experiment made 80% annual return for 4 years and made 150 million $
Turtle Trade trend following system is a complete opposite to the "buy low and sell high" approach.
This trend following system was taught to a group of average and normal individuals, and almost everyone turned into a profitable trader.
They used the basis logic of well known DONCHIAN CHANNELS which developed by Richard Donchian.
The main rule is "Trade an 20-day breakout and take profits when an 10-day high or low is breached ". Examples:
Buy a 20-day breakout and close the trade when price action reaches a 10-day low.
Go short a 20-day breakout and close the trade when price action reaches a 10-day high.
In this indicator,
The red line is the trading line which indicates the trend directio n:
Price bars over the trend line indicates uptrend
Price bars under the trend line means downtrend
The dotted blue line is the exit line.
Original system is:
Go long when the price High is equal to or above previous 20 day Highest price.
Go short when the price Low is equal to or below previous 20 day Lowest price.
Exit long positions when the price touches the exit line
Exit short positions when the price touches the exit line
Recommended initial stop-loss is ATR * 2 from the opening price.
Default system parameters were 20,10 and 55,20.
Original Turtle Rules:
To trade exactly like the turtles did, you need to set up two indicators representing the main and the failsafe system.
Set up the main indicator with EntryPeriod = 20 and ExitPeriod = 10 (A.k.a S1)
Set up the failsafe indicator with EntryPeriod = 55 and ExitPeriod = 20 using a different color. (A.k.a S2)
The entry strategy using S1 is as follows
Buy 20-day breakouts using S1 only if last signaled trade was a loss.
Sell 20-day breakouts using S1 only if last signaled trade was a loss.
If last signaled trade by S1 was a win, you shouldn't trade -Irregardless of the direction or if you traded last signal it or not-
The entry strategy using S2 is as follows:
Buy 55-day breakouts only if you ignored last S1 signal and the market is rallying without you
Sell 55-day breakouts only if you ignored last S1 signal and the market is pluging without you
You can Highlight the chart with provided trade signals:
Green background color when Long
Red background color when Short
No background color when flat
WARNING: TURTLE TRADE STOP or ADDING more UNITS RULES ARE NOT INCLUDED.
Author: Kıvanç Özbilgiç
Also you can show or hide trade signals with the button on the settings menu
Probability of ATR Index [racer8]Deriving the indicator:
PAI is an indicator I created that tells you the probability of current price moving a specified ATR distance over a specified number of periods into the future. It takes into account 4 variables: the ATR & the standard deviation of price, and the 2 parameters: ATR distance and # bars (time).
The formula is very complex so I will not be able to explain it without confusion arising.
What I can say is that I used integral calculus & the Taylor series to derive a formula that calculates the area under half of the normal distribution function. Thus, the formula was repeated twice in the code to derive the full probability (half + half = whole). If you can read the code, you might be wondering why the formula is so long...
The reason for this is because in Pine Script, the erf function doesn't exist. You see, the formula for normal distribution is: f(x) = (1/sqrt(2pi))*e^(-xx/2), assuming of course that the standard deviation = 1 and mu (mean) = 1. The next step is to take the integral of this formula in order to find the area under f(x). The problem is that I found the integral, F(x), of the normal distribution formula to be equal to F(x) = erf(x/sqrt(2))/2...and the erf function cannot be directly computed into Pinescript.
So I developed a solution...why not estimate the integral function? So that's exactly what I did using a technique involving the Taylor series. The Taylor series is an algebraic function that allows you to create a new function that can estimate the existing function. On a graph, the new function has the same values as the existing one, the only difference is that it uses a differnt formula, in this case, a formula that makes it possible to compute the integral. The disadvantage of using this new formula is that it is super long and if you want it to better represent the original integral over a wider range of x-values, you have to make it longer.
Signal Interpretion:
The hotter the colour, the more likely price will reach your specified distance.
The 2 values of PAI in the bottom window represent probability & average probability of your specifed distance geting hit.
Applications:
Stop loss placement---
This indicator is useful because it gives you an idea of the likelihood that a stop loss at a particular distance away from price (in ATRs) will be hit over a period of time specified. This is helpful in placing stop losses.
Options trading---
PAI can also be used in options trading. For example, you are using a strangle options strategy, and you want to make sure that price stays within the Strangle's profit range. So you only trade when PAI presents a low probability value of moving at a particular distance in ATRs over n periods.
Anyhow, I hope you guys like it. Enjoy! and hit that like button for me :)

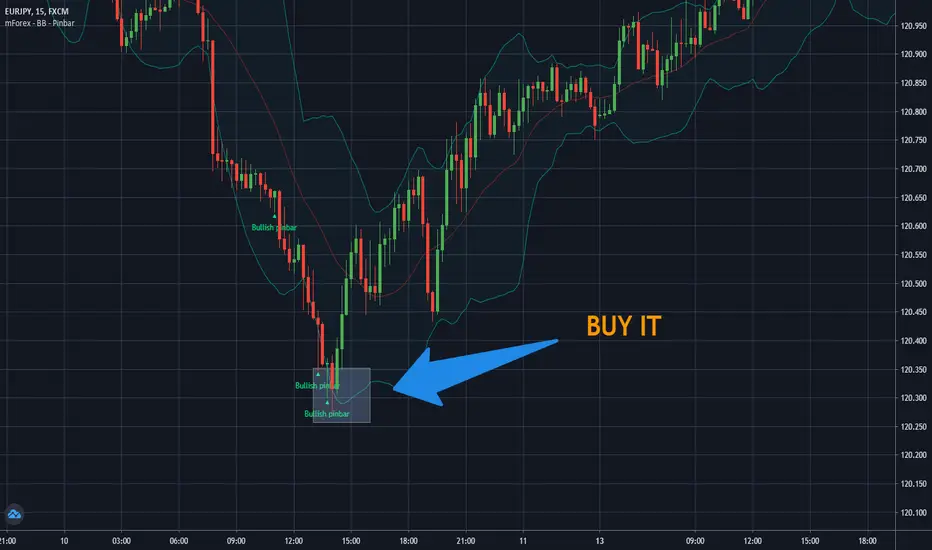
mForex - Bollinger Bands - Pinbar scalping systemTransaction setup parameters
Time frame: M5, M15
Currency pair: Any except XAU/USD
Trading strategies
=== BUY ===
Price break out of the lower Bollinger Bands
The Pinbar reversal candlestick appears and closes the candle on the lower Bollinger Bands
Stop loss: Nearest bottom + 3-5 pips
Profit target: 10-20 pips
=== SELL ===
Price break out of the upper Bollinger Bands
The Pinbar reversal candle appeared and closed below the upper
Stop loss: Nearest peak + 3-5 pips
Profit target: 10-20 pips
* If you have any questions or suggestions for this strategy, feel free to ask us.
Hancock - Pump Catcher [BitMEX] [Alerts]This is a study to the version of the strategy found here .
It generates 3 alerts:
CLOSE - Triggers to close all open positions
LONG - Triggers to open a long position
SHORT - Triggers to open a short position
Commands for alerts (without stop-loss) to get you started:
CLOSE - a=bitmex e=bitmextestnet c=position t=market
LONG - a=bitmex e=bitmextestnet b=long s=xbtusd l=5 q=99% t=market
SHORT - a=bitmex e=bitmextestnet b=short s=xbtusd l=5 q=99% t=market
I would advise including a stop-loss with your commands. These commands are for autoview and don't include a stop loss, use autoview command documentation to add stop-loss.
Happy trading
Hancock

Chandelier Exit V2 by fr3762 KIVANÇChandelier Exit Version 2 with two lines Long Stop and Short Stop
There is a Chandelier exit for long positions and one for short positions. The Chandelier Exit (long) hangs three ATR values below the 22-period high. This means it rises and falls as the period high and the ATR value changes. The Chandelier Exit for short positions is placed three ATR values above the 22-period low. The spreadsheet examples show sample calculations for both.
According to the theory, traders should exit long positions at either the highest high since entry minus 3 ATRs .
Similarly traders should exit short positions at either the lowest low since entry plus 3 ATRs .
Developed by Charles Le Beau and featured in Alexander Elder's books, the Chandelier Exit sets a trailing stop-loss based on the Average True Range (ATR). The indicator is designed to keep traders in a trend and prevent an early exit as long as the trend extends. Typically, the Chandelier Exit will be above prices during a downtrend and below prices during an uptrend.
The author, Chuck LeBeau explains: It lets "... profits run in the direction of a trend while still offering some protection against any reversal in trend."
The exit stop is placed at a multiple of average true ranges from the highest high or highest close since the entry of the trade.
Chandelier Exit will rise instantly whenever new highs are reached. As the highs get higher the stop moves up but it never moves downward.
The Chandelier Exit is mostly used to set a trailing stop-loss during a trend. Trends sometimes extend further than we anticipate and the Chandelier Exit can help traders ride the trend a little longer. Even though it is mostly used for stop-losses, the Chandelier Exit can also be used as a trend tool. A break above the Chandelier Exit (long) signals strength, while a break below the Chandelier Exit (short) signals weakness. Once a new trend begins, chartists can then use the corresponding Chandelier Exit to help define this trend.
Developer: Charles Le Beau
Here's the link to a complete list of all my indicators:
tr.tradingview.com
Şimdiye kadar paylaştığım indikatörlerin tam listesi için: tr.tradingview.com

Position Trdaing Lines (2 entries + live PnL)Position Trading Lines (2 entries + live PnL) is a utility script designed to visually manage a manual position on the chart, with clear TP/SL levels and real-time profit & loss.
The script does not place orders. It is meant to help you simulate / track an existing or planned position.
Features
• Up to 2 trades on the same symbol
• Each trade has:
• Direction: Long / Short
• Position size (lot)
• Entry price
• Take Profit (T.Profit) price
• Stop Loss (S.Loss) price
• Entry shift in bars from the last candle (to align with past or future entries)
• Visual lines on the price chart
• Horizontal line at the entry price
• Horizontal line at Take Profit
• Horizontal line at Stop Loss
• Informative labels
• Entry label showing: direction, size and @ entry price
• TP and SL labels showing:
• T.Profit / S.Loss
• position size
• @ price
• estimated PnL at that level
• If both trades share the same TP or SL price, a single combined label is shown with the total size and total PnL.
• Commissions
• Global commission input (percentage over notional).
• Commission is included in all PnL calculations.
• Live PnL label
• Real-time combined PnL of the active trades, updated on the last bar.
• Color changes with sign (green for profit, red for loss).
• Selective PnL for Trade 2
• Trade 2 has a switch: “Count PnL in total”.
• You can keep Trade 2 visible on the chart but exclude it from the combined PnL until it is actually active.
This tool is useful for discretionary traders who want a clean visual representation of their position, R:R, and projected outcomes directly on the chart, without relying on the broker’s position panel.

Fractal Fade Pro IndicatorA revolutionary contrarian trading indicator that applies chaos theory, fractal mathematics, and market entropy to generate high-probability reverse signals. This indicator fades traditional technical signals, providing BUY signals when conventional indicators say SELL, and SELL signals when they say BUY.
Full Description:
Most traders follow the herd. QFCI does the opposite. It identifies when conventional technical analysis is about to fail by detecting mathematical patterns of exhaustion in market structure.
How It Works (Technical Overview):
The indicator combines three sophisticated mathematical approaches:
Fractal Dimension Analysis: Measures the "roughness" of price movements using fractal mathematics
Market Entropy Calculation: Quantifies the randomness and disorder in price returns using information theory
Phase Space Reconstruction: Analyzes price evolution in multi-dimensional state space from chaos theory
Signal Generation Process:
Step 1: Market Regime Detection
Chaotic Regime: High fractal complexity + rising entropy (avoid trading)
Trending Regime: Low fractal complexity + high phase space distance (fade breakouts)
Mean-Reverting Regime: Very low fractal complexity (fade extremes)
Step 2: Reverse Signal Logic
When traditional indicators would give:
BUY signal (breakout, oversold bounce, volatility spike) → QFCI shows SELL
SELL signal (breakdown, overbought rejection, volatility crash) → QFCI shows BUY
Step 3: Smart Signal Filtering
No consecutive same-direction signals
Adjustable minimum bars between signals
Multiple confirmation layers required
Unique Features:
1. Mathematical Innovation:
Original fractal dimension algorithm (not standard indicators)
Market entropy calculation from information theory
Phase space reconstruction from chaos theory
Multi-regime adaptive logic
2. Trading Psychology Advantage:
Contrarian by design - profits from market overreactions
Fades retail trader mistakes - enters when others are exiting
Reduces overtrading - strict signal frequency controls
3. Clean Visual Interface:
Only BUY/SELL labels - no chart clutter
Clear directional arrows - immediate signal recognition
Built-in alerts - never miss a trade
Recommended Settings:
Default (Balanced Approach):
Fractal Depth: 20
Entropy Period: 200
Min Bars Between Signals: 100
Aggressive Trading:
Fractal Depth: 10-15
Entropy Period: 100-150
Min Bars Between Signals: 50-75
Conservative Trading:
Fractal Depth: 30-40
Entropy Period: 300-400
Min Bars Between Signals: 150-200
Optimal Timeframes:
Primary: Daily, Weekly (best performance)
Secondary: 4-Hour, 12-Hour
Can work on: 1-Hour (with adjusted parameters)
How to Use:
For Beginners:
Apply indicator to chart
Use default settings
Wait for BUY/SELL labels
Enter on next candle open
Use 2:1 risk/reward ratio
Always use stop losses
For Advanced Traders:
Adjust parameters for your trading style
Combine with support/resistance levels
Use volume confirmation
Scale in/out of positions
Track performance by regime
Risk Management Guidelines:
Position Sizing:
Conservative: 1-2% risk per trade
Moderate: 2-3% risk per trade
Aggressive: 3-5% risk per trade (not recommended)
Stop Loss Placement:
BUY signals: Below recent swing low or -2x ATR
SELL signals: Above recent swing high or +2x ATR
Take Profit Targets:
Primary: 2x risk (minimum)
Secondary: Previous support/resistance
Tertiary: Trailing stops after 1.5x risk
IMPORTANT RISK DISCLOSURE
This indicator is for educational and informational purposes only. It is not financial advice. Past performance does not guarantee future results. Trading involves substantial risk of loss and is not suitable for every investor. The risk of loss in trading can be substantial. You should therefore carefully consider whether such trading is suitable for you in light of your financial condition.

Smart MACD Crossover█ OVERVIEW
Smart MACD Crossover is an indicator designed for traders who trade based on MACD line crossovers. It significantly reduces the number of false crossover signals by adding a breakout-box confirmation mechanism. Price must close outside the box created at the moment of the MACD crossover for a signal to trigger. The script also includes optional scaled MACD lines on the price chart, candle coloring, multi-layer “fog” visualization, fully customizable entry signals, automatic Take Profit / Stop Loss levels and a real-time table.
█ CONCEPTS
Standard MACD crossovers frequently produce noise, especially in ranging markets. Smart MACD Crossover attempts to solve this issue: a horizontal box is drawn at the exact bar where the crossover occurs, and a trade signal is generated only when price actually breaks out of that box. By default, the show_only_matching filter is enabled — signals are shown only when the breakout direction matches the original MACD crossover direction (bullish box → long only, bearish box → short only).
█ FEATURES
Fully configurable classic MACD (default 12/26/9)
Optional MACD & Signal lines scaled and plotted directly on the price chart (show_macd_overlay)
Trend-based candle coloring
One-Side Histogram Fog:
- 6 layers above and 6 layers below hl2
- layer height based on average candle size × offset_mult (default 0.7)
- increasing transparency (base 80 + increment 4) for depth effect
- fully customizable colors
Breakout Boxes:
- created on every MACD crossover
- default height = high-low of the signal candle
- optional extension using average candle size × box_multiplier
- semi-transparent fill (85) with colored borders, extended right until breakout
Signals:
- Triangles or “BUY” / “SELL” labels
- show_only_matching filter (enabled by default) — only direction-consistent breakouts generate signals
- when disabled, every box breakout generates a signal according to breakout direction
- Built-in alerts: BUY and SELL
Take Profit / Stop Loss:
- TP1, TP2, TP3 and SL levels drawn automatically after each confirmed signal
- two modes: Candle Multiplier (based on average candle size) or Percentage
- all multipliers/percentages fully adjustable in “Risk Management Settings”
- real-time table in the top-right corner showing current TP/SL prices
█ HOW TO USE
Add via Pine Editor → paste code → Add to Chart.
Settings overview:
- MACD Settings: lengths and source
- Risk Management Settings: TP/SL mode, multipliers/percentages, average candle period
- MACD Overlay Lines: toggle scaled MACD lines on price chart
- Fog: enable/disable, adjust height and transparency
- Visual Settings: candle coloring
- Boxes: optional size multiplier (use_box_multiplier)
- Signals: choose Triangles or Labels, enable/disable direction filter
Signal meaning:
- Triangle below bar / “BUY” label → upward breakout from a box created after bullish MACD crossover
- Triangle above bar / “SELL” label → downward breakout from a box created after bearish MACD crossover
- Open boxes = pending breakout zones
- Fog below price = bullish pressure, fog above price = bearish pressure
█ APPLICATIONS
The indicator reduces false signals coming from plain MACD crossovers. For additional trend confirmation, the scaled MACD lines can be enabled.
Entry into a position is triggered by the BUY/SELL signal generated after the breakout. The TP1–TP3 and SL levels are drawn automatically only for convenience and as a quick reference – they are fully optional and traders can (and usually should) use their own preferred exit strategies, trailing stops, partial closes, or other money-management methods.
█ NOTES
- Due to MACD line scaling onto the price chart, classic MACD divergences cannot be identified

15m ORB + FVG (ChadAnt)Core Logic
The indicator's logic revolves around three main phases:
1. Defining the 15-Minute Opening Range (ORB)
The script calculates the highest high (rangeHigh) and lowest low (rangeLow) that occurred during the first 15 minutes of the trading day.
This time window is defined by the sessionStr input, which defaults to 0930-0945 (exchange time).
The high and low of this range are plotted as small gray dots once the session ends (rangeSet = true).
2. Identifying a Fair Value Gap (FVG) Setup
After the 15-minute range is set, the indicator waits for a breakout of either the range high or range low.
A "Strict FVG breakout" requires two conditions on the first candle that closes beyond the range:
The candle before the breakout candle ( bars ago) must have been inside the range.
The breakout candle ( bar ago) must have closed outside the range.
A Fair Value Gap (FVG) must form on the most recent three candles (the current bar and the two previous bars).
Bullish FVG (Long Setup): The low of the current bar (low) is greater than the high of the bar two periods prior (high ). This FVG represents a price inefficiency that the trade expects to fill.
Bearish FVG (Short Setup): The high of the current bar (high) is less than the low of the bar two periods prior (low ).
If a valid FVG setup occurs, the indicator marks a pending setup and draws a colored box to highlight the FVG area (Green for Bullish FVG, Red for Bearish FVG).
3. Trade Entry and Management
If a pending setup is identified, the trade is structured as a re-entry trade into the FVG zone:
Entry Price: Set at the outer boundary of the FVG, which is the low of the current bar for a Long setup, or the high of the current bar for a Short setup.
Stop Loss (SL): Set at the opposite boundary of the FVG, which is the low for a Long setup, or the high for a Short setup.
The trade is triggered (tradeActive = true) once the price retraces to the pendingEntry level.
Risk/Reward (RR) Targets: Three Take Profit (TP) levels are calculated based on the distance between the Entry and Stop Loss:
$$\text{Risk} = | \text{Entry} - \text{SL} |$$
$$\text{TP}n = \text{Entry} \pm (\text{Risk} \times \text{RR}n)$$
where $n$ is 1, 2, or 3, corresponding to the input $\text{RR}1$, $\text{RR}2$, and $\text{RR}3$ values (defaults: 1.0, 1.5, and 2.0).
Trade Lines: Upon triggering, lines for the Entry, Stop Loss, and three Take Profit levels are drawn on the chart for a specified length (lineLength).
A crucial feature is the directional lock (highBroken / lowBroken):
If the price breaks a range level (e.g., simpleBrokeHigh) but without a valid FVG setup, the corresponding directional flag (e.g., highBroken) is set to true permanently for the day.
This prevents the indicator from looking for any subsequent trade setups in that direction for the rest of the day, suggesting that the initial move, without an FVG, exhausted the opportunity.

COT IndexTHE HIDDEN INTELLIGENCE IN FUTURES MARKETS
What if you could see what the smartest players in the futures markets are doing before the crowd catches on? While retail traders chase momentum indicators and moving averages, obsess over Japanese candlestick patterns, and debate whether the RSI should be set to fourteen or twenty-one periods, institutional players leave footprints in the sand through their mandatory reporting to the Commodity Futures Trading Commission. These footprints, published weekly in the Commitment of Traders reports, have been hiding in plain sight for decades, available to anyone with an internet connection, yet remarkably few traders understand how to interpret them correctly. The COT Index indicator transforms this raw institutional positioning data into actionable trading signals, bringing Wall Street intelligence to your trading screen without requiring expensive Bloomberg terminals or insider connections.
The uncomfortable truth is this: Most retail traders operate in a binary world. Long or short. Buy or sell. They apply technical analysis to individual positions, constrained by limited capital that forces them to concentrate risk in single directional bets. Meanwhile, institutional traders operate in an entirely different dimension. They manage portfolios dynamically weighted across multiple markets, adjusting exposure based on evolving market conditions, correlation shifts, and risk assessments that retail traders never see. A hedge fund might be simultaneously long gold, short oil, neutral on copper, and overweight agricultural commodities, with position sizes calibrated to volatility and portfolio Greeks. When they increase gold exposure from five percent to eight percent of portfolio allocation, this rebalancing decision reflects sophisticated analysis of opportunity cost, risk parity, and cross-market dynamics that no individual chart pattern can capture.
This portfolio reweighting activity, multiplied across hundreds of institutional participants, manifests in the aggregate positioning data published weekly by the CFTC. The Commitment of Traders report does not show individual trades or strategies. It shows the collective footprint of how actual commercial hedgers and large speculators have allocated their capital across different markets. When mining companies collectively increase forward gold sales to hedge thirty percent more production than last quarter, they are not reacting to a moving average crossover. They are making strategic allocation decisions based on production forecasts, cost structures, and price expectations derived from operational realities invisible to outside observers. This is portfolio management in action, revealed through positioning data rather than price charts.
If you want to understand how institutional capital actually flows, how sophisticated traders genuinely position themselves across market cycles, the COT report provides a rare window into that hidden world. But understand what you are getting into. This is not a tool for scalpers seeking confirmation of the next five-minute move. This is not an oscillator that flashes oversold at market bottoms with convenient precision. COT analysis operates on a timescale measured in weeks and months, revealing positioning shifts that precede major market turns but offer no precision timing. The data arrives three days stale, published only once per week, capturing strategic positioning rather than tactical entries.
If you need instant gratification, if you trade intraday moves, if you demand mechanical signals with ninety percent accuracy, close this document now. COT analysis rewards patience, position sizing discipline, and tolerance for being early. It punishes impatience, overleveraging, and the expectation that any single indicator can substitute for market understanding.
The premise is deceptively simple. Every Tuesday, large traders in futures markets must report their positions to the CFTC. By Friday afternoon, this data becomes public. Academic research spanning three decades has consistently shown that not all market participants are created equal. Some traders consistently profit while others consistently lose. Some anticipate major turning points while others chase trends into exhaustion. Bessembinder and Chan (1992) demonstrated in their seminal study that commercial hedgers, those with actual exposure to the underlying commodity or financial instrument, possess superior forecasting ability compared to speculators. Their research, published in the Journal of Finance, found statistically significant predictive power in commercial positioning, particularly at extreme levels. This finding challenged the efficient market hypothesis and opened the door to a new approach to market analysis based on positioning rather than price alone.
Think about what this means. Every week, the government publishes a report showing you exactly how the most informed market participants are positioned. Not their opinions. Not their predictions. Their actual money at risk. When agricultural producers collectively hold their largest short hedge in five years, they are not making idle speculation. They are locking in prices for crops they will harvest, informed by private knowledge of weather conditions, soil quality, inventory levels, and demand expectations invisible to outside observers. When energy companies aggressively hedge forward production at current prices, they reveal information about expected supply that no analyst report can capture. This is not technical analysis based on past prices. This is not fundamental analysis based on publicly available data. This is behavioral analysis based on how the smartest money is actually positioned, how institutions allocate capital across portfolios, and how those allocation decisions shift as market conditions evolve.
WHY SOME TRADERS KNOW MORE THAN OTHERS
Building on this foundation, Sanders, Boris and Manfredo (2004) conducted extensive research examining the behaviour patterns of different trader categories. Their work, which analyzed over a decade of COT data across multiple commodity markets, revealed a fascinating dynamic that challenges much of what retail traders are taught. Commercial hedgers consistently positioned themselves against market extremes, buying when speculators were most bearish and selling when speculators reached peak bullishness. The contrarian positioning of commercials was not random noise but rather reflected their superior information about supply and demand fundamentals. Meanwhile, large speculators, primarily hedge funds and commodity trading advisors, exhibited strong trend-following behaviour that often amplified market moves beyond fundamental values. Small traders, the retail participants, consistently entered positions late in trends, frequently near turning points, making them reliable contrary indicators.
Wang (2003) extended this research by demonstrating that the predictive power of commercial positioning varies significantly across different commodity sectors. His analysis of agricultural commodities showed particularly strong forecasting ability, with commercial net positions explaining up to fifteen percent of return variance in subsequent weeks. This finding suggests that the informational advantages of hedgers are most pronounced in markets where physical supply and demand fundamentals dominate, as opposed to purely financial markets where information asymmetries are smaller. When a corn farmer hedges six months of expected harvest, that decision incorporates private observations about rainfall patterns, crop health, pest pressure, and local storage capacity that no distant analyst can match. When an oil refinery hedges crude oil purchases and gasoline sales simultaneously, the spread relationships reveal expectations about refining margins that reflect operational realities invisible in public data.
The theoretical mechanism underlying these empirical patterns relates to information asymmetry and different participant motivations. Commercial hedgers engage in futures markets not for speculative profit but to manage business risks. An agricultural producer selling forward six months of expected harvest is not making a bet on price direction but rather locking in revenue to facilitate financial planning and ensure business viability. However, this hedging activity necessarily incorporates private information about expected supply, inventory levels, weather conditions, and demand trends that the hedger observes through their commercial operations (Irwin and Sanders, 2012). When aggregated across many participants, this private information manifests in collective positioning.
Consider a gold mining company deciding how much forward production to hedge. Management must estimate ore grades, recovery rates, production costs, equipment reliability, labor availability, and dozens of other operational variables that determine whether locking in prices at current levels makes business sense. If the industry collectively hedges more aggressively than usual, it suggests either exceptional production expectations or concern about sustaining current price levels or combination of both. Either way, this positioning reveals information unavailable to speculators analyzing price charts and economic data. The hedger sees the physical reality behind the financial abstraction.
Large speculators operate under entirely different incentives and constraints. Commodity Trading Advisors managing billions in assets typically employ systematic, trend-following strategies that respond to price momentum rather than fundamental supply and demand. When crude oil rallies from sixty dollars to seventy dollars per barrel, these systems generate buy signals. As the rally continues to eighty dollars, position sizes increase. The strategy works brilliantly during sustained trends but becomes a liability at reversals. By the time oil reaches ninety dollars, trend-following funds are maximally long, having accumulated positions progressively throughout the rally. At this point, they represent not smart money anticipating further gains but rather crowded money vulnerable to reversal. Sanders, Boris and Manfredo (2004) documented this pattern across multiple energy markets, showing that extreme speculator positioning typically marked late-stage trend exhaustion rather than early-stage trend development.
Small traders, the retail participants who fall below reporting thresholds, display the weakest forecasting ability. Wang (2003) found that small trader positioning exhibited negative correlation with subsequent returns, meaning their aggregate positioning served as a reliable contrary indicator. The explanation combines several factors. Retail traders often lack the capital reserves to weather normal market volatility, leading to premature exits from positions that would eventually prove profitable. They tend to receive information through slower channels, entering trends after mainstream media coverage when institutional participants are preparing to exit. Perhaps most importantly, they trade with emotion, buying into euphoria and selling into panic at precisely the wrong times.
At major turning points, the three groups often position opposite each other with commercials extremely bearish, large speculators extremely bullish, and small traders piling into longs at the last moment. These high-divergence environments frequently precede increased volatility and trend reversals. The insiders with business exposure quietly exit as the momentum traders hit maximum capacity and retail enthusiasm peaks. Within weeks, the reversal begins, and positions unwind in the opposite sequence.
FROM RAW DATA TO ACTIONABLE SIGNALS
The COT Index indicator operationalizes these academic findings into a practical trading tool accessible through TradingView. At its core, the indicator normalizes net positioning data onto a zero to one hundred scale, creating what we call the COT Index. This normalization is critical because absolute position sizes vary dramatically across different futures contracts and over time. A commercial trader holding fifty thousand contracts net long in crude oil might be extremely bullish by historical standards, or it might be quite neutral depending on the context of total market size and historical ranges. Raw position numbers mean nothing without context. The COT Index solves this problem by calculating where current positioning stands relative to its range over a specified lookback period, typically two hundred fifty-two weeks or approximately five years of weekly data.
The mathematical transformation follows the methodology originally popularized by legendary trader Larry Williams, though the underlying concept appears in statistical normalization techniques across many fields. For any given trader category, we calculate the highest and lowest net position values over the lookback period, establishing the historical range for that specific market and trader group. Current positioning is then expressed as a percentage of this range, where zero represents the most bearish positioning ever seen in the lookback window and one hundred represents the most bullish extreme. A reading of fifty indicates positioning exactly in the middle of the historical range, suggesting neither extreme optimism nor pessimism relative to recent history (Williams and Noseworthy, 2009).
This index-based approach allows for meaningful comparison across different markets and time periods, overcoming the scaling problems inherent in analyzing raw position data. A commercial index reading of eighty-five in gold carries the same interpretive meaning as an eighty-five reading in wheat or crude oil, even though the absolute position sizes differ by orders of magnitude. This standardization enables systematic analysis across entire futures portfolios rather than requiring market-specific expertise for each contract.
The lookback period selection involves a fundamental tradeoff between responsiveness and stability. Shorter lookback periods, perhaps one hundred twenty-six weeks or approximately two and a half years, make the index more sensitive to recent positioning changes. However, it also increases noise and produces more false signals. Longer lookback periods, perhaps five hundred weeks or approximately ten years, create smoother readings that filter short-term noise but become slower to recognize regime changes. The indicator settings allow users to adjust this parameter based on their trading timeframe, risk tolerance, and market characteristics.
UNDERSTANDING CFTC DATA STRUCTURES
The indicator supports both Legacy and Disaggregated COT report formats, reflecting the evolution of CFTC reporting standards over decades of market development. Legacy reports categorize market participants into three broad groups: commercial traders (hedgers with underlying business exposure), non-commercial traders (large speculators seeking profit without commercial interest), and non-reportable traders (small speculators below reporting thresholds). Each category brings distinct motivations and information advantages to the market (CFTC, 2020).
The Disaggregated reports, introduced in September 2009 for physical commodity markets, provide finer granularity by splitting participants into five categories (CFTC, 2009). Producer and merchant positions capture those actually producing, processing, or merchandising the physical commodity. Swap dealers represent financial intermediaries facilitating derivative transactions for clients. Managed money includes commodity trading advisors and hedge funds executing systematic or discretionary strategies. Other reportables encompasses diverse participants not fitting the main categories. Small traders remain as the fifth group, representing retail participation.
This enhanced categorization reveals nuances invisible in Legacy reports, particularly distinguishing between different types of institutional capital and their distinct behavioural patterns. The indicator automatically detects which report type is appropriate for each futures contract and adjusts the display accordingly.
Importantly, Disaggregated reports exist only for physical commodity futures. Agricultural commodities like corn, wheat, and soybeans have Disaggregated reports because clear producer, merchant, and swap dealer categories exist. Energy commodities like crude oil and natural gas similarly have well-defined commercial hedger categories. Metals including gold, silver, and copper also receive Disaggregated treatment (CFTC, 2009). However, financial futures such as equity index futures, Treasury bond futures, and currency futures remain available only in Legacy format. The CFTC has indicated no plans to extend Disaggregated reporting to financial futures due to different market structures and participant categories in these instruments (CFTC, 2020).
THE BEHAVIORAL FOUNDATION
Understanding which trader perspective to follow requires appreciation of their distinct trading styles, success rates, and psychological profiles. Commercial hedgers exhibit anticyclical behaviour rooted in their fundamental knowledge and business imperatives. When agricultural producers hedge forward sales during harvest season, they are not speculating on price direction but rather locking in revenue for crops they will harvest. Their business requires converting volatile commodity exposure into predictable cash flows to facilitate planning and ensure survival through difficult periods. Yet their aggregate positioning reveals valuable information because these hedging decisions incorporate private information about supply conditions, inventory levels, weather observations, and demand expectations that hedgers observe through their commercial operations (Bessembinder and Chan, 1992).
Consider a practical example from energy markets. Major oil companies continuously hedge portions of forward production based on price levels, operational costs, and financial planning needs. When crude oil trades at ninety dollars per barrel, they might aggressively hedge the next twelve months of production, locking in prices that provide comfortable profit margins above their extraction costs. This hedging appears as short positioning in COT reports. If oil rallies further to one hundred dollars, they hedge even more aggressively, viewing these prices as exceptional opportunities to secure revenue. Their short positioning grows increasingly extreme. To an outside observer watching only price charts, the rally suggests bullishness. But the commercial positioning reveals that the actual producers of oil find these prices attractive enough to lock in years of sales, suggesting skepticism about sustaining even higher levels. When the eventual reversal occurs and oil declines back to eighty dollars, the commercials who hedged at ninety and one hundred dollars profit while speculators who chased the rally suffer losses.
Large speculators or managed money traders operate under entirely different incentives and constraints. Their systematic, momentum-driven strategies mean they amplify existing trends rather than anticipate reversals. Trend-following systems, the most common approach among large speculators, by definition require confirmation of trend through price momentum before entering positions (Sanders, Boris and Manfredo, 2004). When crude oil rallies from sixty dollars to eighty dollars per barrel over several months, trend-following algorithms generate buy signals based on moving average crossovers, breakouts, and other momentum indicators. As the rally continues, position sizes increase according to the systematic rules.
However, this approach becomes a liability at turning points. By the time oil reaches ninety dollars after a sustained rally, trend-following funds are maximally long, having accumulated positions progressively throughout the move. At this point, their positioning does not predict continued strength. Rather, it often marks late-stage trend exhaustion. The psychological and mechanical explanation is straightforward. Trend followers by definition chase price momentum, entering positions after trends establish rather than anticipating them. Eventually, they become fully invested just as the trend nears completion, leaving no incremental buying power to sustain the rally. When the first signs of reversal appear, systematic stops trigger, creating a cascade of selling that accelerates the downturn.
Small traders consistently display the weakest track record across academic studies. Wang (2003) found that small trader positioning exhibited negative correlation with subsequent returns in his analysis across multiple commodity markets. This result means that whatever small traders collectively do, the opposite typically proves profitable. The explanation for small trader underperformance combines several factors documented in behavioral finance literature. Retail traders often lack the capital reserves to weather normal market volatility, leading to premature exits from positions that would eventually prove profitable. They tend to receive information through slower channels, learning about commodity trends through mainstream media coverage that arrives after institutional participants have already positioned. Perhaps most importantly, retail traders are more susceptible to emotional decision-making, buying into euphoria and selling into panic at precisely the wrong times (Tharp, 2008).
SETTINGS, THRESHOLDS, AND SIGNAL GENERATION
The practical implementation of the COT Index requires understanding several key features and settings that users can adjust to match their trading style, timeframe, and risk tolerance. The lookback period determines the time window for calculating historical ranges. The default setting of two hundred fifty-two bars represents approximately one year on daily charts or five years on weekly charts, balancing responsiveness with stability. Conservative traders seeking only the most extreme, highest-probability signals might extend the lookback to five hundred bars or more. Aggressive traders seeking earlier entry and willing to accept more false positives might reduce it to one hundred twenty-six bars or even less for shorter-term applications.
The bullish and bearish thresholds define signal generation levels. Default settings of eighty and twenty respectively reflect academic research suggesting meaningful information content at these extremes. Readings above eighty indicate positioning in the top quintile of the historical range, representing genuine extremes rather than temporary fluctuations. Conversely, readings below twenty occupy the bottom quintile, indicating unusually bearish positioning (Briese, 2008).
However, traders must recognize that appropriate thresholds vary by market, trader category, and personal risk tolerance. Some futures markets exhibit wider positioning swings than others due to seasonal patterns, volatility characteristics, or participant behavior. Conservative traders seeking high-probability setups with fewer signals might raise thresholds to eighty-five and fifteen. Aggressive traders willing to accept more false positives for earlier entry could lower them to seventy-five and twenty-five.
The key is maintaining meaningful differentiation between bullish, neutral, and bearish zones. The default settings of eighty and twenty create a clear three-zone structure. Readings from zero to twenty represent bearish territory where the selected trader group holds unusually bearish positions. Readings from twenty to eighty represent neutral territory where positioning falls within normal historical ranges. Readings from eighty to one hundred represent bullish territory where the selected trader group holds unusually bullish positions.
The trading perspective selection determines which participant group the indicator follows, fundamentally shaping interpretation and signal meaning. For counter-trend traders seeking reversal opportunities, monitoring commercial positioning makes intuitive sense based on the academic research discussed earlier. When commercials reach extreme bearish readings below twenty, indicating unprecedented short positioning relative to recent history, they are effectively betting against the crowd. Given their informational advantages demonstrated by Bessembinder and Chan (1992), this contrarian stance often precedes major bottoms.
Trend followers might instead monitor large speculator positioning, but with inverted logic compared to commercials. When managed money reaches extreme bullish readings above eighty, the trend may be exhausting rather than accelerating. This seeming paradox reflects their late-cycle participation documented by Sanders, Boris and Manfredo (2004). Sophisticated traders thus use speculator extremes as fade signals, entering positions opposite to speculator consensus.
Small trader monitoring serves primarily as a contrary indicator for all trading styles. Extreme small trader bullishness above seventy-five or eighty typically warns of retail FOMO at market tops. Extreme small trader bearishness below twenty or twenty-five often marks capitulation bottoms where the last weak hands have sold.
VISUALIZATION AND USER INTERFACE
The visual design incorporates multiple elements working together to facilitate decision-making and maintain situational awareness during active trading. The primary COT Index line plots in bold with adjustable line width, defaulting to two pixels for clear visibility against busy price charts. An optional glow effect, controlled by a simple toggle, adds additional visual prominence through multiple plot layers with progressively increasing transparency and width.
A twenty-one period exponential moving average overlays the index line, providing trend context for positioning changes. When the index crosses above its moving average, it signals accelerating bullish sentiment among the selected trader group regardless of whether absolute positioning is extreme. Conversely, when the index crosses below its moving average, it signals deteriorating sentiment and potentially the beginning of a reversal in positioning trends.
The EMA provides a dynamic reference line for assessing positioning momentum. When the index trades far above its EMA, positioning is not only extreme in absolute terms but also building with momentum. When the index trades far below its EMA, positioning is contracting or reversing, which may indicate weakening conviction even if absolute levels remain elevated.
The data table positioned at the top right of the chart displays eleven metrics for each trader category, transforming the indicator from a simple index calculation into an analytical dashboard providing multidimensional market intelligence. Beyond the COT Index itself, users can monitor positioning extremity, which measures how unusual current levels are compared to historical norms using statistical techniques. The extremity metric clarifies whether a reading represents the ninety-fifth or ninety-ninth percentile, with values above two standard deviations indicating genuinely exceptional positioning.
Market power quantifies each group's influence on total open interest. This metric expresses each trader category's net position as a percentage of total market open interest. A commercial entity holding forty percent of total open interest commands significantly more influence than one holding five percent, making their positioning signals more meaningful.
Momentum and rate of change metrics reveal whether positions are building or contracting, providing early warning of potential regime shifts. Position velocity measures the rate of change in positioning changes, effectively a second derivative providing even earlier insight into inflection points.
Sentiment divergence highlights disagreements between commercial and speculative positioning. This metric calculates the absolute difference between normalized commercial and large speculator index values. Wang (2003) found that these high-divergence environments frequently preceded increased volatility and reversals.
The table also displays concentration metrics when available, showing how positioning is distributed among the largest handful of traders in each category. High concentration indicates a few dominant players controlling most of the positioning, while low concentration suggests broad-based participation across many traders.
THE ALERT SYSTEM AND MONITORING
The alert system, comprising five distinct alert conditions, enables systematic monitoring of dozens of futures markets without constant screen watching. The bullish and bearish COT signal alerts trigger when the index crosses user-defined thresholds, indicating the selected trader group has reached extreme positioning worthy of attention. These alerts fire in real-time as new weekly COT data publishes, typically Friday afternoon following the Tuesday measurement date.
Extreme positioning alerts fire at ninety and ten index levels, representing the top and bottom ten percent of the historical range, warning of particularly stretched readings that historically precede reversals with high probability. When commercials reach a COT Index reading below ten, they are expressing their most bearish stance in the entire lookback period.
The data staleness alert notifies users when COT reports have not updated for more than ten days, preventing reliance on outdated information for trading decisions. Government shutdowns or federal holidays can interrupt the normal Friday publication schedule. Using stale signals while believing them current creates dangerous false confidence.
The indicator's watermark information display positioned in the bottom right corner provides essential context at a glance. This persistent display shows the symbol and timeframe, the COT report date timestamp, days since last update, and the current signal state. A trader analyzing a potential short entry in crude oil can glance at the watermark to instantly confirm positioning context without interrupting analysis flow.
LIMITATIONS AND REALISTIC EXPECTATIONS
Practical application requires understanding both the indicator's considerable strengths and inherent limitations. COT data inherently lags price action by three days, as Tuesday positions are not published until Friday afternoon. This delay means the indicator cannot catch rapid intraday reversals or respond to surprise news events. Traders using the COT Index for timing entries must accept this latency and focus on swing trading and position trading timeframes where three-day lags matter less than in day trading or scalping.
The weekly publication schedule similarly makes the indicator unsuitable for short-term trading strategies requiring immediate feedback. The COT Index works best for traders operating on weekly or longer timeframes, where positioning shifts measured in weeks and months align with trading horizon.
Extreme COT readings can persist far longer than typical technical indicators suggest, testing the patience and capital reserves of traders attempting to fade them. When crude oil enters a sustained bull market driven by genuine supply disruptions, commercial hedgers may maintain bearish positioning for many months as prices grind higher. A commercial COT Index reading of fifteen indicating extreme bearishness might persist for three months while prices continue rallying before finally reversing. Traders without sufficient capital and risk tolerance to weather such drawdowns will exit prematurely, precisely when the signal is about to work (Irwin and Sanders, 2012).
Position sizing discipline becomes paramount when implementing COT-based strategies. Rather than risking large percentages of capital on individual signals, successful COT traders typically allocate modest position sizes across multiple signals, allowing some to take time to mature while others work more quickly.
The indicator also cannot overcome fundamental regime changes that alter the structural drivers of markets. If gold enters a true secular bull market driven by monetary debasement, commercial hedgers may remain persistently bearish as mining companies sell forward years of production at what they perceive as favorable prices. Their positioning indicates valuation concerns from a production cost perspective, but cannot stop prices from rising if investment demand overwhelms physical supply-demand balance.
Similarly, structural changes in market participation can alter the meaning of positioning extremes. The growth of commodity index investing in the two thousands brought massive passive long-only capital into futures markets, fundamentally changing typical positioning ranges. Traders relying on COT signals without recognizing this regime change would have generated numerous false bearish signals during the commodity supercycle from 2003 to 2008.
The research foundation supporting COT analysis derives primarily from commodity markets where the commercial hedger information advantage is most pronounced. Studies specifically examining financial futures like equity indices and bonds show weaker but still present effects. Traders should calibrate expectations accordingly, recognizing that COT analysis likely works better for crude oil, natural gas, corn, and wheat than for the S&P 500, Treasury bonds, or currency futures.
Another important limitation involves the reporting threshold structure. Not all market participants appear in COT data, only those holding positions above specified minimums. In markets dominated by a few large players, concentration metrics become critical for proper interpretation. A single large trader accounting for thirty percent of commercial positioning might skew the entire category if their individual circumstances are idiosyncratic rather than representative.
GOLD FUTURES DURING A HYPOTHETICAL MARKET CYCLE
Consider a practical example using gold futures during a hypothetical but realistic market scenario that illustrates how the COT Index indicator guides trading decisions through a complete market cycle. Suppose gold has rallied from fifteen hundred to nineteen hundred dollars per ounce over six months, driven by inflation concerns following aggressive monetary expansion, geopolitical uncertainty, and sustained buying by Asian central banks for reserve diversification.
Large speculators, operating primarily trend-following strategies, have accumulated increasingly bullish positions throughout this rally. Their COT Index has climbed progressively from forty-five to eighty-five. The table display shows that large speculators now hold net long positions representing thirty-two percent of total open interest, their highest in four years. Momentum indicators show positive readings, indicating positions are still building though at a decelerating rate. Position velocity has turned negative, suggesting the pace of position building is slowing.
Meanwhile, commercial hedgers have responded to the rally by aggressively selling forward production and inventory. Their COT Index has moved inversely to price, declining from fifty-five to twenty. This bearish commercial positioning represents mining companies locking in forward sales at prices they view as attractive relative to production costs. The table shows commercials now hold net short positions representing twenty-nine percent of total open interest, their most bearish stance in five years. Concentration metrics indicate this positioning is broadly distributed across many commercial entities, suggesting the bearish stance reflects collective industry view rather than idiosyncratic positioning by a single firm.
Small traders, attracted by mainstream financial media coverage of gold's impressive rally, have recently piled into long positions. Their COT Index has jumped from forty-five to seventy-eight as retail investors chase the trend. Television financial networks feature frequent segments on gold with bullish guests. Internet forums and social media show surging retail interest. This retail enthusiasm historically marks late-stage trend development rather than early opportunity.
The COT Index indicator, configured to monitor commercial positioning from a contrarian perspective, displays a clear bearish signal given the extreme commercial short positioning. The table displays multiple confirming metrics: positioning extremity shows commercials at the ninety-sixth percentile of bearishness, market power indicates they control twenty-nine percent of open interest, and sentiment divergence registers sixty-five, indicating massive disagreement between commercial hedgers and large speculators. This divergence, the highest in three years, places the market in the historically high-risk category for reversals.
The interpretation requires nuance and consideration of context beyond just COT data. Commercials are not necessarily predicting an imminent crash. Rather, they are hedging business operations at what they collectively view as favorable price levels. However, the data reveals they have sold unusually large quantities of forward production, suggesting either exceptional production expectations for the year ahead or concern about sustaining current price levels or combination of both. Combined with extreme speculator positioning indicating a crowded long trade, and small trader enthusiasm confirming retail FOMO, the confluence suggests elevated reversal risk even if the precise timing remains uncertain.
A prudent trader analyzing this situation might take several actions based on COT Index signals. Existing long positions could be tightened with closer stop losses. Profit-taking on a portion of long exposure could lock in gains while maintaining some participation. Some traders might initiate modest short positions as portfolio hedges, sizing them appropriately for the inherent uncertainty in timing reversals. Others might simply move to the sidelines, avoiding new long entries until positioning normalizes.
The key lesson from case study analysis is that COT signals provide probabilistic edges rather than deterministic predictions. They work over many observations by identifying higher-probability configurations, not by generating perfect calls on individual trades. A fifty-five percent win rate with proper risk management produces substantial profits over time, yet still means forty-five percent of signals will be premature or wrong. Traders must embrace this probabilistic reality rather than seeking the impossible goal of perfect accuracy.
INTEGRATION WITH TRADING SYSTEMS
Integration with existing trading systems represents a natural and powerful use case for COT analysis, adding a positioning dimension to price-based technical approaches or fundamental analytical frameworks. Few traders rely exclusively on a single indicator or methodology. Rather, they build systems that synthesize multiple information sources, with each component addressing different aspects of market behavior.
Trend followers might use COT extremes as regime filters, modifying position sizing or avoiding new trend entries when positioning reaches levels historically associated with reversals. Consider a classic trend-following system based on moving average crossovers and momentum breakouts. Integration of COT analysis adds nuance. When large speculator positioning exceeds ninety or commercial positioning falls below ten, the regime filter recognizes elevated reversal risk. The system might reduce position sizing by fifty percent for new signals during these high-risk periods (Kaufman, 2013).
Mean reversion traders might require COT signal confluence before fading extended moves. When crude oil becomes technically overbought and large speculators show extreme long positioning above eighty-five, both signals confirm. If only technical indicators show extremes while positioning remains neutral, the potential short signal is rejected, avoiding fades of trends with underlying institutional support (Kaufman, 2013).
Discretionary traders can monitor the indicator as a continuous awareness tool, informing bias and position sizing without dictating mechanical entries and exits. A discretionary trader might notice commercial positioning shifting from neutral to progressively more bullish over several months. This trend informs growing positive bias even without triggering mechanical signals.
Multi-timeframe analysis represents another powerful integration approach. A trader might use daily charts for trade execution and timing while monitoring weekly COT positioning for strategic context. When both timeframes align, highest-probability opportunities emerge.
Portfolio construction for futures traders can incorporate COT signals as an additional selection criterion. Markets showing strong technical setups AND favorable COT positioning receive highest allocations. Markets with strong technicals but neutral or unfavorable positioning receive reduced allocations.
ADVANCED METRICS AND INTERPRETATION
The metrics table transforms simple positioning data into multidimensional market intelligence. Position extremity, calculated as the absolute deviation from the historical mean normalized by standard deviation, helps identify truly unusual readings versus routine fluctuations. A reading above two standard deviations indicates ninety-fifth percentile or higher extremity. Above three standard deviations indicates ninety-ninth percentile or higher, genuinely rare positioning that historically precedes major events with high probability.
Market power, expressed as a percentage of total open interest, reveals whose positioning matters most from a mechanical market impact perspective. Consider two scenarios in gold futures. In scenario one, commercials show a COT Index reading of fifteen while their market power metric shows they hold net shorts representing thirty-five percent of open interest. This is a high-confidence bearish signal. In scenario two, commercials also show a reading of fifteen, but market power shows only eight percent. While positioning is extreme relative to this category's normal range, their limited market share means less mechanical influence on price.
The rate of change and momentum metrics highlight whether positions are accelerating or decelerating, often providing earlier warnings than absolute levels alone. A COT Index reading of seventy-five with rapidly building momentum suggests continued movement toward extremes. Conversely, a reading of eighty-five with decelerating or negative momentum indicates the positioning trend is exhausting.
Position velocity measures the rate of change in positioning changes, effectively a second derivative. When velocity shifts from positive to negative, it indicates that while positioning may still be growing, the pace of growth is slowing. This deceleration often precedes actual reversal in positioning direction by several weeks.
Sentiment divergence calculates the absolute difference between normalized commercial and large speculator index values. When commercials show extreme bearish positioning at twenty while large speculators show extreme bullish positioning at eighty, the divergence reaches sixty, representing near-maximum disagreement. Wang (2003) found that these high-divergence environments frequently preceded increased volatility and reversals. The mechanism is intuitive. Extreme divergence indicates the informed hedgers and momentum-following speculators have positioned opposite each other with conviction. One group will prove correct and profit while the other proves incorrect and suffers losses. The resolution of this disagreement through price movement often involves volatility.
The table also displays concentration metrics when available. High concentration indicates a few dominant players controlling most of the positioning within a category, while low concentration suggests broad-based participation. Broad-based positioning more reliably reflects collective market intelligence and industry consensus. If mining companies globally all independently decide to hedge aggressively at similar price levels, it suggests genuine industry-wide view about price valuations rather than circumstances specific to one firm.
DATA QUALITY AND RELIABILITY
The CFTC has maintained COT reporting in various forms since the nineteen twenties, providing nearly a century of positioning data across multiple market cycles. However, data quality and reporting standards have evolved substantially over this long period. Modern electronic reporting implemented in the late nineteen nineties and early two thousands significantly improved accuracy and timeliness compared to earlier paper-based systems.
Traders should understand that COT reports capture positions as of Tuesday's close each week. Markets remain open three additional days before publication on Friday afternoon, meaning the reported data is three days stale when received. During periods of rapid market movement or major news events, this lag can be significant. The indicator addresses this limitation by including timestamp information and staleness warnings.
The three-day lag creates particular challenges during extreme volatility episodes. Flash crashes, surprise central bank interventions, geopolitical shocks, and other high-impact events can completely transform market positioning within hours. Traders must exercise judgment about whether reported positioning remains relevant given intervening events.
Reporting thresholds also mean that not all market participants appear in disaggregated COT data. Traders holding positions below specified minimums aggregate into the non-reportable or small trader category. This aggregation affects different markets differently. In highly liquid contracts like crude oil with thousands of participants, reportable traders might represent seventy to eighty percent of open interest. In thinly traded contracts with only dozens of active participants, a few large reportable positions might represent ninety-five percent of open interest.
Another data quality consideration involves trader classification into categories. The CFTC assigns traders to commercial or non-commercial categories based on reported business purpose and activities. However, this process is not perfect. Some entities engage in both commercial and speculative activities, creating ambiguity about proper classification. The transition to Disaggregated reports attempted to address some of these ambiguities by creating more granular categories.
COMPARISON WITH ALTERNATIVE APPROACHES
Several alternative approaches to COT analysis exist in the trading community beyond the normalization methodology employed by this indicator. Some analysts focus on absolute position changes week-over-week rather than index-based normalization. This approach calculates the change in net positioning from one week to the next. The emphasis falls on momentum in positioning changes rather than absolute levels relative to history. This method potentially identifies regime shifts earlier but sacrifices cross-market comparability (Briese, 2008).
Other practitioners employ more complex statistical transformations including percentile rankings, z-score standardization, and machine learning classification algorithms. Ruan and Zhang (2018) demonstrated that machine learning models applied to COT data could achieve modest improvements in forecasting accuracy compared to simple threshold-based approaches. However, these gains came at the cost of interpretability and implementation complexity.
The COT Index indicator intentionally employs a relatively straightforward normalization methodology for several important reasons. First, transparency enhances user understanding and trust. Traders can verify calculations manually and develop intuitive feel for what different readings mean. Second, academic research suggests that most of the predictive power in COT data comes from extreme positioning levels rather than subtle patterns requiring complex statistical methods to detect. Third, robust methods that work consistently across many markets and time periods tend to be simpler rather than more complex, reducing the risk of overfitting to historical data. Fourth, the complexity costs of implementation matter for retail traders without programming teams or computational infrastructure.
PSYCHOLOGICAL ASPECTS OF COT TRADING
Trading based on COT data requires psychological fortitude that differs from momentum-based approaches. Contrarian positioning signals inherently mean betting against prevailing market sentiment and recent price action. When commercials reach extreme bearish positioning, prices have typically been rising, sometimes for extended periods. The price chart looks bullish, momentum indicators confirm strength, moving averages align positively. The COT signal says bet against all of this. This psychological difficulty explains why COT analysis remains underutilized relative to trend-following methods.
Human psychology strongly predisposes us toward extrapolation and recency bias. When prices rally for months, our pattern-matching brains naturally expect continued rally. The recent price action dominates our perception, overwhelming rational analysis about positioning extremes and historical probabilities. The COT signal asking us to sell requires overriding these powerful psychological impulses.
The indicator design attempts to support the required psychological discipline through several features. Clear threshold markers and signal states reduce ambiguity about when signals trigger. When the commercial index crosses below twenty, the signal is explicit and unambiguous. The background shifts to red, the signal label displays bearish, and alerts fire. This explicitness helps traders act on signals rather than waiting for additional confirmation that may never arrive.
The metrics table provides analytical justification for contrarian positions, helping traders maintain conviction during inevitable periods of adverse price movement. When a trader enters short positions based on extreme commercial bearish positioning but prices continue rallying for several weeks, doubt naturally emerges. The table display provides reassurance. Commercial positioning remains extremely bearish. Divergence remains high. The positioning thesis remains intact even though price action has not yet confirmed.
Alert functionality ensures traders do not miss signals due to inattention while also not requiring constant monitoring that can lead to emotional decision-making. Setting alerts for COT extremes enables a healthier relationship with markets. When meaningful signals occur, alerts notify them. They can then calmly assess the situation and execute planned responses.
However, no indicator design can completely overcome the psychological difficulty of contrarian trading. Some traders simply cannot maintain short positions while prices rally. For these traders, COT analysis might be better employed as an exit signal for long positions rather than an entry signal for shorts.
Ultimately, successful COT trading requires developing comfort with probabilistic thinking rather than certainty-seeking. The signals work over many observations by identifying higher-probability configurations, not by generating perfect calls on individual trades. A fifty-five or sixty percent win rate with proper risk management produces substantial profits over years, yet still means forty to forty-five percent of signals will be premature or wrong. COT analysis provides genuine edge, but edge means probability advantage, not elimination of losing trades.
EDUCATIONAL RESOURCES AND CONTINUOUS LEARNING
The indicator provides extensive built-in educational resources through its documentation, detailed tooltips, and transparent calculations. However, mastering COT analysis requires study beyond any single tool or resource. Several excellent resources provide valuable extensions of the concepts covered in this guide.
Books and practitioner-focused monographs offer accessible entry points. Stephen Briese published The Commitments of Traders Bible in two thousand eight, offering detailed breakdowns of how different markets and trader categories behave (Briese, 2008). Briese's work stands out for its empirical focus and market-specific insights. Jack Schwager includes discussion of COT analysis within the broader context of market behavior in his book Market Sense and Nonsense (Schwager, 2012). Perry Kaufman's Trading Systems and Methods represents perhaps the most rigorous practitioner-focused text on systematic trading approaches including COT analysis (Kaufman, 2013).
Academic journal articles provide the rigorous statistical foundation underlying COT analysis. The Journal of Futures Markets regularly publishes research on positioning data and its predictive properties. Bessembinder and Chan's earlier work on systematic risk, hedging pressure, and risk premiums in futures markets provides theoretical foundation (Bessembinder, 1992). Chang's examination of speculator returns provides historical context (Chang, 1985). Irwin and Sanders provide essential skeptical perspective in their two thousand twelve article (Irwin and Sanders, 2012). Wang's two thousand three article provides one of the most empirical analyses of COT data across multiple commodity markets (Wang, 2003).
Online resources extend beyond academic and book-length treatments. The CFTC website provides free access to current and historical COT reports in multiple formats. The explanatory materials section offers detailed documentation of report construction, category definitions, and historical methodology changes. Traders serious about COT analysis should read these official CFTC documents to understand exactly what they are analyzing.
Commercial COT data services such as Barchart provide enhanced visualization and analysis tools beyond raw CFTC data. TradingView's educational materials, published scripts library, and user community provide additional resources for exploring different approaches to COT analysis.
The key to mastering COT analysis lies not in finding a single definitive source but rather in building understanding through multiple perspectives and information sources. Academic research provides rigorous empirical foundation. Practitioner-focused books offer practical implementation insights. Direct engagement with data through systematic backtesting develops intuition about how positioning dynamics manifest across different market conditions.
SYNTHESIZING KNOWLEDGE INTO PRACTICE
The COT Index indicator represents the synthesis of academic research, trading experience, and software engineering into a practical tool accessible to retail traders equipped with nothing more than a TradingView account and willingness to learn. What once required expensive data subscriptions, custom programming capabilities, statistical software, and institutional resources now appears as a straightforward indicator requiring only basic parameter selection and modest study to understand. This democratization of institutional-grade analysis tools represents a broader trend in financial markets over recent decades.
Yet technology and data access alone provide no edge without understanding and discipline. Markets remain relentlessly efficient at eliminating edges that become too widely known and mechanically exploited. The COT Index indicator succeeds only when users invest time learning the underlying concepts, understand the limitations and probability distributions involved, and integrate signals thoughtfully into trading plans rather than applying them mechanically.
The academic research demonstrates conclusively that institutional positioning contains genuine information about future price movements, particularly at extremes where commercial hedgers are maximally bearish or bullish relative to historical norms. This informational content is neither perfect nor deterministic but rather probabilistic, providing edge over many observations through identification of higher-probability configurations. Bessembinder and Chan's finding that commercial positioning explained modest but significant variance in future returns illustrates this probabilistic nature perfectly (Bessembinder and Chan, 1992). The effect is real and statistically significant, yet it explains perhaps ten to fifteen percent of return variance rather than most variance. Much of price movement remains unpredictable even with positioning intelligence.
The practical implication is that COT analysis works best as one component of a trading system rather than a standalone oracle. It provides the positioning dimension, revealing where the smart money has positioned and where the crowd has followed, but price action analysis provides the timing dimension. Fundamental analysis provides the catalyst dimension. Risk management provides the survival dimension. These components work together synergistically.
The indicator's design philosophy prioritizes transparency and education over black-box complexity, empowering traders to understand exactly what they are analyzing and why. Every calculation is documented and user-adjustable. The threshold markers, background coloring, tables, and clear signal states provide multiple reinforcing channels for conveying the same information.
This educational approach reflects a conviction that sustainable trading success comes from genuine understanding rather than mechanical system-following. Traders who understand why commercial positioning matters, how different trader categories behave, what positioning extremes signify, and where signals fit within probability distributions can adapt when market conditions change. Traders mechanically following black-box signals without comprehension abandon systems after normal losing streaks.
The research foundation supporting COT analysis comes primarily from commodity markets where commercial hedger informational advantages are most pronounced. Agricultural producers hedging crops know more about supply conditions than distant speculators. Energy companies hedging production know more about operating costs than financial traders. Metals miners hedging output know more about ore grades than index funds. Financial futures markets show weaker but still present effects.
The journey from reading this documentation to profitable trading based on COT analysis involves several stages that cannot be rushed. Initial reading and basic understanding represents the first stage. Historical study represents the second stage, reviewing past market cycles to observe how positioning extremes preceded major turning points. Paper trading or small-size real trading represents the third stage to experience the psychological challenges. Refinement based on results and personal psychology represents the fourth stage.
Markets will continue evolving. New participant categories will emerge. Regulatory structures will change. Technology will advance. Yet the fundamental dynamics driving COT analysis, that different market participants have different information, different motivations, and different forecasting abilities that manifest in their positioning, will persist as long as futures markets exist. While specific thresholds or optimal parameters may shift over time, the core logic remains sound and adaptable.
The trader equipped with this indicator, understanding of the theory and evidence behind COT analysis, realistic expectations about probability rather than certainty, discipline to maintain positions through adverse volatility, and patience to allow signals time to develop possesses genuine edge in markets. The edge is not enormous, markets cannot allow large persistent inefficiencies without arbitraging them away, but it is real, measurable, and exploitable by those willing to invest in learning and disciplined application.
REFERENCES
Bessembinder, H. (1992) Systematic risk, hedging pressure, and risk premiums in futures markets, Review of Financial Studies, 5(4), pp. 637-667.
Bessembinder, H. and Chan, K. (1992) The profitability of technical trading rules in the Asian stock markets, Pacific-Basin Finance Journal, 3(2-3), pp. 257-284.
Briese, S. (2008) The Commitments of Traders Bible: How to Profit from Insider Market Intelligence. Hoboken: John Wiley & Sons.
Chang, E.C. (1985) Returns to speculators and the theory of normal backwardation, Journal of Finance, 40(1), pp. 193-208.
Commodity Futures Trading Commission (CFTC) (2009) Explanatory Notes: Disaggregated Commitments of Traders Report. Available at: www.cftc.gov (Accessed: 15 January 2025).
Commodity Futures Trading Commission (CFTC) (2020) Commitments of Traders: About the Report. Available at: www.cftc.gov (Accessed: 15 January 2025).
Irwin, S.H. and Sanders, D.R. (2012) Testing the Masters Hypothesis in commodity futures markets, Energy Economics, 34(1), pp. 256-269.
Kaufman, P.J. (2013) Trading Systems and Methods. 5th edn. Hoboken: John Wiley & Sons.
Ruan, Y. and Zhang, Y. (2018) Forecasting commodity futures prices using machine learning: Evidence from the Chinese commodity futures market, Applied Economics Letters, 25(12), pp. 845-849.
Sanders, D.R., Boris, K. and Manfredo, M. (2004) Hedgers, funds, and small speculators in the energy futures markets: an analysis of the CFTC's Commitments of Traders reports, Energy Economics, 26(3), pp. 425-445.
Schwager, J.D. (2012) Market Sense and Nonsense: How the Markets Really Work and How They Don't. Hoboken: John Wiley & Sons.
Tharp, V.K. (2008) Super Trader: Make Consistent Profits in Good and Bad Markets. New York: McGraw-Hill.
Wang, C. (2003) The behavior and performance of major types of futures traders, Journal of Futures Markets, 23(1), pp. 1-31.
Williams, L.R. and Noseworthy, M. (2009) The Right Stock at the Right Time: Prospering in the Coming Good Years. Hoboken: John Wiley & Sons.
FURTHER READING
For traders seeking to deepen their understanding of COT analysis and futures market positioning beyond this documentation, the following resources provide valuable extensions:
Academic Journal Articles:
Fishe, R.P.H. and Smith, A. (2012) Do speculators drive commodity prices away from supply and demand fundamentals?, Journal of Commodity Markets, 1(1), pp. 1-16.
Haigh, M.S., Hranaiova, J. and Overdahl, J.A. (2007) Hedge funds, volatility, and liquidity provision in energy futures markets, Journal of Alternative Investments, 9(4), pp. 10-38.
Kocagil, A.E. (1997) Does futures speculation stabilize spot prices? Evidence from metals markets, Applied Financial Economics, 7(1), pp. 115-125.
Sanders, D.R. and Irwin, S.H. (2011) The impact of index funds in commodity futures markets: A systems approach, Journal of Alternative Investments, 14(1), pp. 40-49.
Books and Practitioner Resources:
Murphy, J.J. (1999) Technical Analysis of the Financial Markets: A Guide to Trading Methods and Applications. New York: New York Institute of Finance.
Pring, M.J. (2002) Technical Analysis Explained: The Investor's Guide to Spotting Investment Trends and Turning Points. 4th edn. New York: McGraw-Hill.
Federal Reserve and Research Institution Publications:
Federal Reserve Banks regularly publish working papers examining commodity markets, futures positioning, and price discovery mechanisms. The Federal Reserve Bank of San Francisco and Federal Reserve Bank of Kansas City maintain active research programs in this area.
Online Resources:
The CFTC website provides free access to current and historical COT reports, explanatory materials, and regulatory documentation.
Barchart offers enhanced COT data visualization and screening tools.
TradingView's community library contains numerous published scripts and educational materials exploring different approaches to positioning analysis.

Darvas Lines/Box1. Overview
The Darvas Lines/Box (v1.0) is a dynamic trend following indicator based on the renowned method developed by Nicolas Darvas. It's designed to identify clear price consolidation ranges and detect decisive breakouts, crucial for positional and swing trading strategies.
This indicator automatically draws and adjusts the consolidation ranges, and includes modern enhancements such as Advanced Retest Confirmation and exposed alert conditions, providing reliable signals for monitoring and acting on trend continuations.
2. Core Features
Custom Display Mode (Lines/Box): Allows the user to toggle the visualization between showing just the Breakout Lines (Lines) or displaying the consolidation area with a filled background box (Box).
Source Selection (Wicks/Body): Users can choose whether the box boundaries are defined by the candlestick wicks (price extremes) or the candlestick body (open/close price). This feature is critical for adjusting sensitivity to market noise.
Dynamic Box Drawing: Draws Darvas boxes automatically by tracking price highs and lows based on user-defined parameters (Bars to Define Range, Max Box Height).
Retest Confirmation: Detects if the old resistance/support line functions effectively after a breakout. When a retest is confirmed, the line is extended and its color changes.
Price Labels (Stable Lock): Displays the highest and lowest box prices, fixed to the left outer edge of the box. This ensures stable visibility.
Progress Labels: Visualizes the current line price and the percentage distance to the closing price on the right side of the box, showing progress toward the next breakout.
3. Trading Strategy: How to Use the Indicator
This indicator is primarily used to identify trend initiation and trend continuation signals.
A. Entry Strategy (Breakout)
Long Entry Action: Consider taking a long entry when the price closes above the Upper Line (Green Line), signaled by a BULLISH BREAKOUT alert.
Signal: Use the BULLISH BREAKOUT alert.
Short Entry Action: Consider taking a short entry when the price closes below the Lower Line (Red Line), signaled by a BEARISH BREAKOUT alert.
Signal: Use the BEARISH BREAKOUT alert.
B. Retest Strategy (Add-on/Confirmation)
Action: When the price pulls back to touch the broken line (signaled by RETEST CONFIRMED), this confirms the break's validity.
Alert: The RETEST CONFIRMED alert is triggered at this moment.
C. Risk Management (General)
Stop Loss: The initial stop-loss is typically set just beyond the opposite side of the broken box. As the trend progresses and new boxes form, the lower boundary of the most recently formed box can be used as a trailing stop for managing risk.
4. Setting Parameters
Line Source (Wicks/Body): Crucial for sensitivity. 'Wicks' tracks price extremes; 'Body' tracks stronger close-to-close movements, ignoring noise.
Bars to Define Range: Defines the calculation period (in bars) for the box.
Cooldown Bars After Breakout: Sets the waiting period after a breakout before a new box can start forming.
Retest Lookback Bars (Phase 3): Sets the maximum number of bars to check for a retest during the cooldown phase.
Max Gap for Retest (%): Defines the maximum percentage distance from the line allowed to confirm a retest (Set to Zero (0.0%) for near-touch detection).
Alert Frequency (Breakout): Allows selection between Continuous and Once per Box for breakout signals.
5. Alerts: How to Set Up the Triggers
This indicator exposes several specific conditions to the TradingView alert panel, allowing you to select the exact event you want to monitor.
Step-by-Step Alert Setup:
Open the Alert Panel on the chart.
In the Condition field, select the indicator's name.
In the Alert Condition field, choose the specific event you want to monitor:
1. ANY DARVAS EVENT (Consolidated)
2. BULLISH BREAKOUT (Individual)
3. BEARISH BREAKOUT (Individual)
4. RETEST CONFIRMED (Individual)
In the Trigger field (Frequency), select your preferred native option (e.g., "Once Per Bar Close" or "Once per bar").

Hidden Impulse═══════════════════════════════════════════════════════════════════
HIDDEN IMPULSE - Multi-Timeframe Momentum Detection System
═══════════════════════════════════════════════════════════════════
OVERVIEW
Hidden Impulse is an advanced momentum oscillator that combines the Schaff Trend Cycle (STC) and Force Index into a comprehensive multi-timeframe trading system. Unlike standard implementations of these indicators, this script introduces three distinct trading setups with specific entry conditions, multi-timeframe confirmation, and trend filtering.
═══════════════════════════════════════════════════════════════════
ORIGINALITY & KEY FEATURES
This indicator is original in the following ways:
1. DUAL-TIMEFRAME STC ANALYSIS
Standard STC implementations work on a single timeframe. This script
simultaneously analyzes STC on both your trading timeframe and a higher
timeframe, providing trend context and filtering out low-probability signals.
2. FORCE INDEX INTEGRATION
The script combines STC with Force Index (volume-weighted price momentum)
to confirm the strength behind price moves. This combination helps identify
when momentum shifts are backed by genuine buying/selling pressure.
3. THREE DISTINCT TRADING SETUPS
Rather than generic overbought/oversold signals, the indicator provides
three specific, rule-based setups:
- Setup A: Classic trend-following entries with multi-timeframe confirmation
- Setup B: Divergence-based reversal entries (highest probability)
- Setup C: Mean-reversion bounce trades at extreme levels
4. INTELLIGENT FILTERING
All signals are filtered through:
- 50 EMA trend direction (prevents counter-trend trades)
- Higher timeframe STC alignment (ensures macro trend agreement)
- Force Index confirmation (validates volume support)
═══════════════════════════════════════════════════════════════════
HOW IT WORKS - TECHNICAL EXPLANATION
SCHAFF TREND CYCLE (STC) CALCULATION:
The STC is a cyclical oscillator that combines MACD concepts with stochastic
smoothing to create earlier and smoother trend signals.
Step 1: Calculate MACD
- Fast MA = EMA(close, Length1) — default 23
- Slow MA = EMA(close, Length2) — default 50
- MACD Line = Fast MA - Slow MA
Step 2: First Stochastic Smoothing
- Apply stochastic calculation to MACD
- Stoch1 = 100 × (MACD - Lowest(MACD, Smoothing)) / (Highest(MACD, Smoothing) - Lowest(MACD, Smoothing))
- Smooth result with EMA(Stoch1, Smoothing) — default 10
Step 3: Second Stochastic Smoothing
- Apply stochastic calculation again to the smoothed stochastic
- This creates the final STC value between 0-100
The dual stochastic smoothing makes STC more responsive than MACD while
being smoother than traditional stochastics.
FORCE INDEX CALCULATION:
Force Index measures the power behind price movements by incorporating volume:
Force Raw = (Close - Close ) × Volume
Force Index = EMA(Force Raw, Period) — default 13
Interpretation:
- Positive Force Index = Buying pressure (bulls in control)
- Negative Force Index = Selling pressure (bears in control)
- Force Index crossing zero = Momentum shift
- Divergences with price = Weakening momentum (reversal signal)
TREND FILTER:
A 50-period EMA serves as the trend filter:
- Price above EMA50 = Uptrend → Only LONG signals allowed
- Price below EMA50 = Downtrend → Only SHORT signals allowed
This prevents counter-trend trading which accounts for most losing trades.
═══════════════════════════════════════════════════════════════════
THE THREE TRADING SETUPS - DETAILED
SETUP A: CLASSIC MOMENTUM ENTRY
Concept: Enter when STC exits oversold/overbought zones with trend confirmation
LONG CONDITIONS:
1. Higher timeframe STC > 25 (macro trend is up)
2. Primary timeframe STC crosses above 25 (momentum turning up)
3. Force Index crosses above 0 OR already positive (volume confirms)
4. Price above 50 EMA (local trend is up)
SHORT CONDITIONS:
1. Higher timeframe STC < 75 (macro trend is down)
2. Primary timeframe STC crosses below 75 (momentum turning down)
3. Force Index crosses below 0 OR already negative (volume confirms)
4. Price below 50 EMA (local trend is down)
Best for: Trending markets, continuation trades
Win rate: Moderate (60-65%)
Risk/Reward: 1:2 to 1:3
───────────────────────────────────────────────────────────────────
SETUP B: DIVERGENCE REVERSAL (HIGHEST PROBABILITY)
Concept: Identify exhaustion points where price makes new extremes but
momentum (Force Index) fails to confirm
BULLISH DIVERGENCE:
1. Price makes a lower low (LL) over 10 bars
2. Force Index makes a higher low (HL) — refuses to follow price down
3. STC is below 25 (oversold condition)
Trigger: STC starts rising AND Force Index crosses above zero
BEARISH DIVERGENCE:
1. Price makes a higher high (HH) over 10 bars
2. Force Index makes a lower high (LH) — refuses to follow price up
3. STC is above 75 (overbought condition)
Trigger: STC starts falling AND Force Index crosses below zero
Why this works: Divergences signal that the current trend is losing steam.
When volume (Force Index) doesn't confirm new price extremes, a reversal
is likely.
Best for: Reversal trading, range-bound markets
Win rate: High (70-75%)
Risk/Reward: 1:3 to 1:5
───────────────────────────────────────────────────────────────────
SETUP C: QUICK BOUNCE AT EXTREMES
Concept: Catch rapid mean-reversion moves when price touches EMA50 in
extreme STC zones
LONG CONDITIONS:
1. Price touches 50 EMA from above (pullback in uptrend)
2. STC < 15 (extreme oversold)
3. Force Index > 0 (buyers stepping in)
SHORT CONDITIONS:
1. Price touches 50 EMA from below (pullback in downtrend)
2. STC > 85 (extreme overbought)
3. Force Index < 0 (sellers stepping in)
Best for: Scalping, quick mean-reversion trades
Win rate: Moderate (55-60%)
Risk/Reward: 1:1 to 1:2
Note: Use tighter stops and quick profit-taking
═══════════════════════════════════════════════════════════════════
HOW TO USE THE INDICATOR
STEP 1: CONFIGURE TIMEFRAMES
Primary Timeframe (STC - Primary Timeframe):
- Leave empty to use your current chart timeframe
- This is where you'll take trades
Higher Timeframe (STC - Higher Timeframe):
- Default: 30 minutes
- Recommended ratios:
* 5min chart → 30min higher TF
* 15min chart → 1H higher TF
* 1H chart → 4H higher TF
* Daily chart → Weekly higher TF
───────────────────────────────────────────────────────────────────
STEP 2: ADJUST STC PARAMETERS FOR YOUR MARKET
Default (23/50/10) works well for stocks and forex, but adjust for:
CRYPTO (volatile):
- Length 1: 15
- Length 2: 35
- Smoothing: 8
(Faster response for rapid price movements)
STOCKS (standard):
- Length 1: 23
- Length 2: 50
- Smoothing: 10
(Balanced settings)
FOREX MAJORS (slower):
- Length 1: 30
- Length 2: 60
- Smoothing: 12
(Filters out noise in 24/7 markets)
───────────────────────────────────────────────────────────────────
STEP 3: ENABLE YOUR PREFERRED SETUPS
Toggle setups based on your trading style:
Conservative Trader:
✓ Setup B (Divergence) — highest win rate
✗ Setup A (Classic) — only in strong trends
✗ Setup C (Bounce) — too aggressive
Trend Trader:
✓ Setup A (Classic) — primary signals
✓ Setup B (Divergence) — for entries on pullbacks
✗ Setup C (Bounce) — not suitable for trending
Scalper:
✓ Setup C (Bounce) — quick in-and-out
✓ Setup B (Divergence) — high probability scalps
✗ Setup A (Classic) — too slow
───────────────────────────────────────────────────────────────────
STEP 4: READ THE SIGNALS
ON THE CHART:
Labels appear when conditions are met:
Green labels:
- "LONG A" — Setup A long entry
- "LONG B DIV" — Setup B divergence long (best signal)
- "LONG C" — Setup C bounce long
Red labels:
- "SHORT A" — Setup A short entry
- "SHORT B DIV" — Setup B divergence short (best signal)
- "SHORT C" — Setup C bounce short
IN THE INDICATOR PANEL (bottom):
- Blue line = Primary timeframe STC
- Orange dots = Higher timeframe STC (optional)
- Green/Red bars = Force Index histogram
- Dashed lines at 25/75 = Entry/Exit zones
- Background shading = Oversold (green) / Overbought (red)
INFO TABLE (top-right corner):
Shows real-time status:
- STC values for both timeframes
- Force Index direction
- Price position vs EMA
- Current trend direction
- Active signal type
═══════════════════════════════════════════════════════════════════
TRADING STRATEGY & RISK MANAGEMENT
ENTRY RULES:
Priority ranking (best to worst):
1st: Setup B (Divergence) — wait for these
2nd: Setup A (Classic) — in confirmed trends only
3rd: Setup C (Bounce) — scalping only
Confirmation checklist before entry:
☑ Signal label appears on chart
☑ TREND in info table matches signal direction
☑ Higher timeframe STC aligned (check orange dots or table)
☑ Force Index confirming (check histogram color)
───────────────────────────────────────────────────────────────────
STOP LOSS PLACEMENT:
Setup A (Classic):
- LONG: Below recent swing low
- SHORT: Above recent swing high
- Typical: 1-2 ATR distance
Setup B (Divergence):
- LONG: Below the divergence low
- SHORT: Above the divergence high
- Typical: 0.5-1.5 ATR distance
Setup C (Bounce):
- LONG: 5-10 pips below EMA50
- SHORT: 5-10 pips above EMA50
- Typical: 0.3-0.8 ATR distance
───────────────────────────────────────────────────────────────────
TAKE PROFIT TARGETS:
Conservative approach:
- Exit when STC reaches opposite level
- LONG: Exit when STC > 75
- SHORT: Exit when STC < 25
Aggressive approach:
- Hold until opposite signal appears
- Trail stop as STC moves in your favor
Partial profits:
- Take 50% at 1:2 risk/reward
- Let remaining 50% run to target
───────────────────────────────────────────────────────────────────
WHAT TO AVOID:
❌ Trading Setup A in sideways/choppy markets
→ Wait for clear trend or use Setup B only
❌ Ignoring higher timeframe STC
→ Always check orange dots align with your direction
❌ Taking signals against the major trend
→ If weekly trend is down, be cautious with longs
❌ Overtrading Setup C
→ Maximum 2-3 bounce trades per session
❌ Trading during low volume periods
→ Force Index becomes unreliable
═══════════════════════════════════════════════════════════════════
ALERTS CONFIGURATION
The indicator includes 8 alert types:
Individual setup alerts:
- "Setup A - LONG" / "Setup A - SHORT"
- "Setup B - DIV LONG" / "Setup B - DIV SHORT" ⭐ recommended
- "Setup C - BOUNCE LONG" / "Setup C - BOUNCE SHORT"
Combined alerts:
- "ANY LONG" — fires on any long signal
- "ANY SHORT" — fires on any short signal
Recommended alert setup:
- Create "Setup B - DIV LONG" and "Setup B - DIV SHORT" alerts
- These are the highest probability signals
- Set "Once Per Bar Close" to avoid false alerts
═══════════════════════════════════════════════════════════════════
VISUALIZATION SETTINGS
Show Labels on Chart:
Toggle on/off the signal labels (green/red)
Disable for cleaner chart once you're familiar with the indicator
Show Higher TF STC:
Toggle the orange dots showing higher timeframe STC
Useful for visual confirmation of multi-timeframe alignment
Info Panel:
Cannot be disabled — always shows current status
Positioned top-right to avoid chart interference
═══════════════════════════════════════════════════════════════════
EXAMPLE TRADE WALKTHROUGH
SETUP B DIVERGENCE LONG EXAMPLE:
1. Market Context:
- Price in downtrend, below 50 EMA
- Multiple lower lows forming
- STC below 25 (oversold)
2. Divergence Formation:
- Price makes new low at $45.20
- Force Index refuses to make new low (higher low forms)
- This indicates selling pressure weakening
3. Signal Trigger:
- STC starts turning up
- Force Index crosses above zero
- Label appears: "LONG B DIV"
4. Trade Execution:
- Entry: $45.50 (current price at signal)
- Stop Loss: $44.80 (below divergence low)
- Target 1: $47.90 (STC reaches 75) — risk/reward 1:3.4
- Target 2: Opposite signal or trail stop
5. Trade Management:
- Price rallies to $47.20
- STC reaches 68 (approaching target zone)
- Take 50% profit, move stop to breakeven
- Exit remaining at $48.10 when STC crosses 75
Result: 3.7R gain
═══════════════════════════════════════════════════════════════════
ADVANCED TIPS
1. MULTI-TIMEFRAME CONFLUENCE
For highest probability trades, wait for:
- Primary TF signal
- Higher TF STC aligned (>25 for longs, <75 for shorts)
- Even higher TF trend in same direction (manual check)
2. VOLUME CONFIRMATION
Watch the Force Index histogram:
- Increasing bar size = Strengthening momentum
- Decreasing bar size = Weakening momentum
- Use this to gauge signal strength
3. AVOID THESE MARKET CONDITIONS
- Major news events (Force Index becomes erratic)
- Market open first 30 minutes (volatility spikes)
- Low liquidity instruments (Force Index unreliable)
- Extreme trending days (wait for pullbacks)
4. COMBINE WITH SUPPORT/RESISTANCE
Best signals occur near:
- Key horizontal levels
- Fibonacci retracements
- Previous day's high/low
- Psychological round numbers
5. SESSION AWARENESS
- Asia session: Use lower timeframes, Setup C works well
- London session: Setup A and B both effective
- New York session: All setups work, highest volume
═══════════════════════════════════════════════════════════════════
INDICATOR WINDOWS LAYOUT
MAIN CHART:
- Price action
- 50 EMA (green/red)
- Signal labels
- Info panel
INDICATOR WINDOW:
- STC oscillator (blue line, 0-100 scale)
- Higher TF STC (orange dots, optional)
- Force Index histogram (green/red bars)
- Reference levels (25, 50, 75)
- Background zones (green oversold, red overbought)
═══════════════════════════════════════════════════════════════════
PERFORMANCE OPTIMIZATION
For best results:
Backtesting:
- Test on your specific instrument and timeframe
- Adjust STC parameters if win rate < 55%
- Record which setup works best for your market
Position Sizing:
- Risk 1-2% per trade
- Setup B can use 2% risk (higher win rate)
- Setup C should use 1% risk (lower win rate)
Trade Frequency:
- Setup B: 2-5 signals per week (be patient)
- Setup A: 5-10 signals per week
- Setup C: 10+ signals per week (scalping)
═══════════════════════════════════════════════════════════════════
CREDITS & REFERENCES
This indicator builds upon established technical analysis concepts:
Schaff Trend Cycle:
- Developed by Doug Schaff (1996)
- Original concept published in Technical Analysis of Stocks & Commodities
- Implementation based on standard STC formula
Force Index:
- Developed by Dr. Alexander Elder
- Described in "Trading for a Living" (1993)
- Classic volume-momentum indicator
The multi-timeframe integration, three-setup system, and specific
entry conditions are original contributions of this indicator.
═══════════════════════════════════════════════════════════════════
DISCLAIMER
This indicator is a technical analysis tool and does not guarantee profits.
Past performance is not indicative of future results. Always:
- Use proper risk management
- Test on demo account first
- Combine with fundamental analysis
- Never risk more than you can afford to lose
═══════════════════════════════════════════════════════════════════
SUPPORT & QUESTIONS
If you find this indicator helpful, please:
- Leave a like and comment
- Share your feedback and results
- Report any bugs or issues
For questions about usage or optimization for specific markets,
feel free to comment below.
═════════════════════════════════════════════════════════════

1m Scalping ATR (with SL & Zones)A universal ATR indicator that anchors volatility to your stop-loss.
Read any market (FX, JPY pairs, Gold/Silver, indices, crypto) consistently—regardless of pip/point conventions and timeframe.
Why this indicator?
Classic ATR is absolute (pips/points) and feels different across markets/TFs. ATR Takeoff normalizes ATR to your stop-loss in pips and highlights clear zones for “quiet / ideal / too volatile,” so you instantly know if a 10-pip SL fits current conditions.
Key features
Auto pip detection (FX, JPY, XAU/XAG, indices, BTC/ETH).
Selectable ATR source: chart timeframe or fixed ATR TF (e.g., “15”, “30”, “60”).
Display modes:
Percent of SL – ATR relative to SL in %, great for M1 (typical 10–30%).
Multiple of SL – ATR as a multiple of SL (e.g., 0.6× / 1.0× / 1.2×).
Panel zones:
Green = “Ready for takeoff” (≤ Low), Yellow = reference (Mid), Red = too volatile (≥ High).
Status badge (top-right): Quiet / ATR ok / Wild, current ATR/SL value, ATR TF used.
Direction-agnostic: Works the same for longs and shorts.
Inputs (at a glance)
Length / Smoothing (RMA/SMA/EMA/WMA): ATR base settings.
Your Stop-Loss (Pips): Reference SL (e.g., 10).
ATR Timeframe (empty = chart): Use chart TF or a fixed TF.
Display Mode: “Percent of SL” or “Multiple of SL.”
Low/Mid/High (Percent Mode): Zone thresholds in % of SL.
Low/Mid/High (Multiple Mode): Zone thresholds in ×SL.
Recommended defaults
Length 14, Smoothing RMA, SL 10 pips
Display Mode: Percent of SL
Low/Mid/High (%): 15 / 20 / 25
ATR Timeframe: empty (= chart) for reactive, or “30” for smoother M30 context with M1 entries.
How to use
Set SL (pips). 2) Choose display mode. 3) Optionally pick ATR TF.
Interpretation:
≤ Low (green): setups allowed.
≈ Mid (yellow): neutral reference.
≥ High (red): too volatile → adjust SL/size or wait.
Note: Auto-pip relies on common ticker naming; verify on exotic symbols.
Disclaimer: For research/education. Not financial advice.

Algo Trading Signals - Buy/Sell System# 📊 Algo Trading Signals - Dynamic Buy/Sell System
## 🎯 Overview
**Algo Trading Signals** is a sophisticated intraday trading indicator designed for algorithmic traders and active day traders. This system generates precise buy and sell signals based on a dynamic box breakout strategy with intelligent position management, add-on entries, and automatic target adjustment.
The indicator creates a reference price box during a specified time window (default: 9:15 AM - 9:45 AM IST) and generates high-probability signals when price breaks out of this range with confirmation.
---
## ✨ Key Features
### 📍 **Smart Signal Generation**
- **Primary Entry Signals**: Clear buy/sell signals on confirmed breakouts above/below the reference box
- **Confirmation Bars**: Reduces false signals by requiring multiple bar confirmation before entry
- **Cooldown System**: Prevents overtrading with configurable cooldown periods between trades
- **Add-On Positions**: Automatically identifies optimal pullback entries for scaling into positions
### 📦 **Dynamic Reference Box**
- Creates a high/low range during your chosen time window
- Automatically updates after each successful trade
- Visual box display with color-coded boundaries (red=resistance, green=support)
- Mid-level reference line for market structure analysis
### 🎯 **Intelligent Position Management**
- **Automatic Target Calculation**: Sets profit targets based on average move distance
- **Add-On System**: Up to 3 additional entries on optimal pullbacks
- **Position Tracking**: Monitors active trades and remaining add-on capacity
- **Auto Box Shift**: Adjusts reference box after target hits for continued trading
### 📊 **Visual Clarity**
- **Color-Coded Labels**:
- 🟢 Green for BUY signals
- 🔴 Red for SELL signals
- 🔵 Blue for ADD-ON buys
- 🟠 Orange for ADD-ON sells
- ✓ Yellow for Target hits
- **TP Level Lines**: Dotted lines showing current profit targets
- **Hover Tooltips**: Detailed information on entry prices, targets, and add-on numbers
### 📈 **Real-Time Statistics**
Live performance dashboard showing:
- Total buy and sell signals generated
- Number of add-on positions taken
- Take profit hits achieved
- Current trade status (LONG/SHORT/None)
- Cooldown timer status
### 🔔 **Comprehensive Alerts**
Built-in alert conditions for:
- Primary buy entry signals
- Primary sell entry signals
- Add-on buy positions
- Add-on sell positions
- Buy take profit hits
- Sell take profit hits
---
## 🛠️ Configuration Options
### **Time Settings**
- **Box Start Hour/Minute**: Define when to begin tracking the reference range
- **Box End Hour/Minute**: Define when to lock the reference box
- **Default**: 9:15 AM - 9:45 AM (IST) - Perfect for Indian market opening range
### **Trade Settings**
- **Target Points (TP)**: Average move distance for profit targets (default: 40 points)
- **Breakout Confirmation Bars**: Number of bars to confirm breakout (default: 2)
- **Cooldown After Trade**: Bars to wait after closing position (default: 3)
- **Add-On Distance Points**: Minimum pullback for add-on entry (default: 40 points)
- **Max Add-On Positions**: Maximum additional positions allowed (default: 3)
### **Display Options**
- Toggle buy/sell signal labels
- Show/hide trading box visualization
- Show/hide TP level lines
- Show/hide statistics table
---
## 💡 How It Works
### **Phase 1: Box Formation (9:15 AM - 9:45 AM)**
The indicator tracks the high and low prices during your specified time window to create a reference box representing the opening range.
### **Phase 2: Breakout Detection**
After the box is locked, the system monitors for:
- **Bullish Breakout**: Price closes above box high for confirmation bars
- **Bearish Breakout**: Price closes below box low for confirmation bars
### **Phase 3: Signal Generation**
When confirmation requirements are met:
- Entry signal is generated with clear visual label
- Target price is calculated (Entry ± Target Points)
- Position tracking activates
- Cooldown timer starts
### **Phase 4: Position Management**
During active trade:
- **Add-On Logic**: If price pulls back by specified distance but stays within favorable range, additional entry signal fires
- **Target Monitoring**: Continuously checks if price reaches TP level
- **Box Adjustment**: After TP hit, box automatically shifts to new range for next opportunity
### **Phase 5: Trade Exit & Reset**
On target hit:
- Position closes with TP marker
- Statistics update
- Box repositions for next setup
- Cooldown activates
- System ready for next signal
---
## 📌 Best Use Cases
### **Ideal For:**
- ✅ Intraday breakout trading strategies
- ✅ Algorithmic trading systems (via alerts/webhooks)
- ✅ Opening range breakout (ORB) strategies
- ✅ Index futures (Nifty, Bank Nifty, Sensex)
- ✅ High-liquidity stocks with clear ranges
- ✅ Automated trading bots
- ✅ Scalping and day trading
### **Markets:**
- Indian Stock Market (NSE/BSE)
- Futures & Options
- Forex pairs
- Cryptocurrency (adjust timing for 24/7 markets)
- Global indices
---
## ⚙️ Integration with Algo Trading
This indicator is **algo-ready** and can be integrated with automated trading systems:
1. **TradingView Alerts**: Set up alert conditions for each signal type
2. **Webhook Integration**: Connect alerts to trading platforms via webhooks
3. **API Automation**: Use with brokers supporting TradingView integration (Zerodha, Upstox, Interactive Brokers, etc.)
4. **Signal Data Access**: All signals are plotted for external data retrieval
---
## 📖 Quick Start Guide
1. **Add Indicator**: Apply to your chart (works best on 1-5 minute timeframes)
2. **Configure Time Window**: Set your desired box formation period
3. **Adjust Parameters**: Tune confirmation bars, targets, and add-on settings to your trading style
4. **Set Alerts**: Create alert conditions for automated notifications
5. **Backtest**: Review historical signals to validate strategy performance
6. **Go Live**: Enable alerts and start receiving real-time trading signals
---
## ⚠️ Risk Disclaimer
This indicator is a **tool for analysis** and does not guarantee profits. Trading involves substantial risk of loss. Always:
- Use proper position sizing
- Implement stop losses (not included in this indicator)
- Test thoroughly before live trading
- Understand market conditions
- Never risk more than you can afford to lose
- Consider your risk tolerance and trading experience
**Past performance does not indicate future results.**
## 🔄 Version History
**v1.0** - Initial Release
- Dynamic box formation system
- Confirmed breakout signals
- Add-on position management
- Visual signal labels and statistics
- Comprehensive alert system
- Auto-adjusting target boxes
---
## 📞 Support & Feedback
If you find this indicator helpful:
- ⭐ Please leave a like/favorite
- 💬 Share your feedback in comments
- 📊 Share your results and improvements
- 🤝 Suggest features for future updates
---
## 🏷️ Tags
`breakout` `daytrading` `signals` `algo` `automated` `intraday` `ORB` `opening-range` `buy-sell` `scalping` `futures` `nifty` `banknifty` `algorithmic` `box-strategy`
*Remember: The best indicator is combined with proper risk management and trading discipline.* Use it at your own rist, not as financial advie

2ATR / Current Price %### **Real-Time 2ATR Volatility Ratio Indicator**
---
### **Overview**
This indicator provides a quick and visual way to understand market volatility by calculating the ratio between the **2ATR (Average True Range)** and the **current price**.
* **ATR (Average True Range)** is a widely-used measure of market volatility, showing the average price movement over a specific period.
* **2ATR** represents a price move that is twice the average volatility. Traders often use this value as a benchmark for potential support/resistance levels or for setting a dynamic stop-loss.
### **Key Features**
* **Real-Time Calculation**: Unlike many indicators that rely on the previous candle's close, this script calculates the 2ATR ratio using the **real-time current price**, providing you with up-to-the-second data.
* **Intuitive Display**: The final percentage value is shown in a clear **yellow label** at the **bottom-right** of your chart, making it easy to monitor without cluttering your view.
* **Customizable Input**: You can adjust the `ATR Period` setting to change the sensitivity of the volatility calculation, allowing you to adapt the indicator to different trading styles and timeframes.
### **How to Use It**
This tool is especially useful for **risk management and setting stop-loss orders**. The percentage displayed on the label tells you how much the price would need to move from its current level to equal a 2ATR change.
**Example**: If the indicator shows **3.5%**, it means a price drop of 3.5% from the current level would be equal to a 2ATR move. This gives you a clear and quantifiable number to help you set a **logical stop-loss** or to quickly assess the potential downside risk before entering a trade.

Bias + VWAP Pullback — v4 (PA + BOS/CHOCH)Simple idea: I identify the trend (bias) from the larger timeframe, and only trade pullbacks to the VWAP/EMA during liquidity (London/New York). When the trend is clear, gold moves strongly, and its pullbacks to the balance lines provide clear opportunities.
Timeframe and Sessions (Cairo Time)
Analysis: H1 to determine the trend.
Implementation: 5m (or 1m if professional).
Trading window:
London Opening: 10:00–12:30
New York Opening: 16:30–19:00
(avoid the rest of the day unless there is exceptional traffic).
Direction determination (BIAS)
On H1:
If the price is above the 200 EMA and the daily VWAP is bullish and the price is above it → uptrend (long-only).
If the price is below the 200 EMA and the daily VWAP is bearish and the price is below it → bearish trend (short-only).
Determine your levels: yesterday's high/low (PDH/PDL) + approximate Asia range (03:00–09:30).
Entry Rules (Setup A: Trend Continuation)
Asia range breakout towards Bias during liquidity window.
Wait for a withdrawal to:
Daily VWAP, or
EMA50 on 5m frame (best if both cross).
Confirmation: Confirmation low/high on 5m (HL buy/LH sell) + clear impulse candle (Body is greater than average of last 10 candles).
Entry:
Buy: When the price returns above VWAP/EMA50 with a confirmation candle close.
Sell: The exact opposite.
Stop Loss (SL): Below/above the last confirmation low/high or ATR(14, 5m) x 1.5 (largest).
Objectives:
TP1 = 1R (Close 50% and move the rest Break-even).
TP2 = 2.5R to 3R or at an important HTF level (PDH/PDL/Bid/Demand Zone).
Entry Rules (Setup B: Reversion to VWAP – “Mean Reversion”)
Use with extreme caution, once daily maximum:
Price deviation from VWAP by more than ~1.5 x ATR(14, 5m) with rejection candles appearing near PDH/PDL.
Reverse entry towards the return of VWAP.
SL small behind rejection top/bottom.
Main target: VWAP. (Don't get greedy — this scenario is for extended periods only.)
News Filtering and Risk Management
Avoid trading 15–30 minutes before/after strong US news (CPI, NFP, FOMC).
Maximum daily loss: 1.5–2% of account balance.
Risk per trade: 0.25–0.5% (if you are learning) or 0.5–1% (if you are experienced).
Do not exceed two consecutive losing trades per day.
Don't chase the market after the opportunity has passed — wait for the next pullback.
Smart Deal Management
After TP1: Move stop to entry point + trail the rest with EMA20 on 5m or ATR Trailing = ATR(14)×1.0.
If the price touches a strong daily level (PDH/PDL) and fails to break, consider taking additional profit.
If VWAP starts to flatten and breaks against the trend on H1, stop trading for the day.
Quick Checklist (Before Entry)
H1 trend is clear and consistent with 200EMA + VWAP.
Penetrating the Asia range towards Bias.
Clean pull to VWAP/EMA50 on 5m.
Confirmation candle and real push.
SL is logical (behind swing/ATR×1.5) and R :R ≥ 1:2.
No red news coming soon.
Example of "ready-made" settings
EMA: 20, 50, 200 on 5m, 200 only on H1.
VWAP: Daily (reset daily).
ATR: 14 on 5m.
Levels: PDH/PDL + Asia Band (03:00–09:30 Cairo).
Gold Notes
Gold is fast and sharp at the open; don't get in early — wait for the draw.
Fakeouts are common before news: it is best to call with the trend after the price returns above/below VWAP.
Don't expect 80% consistent wins every day — the advantage comes from discipline, filtering out bad days, and only withdrawing when you're on the right track.
تعتبر شركة الماسة الألمانية أحد المؤسسات العاملة بالمملكة العربية السعودية ولها تاريخ طويل من الخدمات الكثيرة والمتنوعة التى مازالت تقدمها للكثير من العملاء داخل جميع مدن وأحياء المملكة حيث نقدم أفضل ما لدينا من خلال مجموعة الشركات التالية والتي من خلالها ستتلقي كل ما تحتاج إلية في كل المجال المختلفة فنحن نعمل منذ عام 2015 ولنا سابقات اعمال فى مختلف المجالات الحيوية التى نخدم من خلالها عملائنا ونوفر لهم أرخص الأسعار وبأعلى جودة من الممكن توفرها فى المجالات التالية :-
خدمات تنظيف المنازل والفلل والشقق
خدمات عزل الخزانات تنظيف غسيل صيانة اصلاح
خدمات جلي البلاط والرخام والسيراميك
خدمات نقل العفش عمالة فلبينية مدربة
خدمات مكافحة الحشرات بجدة
كل هذة الخدمات وأكثر نوفرها لكل المتعاقدين بأفضل الطرق مع توفير خطط وبرامج متنوعة لأتمام العمل المسنود إلينا بأفضل وأحدث الطرق الحديثة والعصرية سواء فى شركات النظافة بجدة ومكة المكرمة أو شركات نقل العفش بجدة عمالة فلبينية وباقى الخدمات مثل جلي وتلميع الرخام بمكة وجدة ولا ننسي شركة مكافحة حشرات بجدة التى ساعدت آلاف المواطنين على تنظيف منازلهم من الحشرات بأفضل مبيدات حشرية.

Turtle Trading with LayeringCrafted professional write-up for TradingView indicator publication.
Turtle Trading with Layering System
A complete implementation of the famous turtle trading strategy with proper position layering/pyramiding for manual trading.
Features
Core Turtle System:
20-day breakout entries (primary signals)
55-day breakout entries (backup after losses)
10-day reverse breakout exits
ATR-based stop losses and position sizing
Position Layering:
Build positions gradually as trends develop
Add up to 4 units per position
Each unit added every 0.5 ATR in your favor
Single stop loss protects entire position
