TimeLibraryLibrary "TimeLibrary"
TODO: add library description here
Line_Type_Control(Type)
Line_Type_Control: This function changes between common line types options available are "Solid","Dashed","Dotted"
Parameters:
Type (string) : : The string to choose the line type from
Returns: Line_Type : returns the pine script equivalent of the string input
Text_Size_Switch(Text_Size)
Text_Size_Switch : This function changes between common text sizes options are "Normal", "Tiny", "Small", "Large", "Huge", "Auto"
Parameters:
Text_Size (string) : : The string to choose the text type from
Returns: Text_Type : returns the pine script equivalent of the string input
TF(TF_Period, TF_Multip)
TF generates a string representation of a time frame based on the provided time frame unit (`TF_Period`) and multiplier (`TF_Multip`).
Parameters:
TF_Period (simple string)
TF_Multip (simple int)
Returns: A string that represents the time frame in Pine Script format, depending on the `TF_Period`:
- For "Minute", it returns the multiplier as a string (e.g., "5" for 5 minutes).
- For "Hour", it returns the equivalent number of minutes (e.g., "120" for 2 hours).
- For "Day", it appends "D" to the multiplier (e.g., "2D" for 2 days).
- For "Week", it appends "W" to the multiplier (e.g., "1W" for 1 week).
- For "Month", it appends "M" to the multiplier (e.g., "3M" for 3 months).
If none of these cases match, it returns the current chart's time frame.
TF_Display(Chart_as_Timeframe, TF_Period, TF_Multip)
TF_Display generates a string representation of a time frame based on user-defined inputs or the current chart's time frame settings.
Parameters:
Chart_as_Timeframe (bool) : (bool): Determines whether to use the current chart's time frame or a custom time frame.
TF_Period` (string): The time frame unit (e.g., "Minute", "Hour", "Day", "Week", "Month").
TF_Multip` (int): The multiplier for the time frame (e.g., 15 for 15 minutes, 2 for 2 days).
TF_Period (string)
TF_Multip (int)
Returns: If `Chart_as_Timeframe` is `false`, the function returns a time frame string based on the provided `TF_Period` and `TF_Multip` values (e.g., "5Min", "2D").
If `Chart_as_Timeframe` is `true`, the function determines the current chart's time frame and returns it as a string:
For minute-based time frames, it returns the number of minutes with "Min" (e.g., "15Min") unless it's an exact hour, in which case it returns the hour (e.g., "1H").
For daily, weekly, and monthly time frames, it returns the multiplier with the appropriate unit (e.g., "1D" for daily, "1W" for weekly, "1M" for monthly).
MTF_MS_Display(Chart_as_Timeframe, TF_Period, TF_Multip, Swing_Length)
MTF_MS_Display This function calculates and returns a modified swing length value based on the selected time frame and current chart's time frame.
Parameters:
Chart_as_Timeframe (bool)
TF_Period (string)
TF_Multip (int)
Swing_Length (int)
HTF_Structure_Control(Chart_as_Timeframe, Show_Only_On_Lower_Timeframes, TF_Period, TF_Multip)
Parameters:
Chart_as_Timeframe (bool)
Show_Only_On_Lower_Timeframes (bool)
TF_Period (string)
TF_Multip (int)
Tìm kiếm tập lệnh với "text"

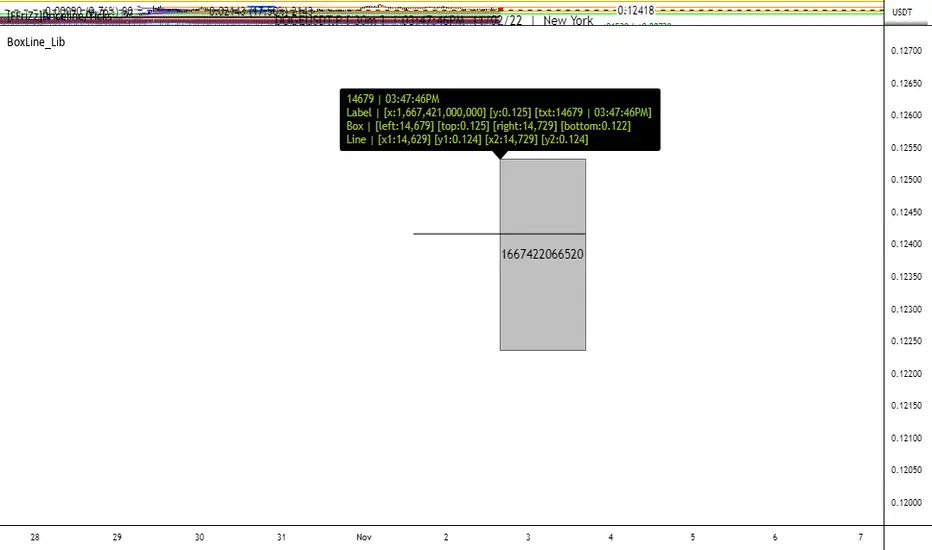
BoxLine_LibLibrary "BoxLine_Lib"
personal Library for line and box built in functions
lineXY(x)
get x1,y1,x2,y2 in a tuple
Parameters:
x : TODO: line
Returns: tuple of x1,y1,x2,y2
line(x)
Create line with only the y1 value(when line == na) or all
when line != na set x1,y1,x2,y2 individually just 1 or all
- use just the line value to set the x2 to current bar or time will set to time
- will auto pick xloc.bar_index or xloc.bar_time if not used
Parameters:
x : (line line,int x1,float y1,int x2,float y2,
string xloc,string extend,color color,string style,int width)
Returns: Line
boxXY(x)
get left,top,right,bottom in a tuple
Parameters:
x : box
Returns: tuple of left,top,right,bottom
box(x)
Create line with only the top,bottom value(when line == na) or all
when box != na set left,top,right,bottom individually just 1 or all
- use just the box value to set the right to current bar or time will set to time
- if right is above a number that a bar_index wouldnt be
Parameters:
x : box box,int left,float top,int right,
float bottom,color border_color, int border_width,
string border_style,string extend,string xloc,
color bgcolor,string text,string text_size, color text_color,
string text_halign,string text_valign,string text_wrap)
Returns: TODO: Box
Mars Signals - Ultimate Institutional Suite v3.0(Joker)Comprehensive Trading Manual
Mars Signals – Ultimate Institutional Suite v3.0 (Joker)
## Chapter 1 – Philosophy & System Architecture
This script is not a simple “buy/sell” indicator.
Mars Signals – UIS v3.0 (Joker) is designed as an institutional-style analytical assistant that layers several methodologies into a single, coherent framework.
The system is built on four core pillars:
1. Smart Money Concepts (SMC)
- Detection of Order Blocks (professional demand/supply zones).
- Detection of Fair Value Gaps (FVGs) (price imbalances).
2. Smart DCA Strategy
- Combination of RSI and Bollinger Bands
- Identifies statistically discounted zones for scaling into spot positions or exiting shorts.
3. Volume Profile (Visible Range Simulation)
- Distribution of volume by price, not by time.
- Identification of POC (Point of Control) and high-/low-volume areas.
4. Wyckoff Helper – Spring
- Detection of bear traps, liquidity grabs, and sharp bullish reversals.
All four pillars feed into a Confluence Engine (Scoring System).
The final output is presented in the Dashboard, with a clear, human-readable signal:
- STRONG LONG 🚀
- WEAK LONG ↗
- NEUTRAL / WAIT
- WEAK SHORT ↘
- STRONG SHORT 🩸
This allows the trader to see *how many* and *which* layers of the system support a bullish or bearish bias at any given time.
## Chapter 2 – Settings Overview
### 2.1 General & Dashboard Group
- Show Dashboard Panel (`show_dash`)
Turns the dashboard table in the corner of the chart ON/OFF.
- Show Signal Recommendation (`show_rec`)
- If enabled, the textual signal (STRONG LONG, WEAK SHORT, etc.) is displayed.
- If disabled, you only see feature status (ON/OFF) and the current price.
- Dashboard Position (`dash_pos`)
Determines where the dashboard appears on the chart:
- `Top Right`
- `Bottom Right`
- `Top Left`
### 2.2 Smart Money (SMC) Group
- Enable SMC Strategy (`show_smc`)
Globally enables or disables the Order Block and FVG logic.
- Order Block Pivot Lookback (`ob_period`)
Main parameter for detecting key pivot highs/lows (swing points).
- Default value: 5
- Concept:
A bar is considered a pivot low if its low is lower than the lows of the previous 5 and the next 5 bars.
Similarly, a pivot high has a high higher than the previous 5 and the next 5 bars.
These pivots are used as anchors for Order Blocks.
- Increasing `ob_period`:
- Fewer levels.
- But levels tend to be more significant and reliable.
- In highly volatile markets (major news, war events, FOMC, etc.),
using values 7–10 is recommended to filter out weak levels.
- Show Fair Value Gaps (`show_fvg`)
Enables/disables the drawing of FVG zones (imbalances).
- Bullish OB Color (`c_ob_bull`)
- Color of Bullish Order Blocks (Demand Zones).
- Default: semi-transparent green (transparency ≈ 80).
- Bearish OB Color (`c_ob_bear`)
- Color of Bearish Order Blocks (Supply Zones).
- Default: semi-transparent red.
- Bullish FVG Color (`c_fvg_bull`)
- Color of Bullish FVG (upward imbalance), typically yellow.
- Bearish FVG Color (`c_fvg_bear`)
- Color of Bearish FVG (downward imbalance), typically purple.
### 2.3 Smart DCA Strategy Group
- Enable DCA Zones (`show_dca`)
Enables the Smart DCA logic and visual labels.
- RSI Length (`rsi_len`)
Lookback period for RSI (default: 14).
- Shorter → more sensitive, more noise.
- Longer → fewer signals, higher reliability.
- Bollinger Bands Length (`bb_len`)
Moving average period for Bollinger Bands (default: 20).
- BB Multiplier (`bb_mult`)
Standard deviation multiplier for Bollinger Bands (default: 2.0).
- For extremely volatile markets, values like 2.5–3.0 can be used so that only extreme deviations trigger a DCA signal.
### 2.4 Volume Profile (Visible Range Sim) Group
- Show Volume Profile (`show_vp`)
Enables the simulated Volume Profile bars on the right side of the chart.
- Volume Lookback Bars (`vp_lookback`)
Number of bars used to compute the Volume Profile (default: 150).
- Higher values → broader historical context, heavier computation.
- Row Count (`vp_rows`)
Number of vertical price segments (rows) to divide the total price range into (default: 30).
- Width (%) (`vp_width`)
Relative width of each volume bar as a percentage.
In the code, bar widths are scaled relative to the row with the maximum volume.
> Technical note: Volume Profile calculations are executed only on the last bar (`barstate.islast`) to keep the script performant even on higher timeframes.
### 2.5 Wyckoff Helper Group
- Show Wyckoff Events (`show_wyc`)
Enables detection and plotting of Wyckoff Spring events.
- Volume MA Length (`vol_ma_len`)
Length of the moving average on volume.
A bar is considered to have Ultra Volume if its volume is more than 2× the volume MA.
## Chapter 3 – Smart Money Strategy (Order Blocks & FVG)
### 3.1 What Is an Order Block?
An Order Block (OB) represents the footprint of large institutional orders:
- Bullish Order Block (Demand Zone)
The last selling region (bearish candle/cluster) before a strong upward move.
- Bearish Order Block (Supply Zone)
The last buying region (bullish candle/cluster) before a strong downward move.
Institutions and large players place heavy orders in these regions. Typical price behavior:
- Price moves away from the zone.
- Later returns to the same zone to fill unfilled orders.
- Then continues the larger trend.
In the script:
- If `pl` (pivot low) forms → a Bullish OB is created.
- If `ph` (pivot high) forms → a Bearish OB is created.
The box is drawn:
- From `bar_index ` to `bar_index`.
- Between `low ` and `high `.
- `extend=extend.right` extends the OB into the future, so it acts as a dynamic support/resistance zone.
- Only the last 4 OB boxes are kept to avoid clutter.
### 3.2 Order Block Color Guide
- Semi-transparent Green (`c_ob_bull`)
- Represents a Bullish Order Block (Demand Zone).
- Interpretation: a price region with a high probability of bullish reaction.
- Semi-transparent Red (`c_ob_bear`)
- Represents a Bearish Order Block (Supply Zone).
- Interpretation: a price region with a high probability of bearish reaction.
Overlap (Multiple OBs in the Same Area)
When two or more Order Blocks overlap:
- The shared area appears visually denser/stronger.
- This suggests higher order density.
- Such zones can be treated as high-priority levels for entries, exits, and stop-loss placement.
### 3.3 Demand/Supply Logic in the Scoring Engine
is_in_demand = low <= ta.lowest(low, 20)
is_in_supply = high >= ta.highest(high, 20)
- If current price is near the lowest lows of the last 20 bars, it is considered in a Demand Zone → positive impact on score.
- If current price is near the highest highs of the last 20 bars, it is considered in a Supply Zone → negative impact on score.
This logic complements Order Blocks and helps the Dashboard distinguish whether:
- Market is currently in a statistically cheap (long-friendly) area, or
- In a statistically expensive (short-friendly) area.
### 3.4 Fair Value Gaps (FVG)
#### Concept
When the market moves aggressively:
- Some price levels are skipped and never traded.
- A gap between wicks/shadows of consecutive candles appears.
- These regions are called Fair Value Gaps (FVGs) or Imbalances.
The market generally “dislikes” imbalance and often:
- Returns to these zones in the future.
- Fills the gap (rebalance).
- Then resumes its dominant direction.
#### Implementation in the Code
Bullish FVG (Yellow)
fvg_bull_cond = show_smc and show_fvg and low > high and close > high
if fvg_bull_cond
box.new(bar_index , high , bar_index, low, ...)
Core condition:
`low > high ` → the current low is above the high of two bars ago; the space between them is an untraded gap.
Bearish FVG (Purple)
fvg_bear_cond = show_smc and show_fvg and high < low and close < low
if fvg_bear_cond
box.new(bar_index , low , bar_index, high, ...)
Core condition:
`high < low ` → the current high is below the low of two bars ago; again a price gap exists.
#### FVG Color Guide
- Transparent Yellow (`c_fvg_bull`) – Bullish FVG
Often acts like a magnet for price:
- Price tends to retrace into this zone,
- Fill the imbalance,
- And then continue higher.
- Transparent Purple (`c_fvg_bear`) – Bearish FVG
Price tends to:
- Retrace upward into the purple area,
- Fill the imbalance,
- And then resume downward movement.
#### Trading with FVGs
- FVGs are *not* standalone entry signals.
They are best used as:
- Targets (take-profit zones), or
- Reaction areas where you expect a pause or reversal.
Examples:
- If you are long, a bearish FVG above is often an excellent take-profit zone.
- If you are short, a bullish FVG below is often a good cover/exit zone.
### 3.5 Core SMC Trading Templates
#### Reversal Long
1. Price trades down into a green Order Block (Demand Zone).
2. A bullish confirmation candle (Close > Open) forms inside or just above the OB.
3. If this zone is close to or aligned with a bullish FVG (yellow), the signal is reinforced.
4. Entry:
- At the close of the confirmation candle, or
- Using a limit order near the upper boundary of the OB.
5. Stop-loss:
- Slightly below the OB.
- If the OB is broken decisively and price consolidates below it, the zone loses validity.
6. Targets:
- The next FVG,
- Or the next red Order Block (Supply Zone) above.
#### Reversal Short
The mirror scenario:
- Price rallies into a red Order Block (Supply).
- A bearish confirmation candle forms (Close < Open).
- FVG/premium structure above can act as a confluence.
- Stop-loss goes above the OB.
- Targets: lower FVGs or subsequent green OBs below.
## Chapter 4 – Smart DCA Strategy (RSI + Bollinger Bands)
### 4.1 Smart DCA Concept
- Classic DCA = buying at fixed time intervals regardless of price.
- Smart DCA = scaling in only when:
- Price is statistically cheaper than usual, and
- The market is in a clear oversold condition.
Code logic:
rsi_val = ta.rsi(close, rsi_len)
= ta.bb(close, bb_len, bb_mult)
dca_buy = show_dca and rsi_val < 30 and close < bb_lower
dca_sell = show_dca and rsi_val > 70 and close > bb_upper
Conditions:
- DCA Buy – Smart Scale-In Zone
- RSI < 30 → oversold.
- Close < lower Bollinger Band → price has broken below its typical volatility envelope.
- DCA Sell – Overbought/Distribution Zone
- RSI > 70 → overbought.
- Close > upper Bollinger Band → price is extended far above the mean.
### 4.2 Visual Representation on the Chart
- Green “DCA” Label Below Candle
- Shape: `labelup`.
- Color: lime background, white text.
- Meaning: statistically attractive level for laddered spot entries or short exits.
- Red “SELL” Label Above Candle
- Warning that the market is in an extended, overbought condition.
- Suitable for profit-taking on longs or considering short entries (with proper confluence and risk management).
- Light Green Background (`bgcolor`)
- When `dca_buy` is true, the candle background turns very light green (high transparency).
- This helps visually identify DCA Zones across the chart at a glance.
### 4.3 Practical Use in Trading
#### Spot Trading
Used to build a better average entry price:
- Every time a DCA label appears, allocate a fixed portion of capital (e.g., 2–5%).
- Combining DCA signals with:
- Green OBs (Demand Zones), and/or
- The Volume Profile POC
makes the zone structurally more important.
#### Futures Trading
- Longs
- Use DCA Buy signals as low-risk zones for opening or adding to longs when:
- Price is inside a green OB, or
- The Dashboard already leans LONG.
- Shorts
- Use DCA Sell signals as:
- Exit zones for longs, or
- Areas to initiate shorts with stops above structural highs.
## Chapter 5 – Volume Profile (Visible Range Simulation)
### 5.1 Concept
Traditional volume (histogram under the chart) shows volume over time.
Volume Profile shows volume by price level:
- At which prices has the highest trading activity occurred?
- Where did buyers and sellers agree the most (High Volume Nodes – HVNs)?
- Where did price move quickly due to low participation (Low Volume Nodes – LVNs)?
### 5.2 Implementation in the Script
Executed only when `show_vp` is enabled and on the last bar:
1. The last `vp_lookback` bars (default 150) are processed.
2. The minimum low and maximum high over this window define the price range.
3. This price range is divided into `vp_rows` segments (e.g., 30 rows).
4. For each row:
- All bars are scanned.
- If the mid-price `(high + low ) / 2` falls inside a row, that bar’s volume is added to the row total.
5. The row with the greatest volume is stored as `max_vol_idx` (the POC row).
6. For each row, a volume box is drawn on the right side of the chart.
### 5.3 Color Scheme
- Semi-transparent Orange
- The row with the maximum volume – the Point of Control (POC).
- Represents the strongest support/resistance level from a volume perspective.
- Semi-transparent Blue
- Other volume rows.
- The taller the bar → the higher the volume → the stronger the interest at that price band.
### 5.4 Trading Applications
- If price is above POC and retraces back into it:
→ POC often acts as support, suitable for long setups.
- If price is below POC and rallies into it:
→ POC often acts as resistance, suitable for short setups or profit-taking.
HVNs (Tall Blue Bars)
- Represent areas of equilibrium where the market has spent time and traded heavily.
- Price tends to consolidate here before choosing a direction.
LVNs (Short or Nearly Empty Bars)
- Represent low participation zones.
- Price often moves quickly through these areas – useful for targeting fast moves.
## Chapter 6 – Wyckoff Helper – Spring
### 6.1 Spring Concept
In the Wyckoff framework:
- A Spring is a false break of support.
- The market briefly trades below a well-defined support level, triggers stop losses,
then sharply reverses upward as institutional buyers absorb liquidity.
This movement:
- Clears out weak hands (retail sellers).
- Provides large players with liquidity to enter long positions.
- Often initiates a new uptrend.
### 6.2 Code Logic
Conditions for a Spring:
1. The current low is lower than the lowest low of the previous 50 bars
→ apparent break of a long-standing support.
2. The bar closes bullish (Close > Open)
→ the breakdown was rejected.
3. Volume is significantly elevated:
→ `volume > 2 × volume_MA` (Ultra Volume).
When all conditions are met and `show_wyc` is enabled:
- A pink diamond is plotted below the bar,
- With the label “Spring” – one of the strongest long signals in this system.
### 6.3 Trading Use
- After a valid Spring, markets frequently enter a meaningful bullish phase.
- The highest quality setups occur when:
- The Spring forms inside a green Order Block, and
- Near or on the Volume Profile POC.
Entries:
- At the close of the Spring bar, or
- On the first pullback into the mid-range of the Spring candle.
Stop-loss:
- Slightly below the Spring’s lowest point (wick low plus a small buffer).
## Chapter 7 – Confluence Engine & Dashboard
### 7.1 Scoring Logic
For each bar, the script:
1. Resets `score` to 0.
2. Adjusts the score based on different signals.
SMC Contribution
if show_smc
if is_in_demand
score += 1
if is_in_supply
score -= 1
- Being in Demand → `+1`
- Being in Supply → `-1`
DCA Contribution
if show_dca
if dca_buy
score += 2
if dca_sell
score -= 2
- DCA Buy → `+2` (strong, statistically driven long signal)
- DCA Sell → `-2`
Wyckoff Spring Contribution
if show_wyc
if wyc_spring
score += 2
- Spring → `+2` (entry of strong money)
### 7.2 Mapping Score to Dashboard Signal
- score ≥ 2 → STRONG LONG 🚀
Multiple bullish conditions aligned.
- score = 1 → WEAK LONG ↗
Some bullish bias, but only one layer clearly positive.
- score = 0 → NEUTRAL / WAIT
Rough balance between buying and selling forces; staying flat is usually preferable.
- score = -1 → WEAK SHORT ↘
Mild bearish bias, suited for cautious or short-term plays.
- score ≤ -2 → STRONG SHORT 🩸
Convergence of several bearish signals.
### 7.3 Dashboard Structure
The dashboard is a two-column table:
- Row 0
- Column 0: `"Mars Signals"` – black background, white text.
- Column 1: `"UIS v3.0"` – black background, yellow text.
- Row 1
- Column 0: `"Price:"` (light grey background).
- Column 1: current closing price (`close`) with a semi-transparent blue background.
- Row 2
- Column 0: `"SMC:"`
- Column 1:
- `"ON"` (green) if `show_smc = true`
- `"OFF"` (grey) otherwise.
- Row 3
- Column 0: `"DCA:"`
- Column 1:
- `"ON"` (green) if `show_dca = true`
- `"OFF"` (grey) otherwise.
- Row 4
- Column 0: `"Signal:"`
- Column 1: signal text (`status_txt`) with background color `status_col`
(green, red, teal, maroon, etc.)
- If `show_rec = false`, these cells are cleared.
## Chapter 8 – Visual Legend (Colors, Shapes & Actions)
For quick reading inside TradingView, the visual elements are described line by line instead of a table.
Chart Element: Green Box
Color / Shape: Transparent green rectangle
Core Meaning: Bullish Order Block (Demand Zone)
Suggested Trader Response: Look for longs, Smart DCA adds, closing or reducing shorts.
Chart Element: Red Box
Color / Shape: Transparent red rectangle
Core Meaning: Bearish Order Block (Supply Zone)
Suggested Trader Response: Look for shorts, or take profit on existing longs.
Chart Element: Yellow Area
Color / Shape: Transparent yellow zone
Core Meaning: Bullish FVG / upside imbalance
Suggested Trader Response: Short take-profit zone or expected rebalance area.
Chart Element: Purple Area
Color / Shape: Transparent purple zone
Core Meaning: Bearish FVG / downside imbalance
Suggested Trader Response: Long take-profit zone or temporary supply region.
Chart Element: Green "DCA" Label
Color / Shape: Green label with white text, plotted below the candle
Core Meaning: Smart ladder-in buy zone, DCA buy opportunity
Suggested Trader Response: Spot DCA entry, partial short exit.
Chart Element: Red "SELL" Label
Color / Shape: Red label with white text, plotted above the candle
Core Meaning: Overbought / distribution zone
Suggested Trader Response: Take profit on longs, consider initiating shorts.
Chart Element: Light Green Background (bgcolor)
Color / Shape: Very transparent light-green background behind bars
Core Meaning: Active DCA Buy zone
Suggested Trader Response: Treat as a discount zone on the chart.
Chart Element: Orange Bar on Right
Color / Shape: Transparent orange horizontal bar in the volume profile
Core Meaning: POC – price with highest traded volume
Suggested Trader Response: Strong support or resistance; key reference level.
Chart Element: Blue Bars on Right
Color / Shape: Transparent blue horizontal bars in the volume profile
Core Meaning: Other volume levels, showing high-volume and low-volume nodes
Suggested Trader Response: Use to identify balance zones (HVN) and fast-move corridors (LVN).
Chart Element: Pink "Spring" Diamond
Color / Shape: Pink diamond with white text below the candle
Core Meaning: Wyckoff Spring – liquidity grab and potential major bullish reversal
Suggested Trader Response: One of the strongest long signals in the suite; look for high-quality long setups with tight risk.
Chart Element: STRONG LONG in Dashboard
Color / Shape: Green background, white text in the Signal row
Core Meaning: Multiple bullish layers in confluence
Suggested Trader Response: Consider initiating or increasing longs with strict risk management.
Chart Element: STRONG SHORT in Dashboard
Color / Shape: Red background, white text in the Signal row
Core Meaning: Multiple bearish layers in confluence
Suggested Trader Response: Consider initiating or increasing shorts with a logical, well-placed stop.
## Chapter 9 – Timeframe-Based Trading Playbook
### 9.1 Timeframe Selection
- Scalping
- Timeframes: 1M, 5M, 15M
- Objective: fast intraday moves (minutes to a few hours).
- Recommendation: focus on SMC + Wyckoff.
Smart DCA on very low timeframes may introduce excessive noise.
- Day Trading
- Timeframes: 15M, 1H, 4H
- Provides a good balance between signal quality and frequency.
- Recommendation: use the full stack – SMC + DCA + Volume Profile + Wyckoff + Dashboard.
- Swing Trading & Position Investing
- Timeframes: Daily, Weekly
- Emphasis on Smart DCA + Volume Profile.
- SMC and Wyckoff are used mainly to fine-tune swing entries within larger trends.
### 9.2 Scenario A – Scalping Long
Example: 5-Minute Chart
1. Price is declining into a green OB (Bullish Demand).
2. A candle with a long lower wick and bullish close (Pin Bar / Rejection) forms inside the OB.
3. A Spring diamond appears below the same candle → very strong confluence.
4. The Dashboard shows at least WEAK LONG ↗, ideally STRONG LONG 🚀.
5. Entry:
- On the close of the confirmation candle, or
- On the first pullback into the mid-range of that candle.
6. Stop-loss:
- Slightly below the OB.
7. Targets:
- Nearby bearish FVG above, and/or
- The next red OB.
### 9.3 Scenario B – Day-Trading Short
Recommended Timeframes: 1H or 4H
1. The market completes a strong impulsive move upward.
2. Price enters a red Order Block (Supply).
3. In the same zone, a purple FVG appears or remains unfilled.
4. On a lower timeframe (e.g., 15M), RSI enters overbought territory and a DCA Sell signal appears.
5. The main timeframe Dashboard (1H) shows WEAK SHORT ↘ or STRONG SHORT 🩸.
Trade Plan
- Open a short near the upper boundary of the red OB.
- Place the stop above the OB or above the last swing high.
- Targets:
- A yellow FVG lower on the chart, and/or
- The next green OB (Demand) below.
### 9.4 Scenario C – Swing / Investment with Smart DCA
Timeframes: Daily / Weekly
1. On the daily or weekly chart, each time a green “DCA” label appears:
- Allocate a fixed fraction of your capital (e.g., 3–5%) to that asset.
2. Check whether this DCA zone aligns with the orange POC of the Volume Profile:
- If yes → the quality of the entry zone is significantly higher.
3. If the DCA signal sits inside a daily green OB, the probability of a medium-term bottom increases.
4. Always build the position laddered, never all-in at a single price.
Exits for investors:
- Near weekly red OBs or large purple FVG zones.
- Ideally via partial profit-taking rather than closing 100% at once.
### 9.5 Case Study 1 – BTCUSDT (15-Minute)
- Context: Price has sold off down towards 65,000 USD.
- A green OB had previously formed at that level.
- Near the lower boundary of this OB, a partially filled yellow FVG is present.
- As price returns to this region, a Spring appears.
- The Dashboard shifts from NEUTRAL / WAIT to WEAK LONG ↗.
Plan
- Enter a long near the OB low.
- Place stop below the Spring low.
- First target: a purple FVG around 66,200.
- Second (optional) target: the first red OB above that level.
### 9.6 Case Study 2 – Meme Coin (PEPE – 4H)
- After a strong pump, price enters a corrective phase.
- On the 4H chart, RSI drops below 30; price breaks below the lower Bollinger Band → a DCA label prints.
- The Volume Profile shows the POC at approximately the same level.
- The Dashboard displays STRONG LONG 🚀.
Plan
- Execute laddered buys in the combined DCA + POC zone.
- Place a protective stop below the last significant swing low.
- Target: an expected 20–30% upside move towards the next red OB or purple FVG.
## Chapter 10 – Risk Management, Psychology & Advanced Tuning
### 10.1 Risk Management
No signal, regardless of its strength, replaces risk control.
Recommendations:
- In futures, do not expose more than 1–3% of account equity to risk per trade.
- Adjust leverage to the volatility of the instrument (lower leverage for highly volatile altcoins).
- Place stop-losses in zones where the idea is clearly invalidated:
- Below/above the relevant Order Block or Spring, not randomly in the middle of the structure.
### 10.2 Market-Specific Parameter Tuning
- Calmer Markets (e.g., major FX pairs)
- `ob_period`: 3–5.
- `bb_mult`: 2.0 is usually sufficient.
- Highly Volatile Markets (Crypto, news-driven assets)
- `ob_period`: 7–10 to highlight only the most robust OBs.
- `bb_mult`: 2.5–3.0 so that only extreme deviations trigger DCA.
- `vol_ma_len`: increase (e.g., to ~30) so that Spring triggers only on truly exceptional
volume spikes.
### 10.3 Trading Psychology
- STRONG LONG 🚀 does not mean “risk-free”.
It means the probability of a successful long, given the model’s logic, is higher than average.
- Treat Mars Signals as a confirmation and context system, not a full replacement for your own decision-making.
- Example of disciplined thinking:
- The Dashboard prints STRONG LONG,
- But price is simultaneously testing a multi-month macro resistance or a major negative news event is imminent,
- In such cases, trade smaller, widen stops appropriately, or skip the trade.
## Chapter 11 – Technical Notes & FAQ
### 11.1 Does the Script Repaint?
- Order Blocks and Springs are based on completed pivot structures and confirmed candles.
- Until a pivot is confirmed, an OB does not exist; after confirmation, behavior is stable under classic SMC assumptions.
- The script is designed to be structurally consistent rather than repainting signals arbitrarily.
### 11.2 Computational Load of Volume Profile
- On the last bar, the script processes up to `vp_lookback` bars × `vp_rows` rows.
- On very low timeframes with heavy zooming, this can become demanding.
- If you experience performance issues:
- Reduce `vp_lookback` or `vp_rows`, or
- Temporarily disable Volume Profile (`show_vp = false`).
### 11.3 Multi-Timeframe Behavior
- This version of the script is not internally multi-timeframe.
All logic (OB, DCA, Spring, Volume Profile) is computed on the active timeframe only.
- Practical workflow:
- Analyze overall structure and key zones on higher timeframes (4H / Daily).
- Use lower timeframes (15M / 1H) with the same tool for timing entries and exits.
## Conclusion
Mars Signals – Ultimate Institutional Suite v3.0 (Joker) is a multi-layer trading framework that unifies:
- Price structure (Order Blocks & FVG),
- Statistical behavior (Smart DCA via RSI + Bollinger),
- Volume distribution by price (Volume Profile with POC, HVN, LVN),
- Liquidity events (Wyckoff Spring),
into a single, coherent system driven by a transparent Confluence Scoring Engine.
The final output is presented in clear, actionable language:
> STRONG LONG / WEAK LONG / NEUTRAL / WEAK SHORT / STRONG SHORT
The system is designed to support professional decision-making, not to replace it.
Used together with strict risk management and disciplined execution,
Mars Signals – UIS v3.0 (Joker) can serve as a central reference manual and operational guide
for your trading workflow, from scalping to swing and investment positioning.

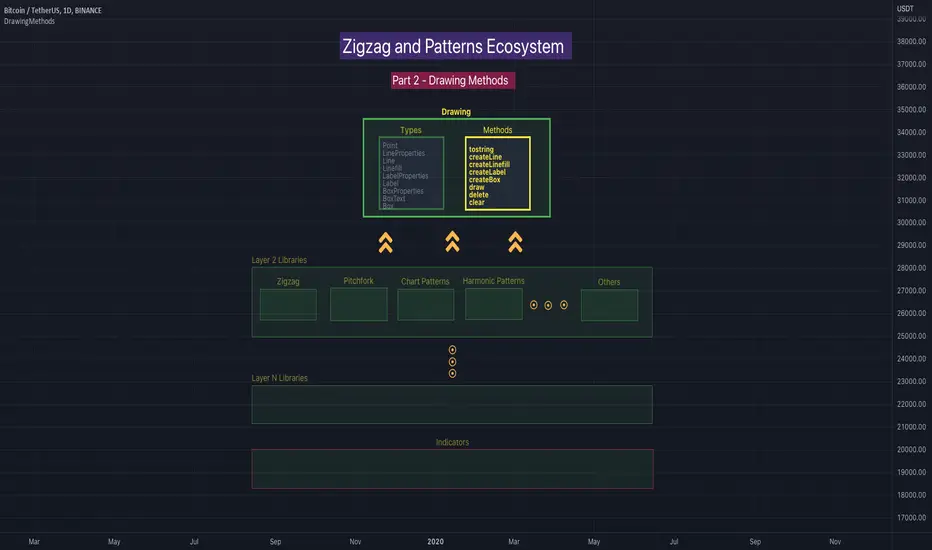
DrawingMethodsLibrary "DrawingMethods"
tostring(this, sortKeys, sortOrder, includeKeys)
Converts DrawingTypes/Point object to string representation
Parameters:
this : DrawingTypes/Point object
sortKeys : If set to true, string output is sorted by keys.
sortOrder : Applicable only if sortKeys is set to true. Positive number will sort them in ascending order whreas negative numer will sort them in descending order. Passing 0 will not sort the keys
includeKeys : Array of string containing selective keys. Optional parmaeter. If not provided, all the keys are considered
Returns: string representation of DrawingTypes/Point
tostring(this, sortKeys, sortOrder, includeKeys)
Converts DrawingTypes/LineProperties object to string representation
Parameters:
this : DrawingTypes/LineProperties object
sortKeys : If set to true, string output is sorted by keys.
sortOrder : Applicable only if sortKeys is set to true. Positive number will sort them in ascending order whreas negative numer will sort them in descending order. Passing 0 will not sort the keys
includeKeys : Array of string containing selective keys. Optional parmaeter. If not provided, all the keys are considered
Returns: string representation of DrawingTypes/LineProperties
tostring(this, sortKeys, sortOrder, includeKeys)
Converts DrawingTypes/Line object to string representation
Parameters:
this : DrawingTypes/Line object
sortKeys : If set to true, string output is sorted by keys.
sortOrder : Applicable only if sortKeys is set to true. Positive number will sort them in ascending order whreas negative numer will sort them in descending order. Passing 0 will not sort the keys
includeKeys : Array of string containing selective keys. Optional parmaeter. If not provided, all the keys are considered
Returns: string representation of DrawingTypes/Line
tostring(this, sortKeys, sortOrder, includeKeys)
Converts DrawingTypes/LabelProperties object to string representation
Parameters:
this : DrawingTypes/LabelProperties object
sortKeys : If set to true, string output is sorted by keys.
sortOrder : Applicable only if sortKeys is set to true. Positive number will sort them in ascending order whreas negative numer will sort them in descending order. Passing 0 will not sort the keys
includeKeys : Array of string containing selective keys. Optional parmaeter. If not provided, all the keys are considered
Returns: string representation of DrawingTypes/LabelProperties
tostring(this, sortKeys, sortOrder, includeKeys)
Converts DrawingTypes/Label object to string representation
Parameters:
this : DrawingTypes/Label object
sortKeys : If set to true, string output is sorted by keys.
sortOrder : Applicable only if sortKeys is set to true. Positive number will sort them in ascending order whreas negative numer will sort them in descending order. Passing 0 will not sort the keys
includeKeys : Array of string containing selective keys. Optional parmaeter. If not provided, all the keys are considered
Returns: string representation of DrawingTypes/Label
tostring(this, sortKeys, sortOrder, includeKeys)
Converts DrawingTypes/Linefill object to string representation
Parameters:
this : DrawingTypes/Linefill object
sortKeys : If set to true, string output is sorted by keys.
sortOrder : Applicable only if sortKeys is set to true. Positive number will sort them in ascending order whreas negative numer will sort them in descending order. Passing 0 will not sort the keys
includeKeys : Array of string containing selective keys. Optional parmaeter. If not provided, all the keys are considered
Returns: string representation of DrawingTypes/Linefill
tostring(this, sortKeys, sortOrder, includeKeys)
Converts DrawingTypes/BoxProperties object to string representation
Parameters:
this : DrawingTypes/BoxProperties object
sortKeys : If set to true, string output is sorted by keys.
sortOrder : Applicable only if sortKeys is set to true. Positive number will sort them in ascending order whreas negative numer will sort them in descending order. Passing 0 will not sort the keys
includeKeys : Array of string containing selective keys. Optional parmaeter. If not provided, all the keys are considered
Returns: string representation of DrawingTypes/BoxProperties
tostring(this, sortKeys, sortOrder, includeKeys)
Converts DrawingTypes/BoxText object to string representation
Parameters:
this : DrawingTypes/BoxText object
sortKeys : If set to true, string output is sorted by keys.
sortOrder : Applicable only if sortKeys is set to true. Positive number will sort them in ascending order whreas negative numer will sort them in descending order. Passing 0 will not sort the keys
includeKeys : Array of string containing selective keys. Optional parmaeter. If not provided, all the keys are considered
Returns: string representation of DrawingTypes/BoxText
tostring(this, sortKeys, sortOrder, includeKeys)
Converts DrawingTypes/Box object to string representation
Parameters:
this : DrawingTypes/Box object
sortKeys : If set to true, string output is sorted by keys.
sortOrder : Applicable only if sortKeys is set to true. Positive number will sort them in ascending order whreas negative numer will sort them in descending order. Passing 0 will not sort the keys
includeKeys : Array of string containing selective keys. Optional parmaeter. If not provided, all the keys are considered
Returns: string representation of DrawingTypes/Box
delete(this)
Deletes line from DrawingTypes/Line object
Parameters:
this : DrawingTypes/Line object
Returns: Line object deleted
delete(this)
Deletes label from DrawingTypes/Label object
Parameters:
this : DrawingTypes/Label object
Returns: Label object deleted
delete(this)
Deletes Linefill from DrawingTypes/Linefill object
Parameters:
this : DrawingTypes/Linefill object
Returns: Linefill object deleted
delete(this)
Deletes box from DrawingTypes/Box object
Parameters:
this : DrawingTypes/Box object
Returns: DrawingTypes/Box object deleted
delete(this)
Deletes lines from array of DrawingTypes/Line objects
Parameters:
this : Array of DrawingTypes/Line objects
Returns: Array of DrawingTypes/Line objects
delete(this)
Deletes labels from array of DrawingTypes/Label objects
Parameters:
this : Array of DrawingTypes/Label objects
Returns: Array of DrawingTypes/Label objects
delete(this)
Deletes linefill from array of DrawingTypes/Linefill objects
Parameters:
this : Array of DrawingTypes/Linefill objects
Returns: Array of DrawingTypes/Linefill objects
delete(this)
Deletes boxes from array of DrawingTypes/Box objects
Parameters:
this : Array of DrawingTypes/Box objects
Returns: Array of DrawingTypes/Box objects
clear(this)
clear items from array of DrawingTypes/Line while deleting underlying objects
Parameters:
this : array
Returns: void
clear(this)
clear items from array of DrawingTypes/Label while deleting underlying objects
Parameters:
this : array
Returns: void
clear(this)
clear items from array of DrawingTypes/Linefill while deleting underlying objects
Parameters:
this : array
Returns: void
clear(this)
clear items from array of DrawingTypes/Box while deleting underlying objects
Parameters:
this : array
Returns: void
draw(this)
Creates line from DrawingTypes/Line object
Parameters:
this : DrawingTypes/Line object
Returns: line created from DrawingTypes/Line object
draw(this)
Creates lines from array of DrawingTypes/Line objects
Parameters:
this : Array of DrawingTypes/Line objects
Returns: Array of DrawingTypes/Line objects
draw(this)
Creates label from DrawingTypes/Label object
Parameters:
this : DrawingTypes/Label object
Returns: label created from DrawingTypes/Label object
draw(this)
Creates labels from array of DrawingTypes/Label objects
Parameters:
this : Array of DrawingTypes/Label objects
Returns: Array of DrawingTypes/Label objects
draw(this)
Creates linefill object from DrawingTypes/Linefill
Parameters:
this : DrawingTypes/Linefill objects
Returns: linefill object created
draw(this)
Creates linefill objects from array of DrawingTypes/Linefill objects
Parameters:
this : Array of DrawingTypes/Linefill objects
Returns: Array of DrawingTypes/Linefill used for creating linefills
draw(this)
Creates box from DrawingTypes/Box object
Parameters:
this : DrawingTypes/Box object
Returns: box created from DrawingTypes/Box object
draw(this)
Creates labels from array of DrawingTypes/Label objects
Parameters:
this : Array of DrawingTypes/Label objects
Returns: Array of DrawingTypes/Label objects
createLabel(this, lblText, tooltip, properties)
Creates DrawingTypes/Label object from DrawingTypes/Point
Parameters:
this : DrawingTypes/Point object
lblText : Label text
tooltip : Tooltip text. Default is na
properties : DrawingTypes/LabelProperties object. Default is na - meaning default values are used.
Returns: DrawingTypes/Label object
createLine(this, other, properties)
Creates DrawingTypes/Line object from one DrawingTypes/Point to other
Parameters:
this : First DrawingTypes/Point object
other : Second DrawingTypes/Point object
properties : DrawingTypes/LineProperties object. Default set to na - meaning default values are used.
Returns: DrawingTypes/Line object
createLinefill(this, other, fillColor, transparency)
Creates DrawingTypes/Linefill object from DrawingTypes/Line object to other DrawingTypes/Line object
Parameters:
this : First DrawingTypes/Line object
other : Other DrawingTypes/Line object
fillColor : fill color of linefill. Default is color.blue
transparency : fill transparency for linefill. Default is 80
Returns: Array of DrawingTypes/Linefill object
createBox(this, other, properties, textProperties)
Creates DrawingTypes/Box object from one DrawingTypes/Point to other
Parameters:
this : First DrawingTypes/Point object
other : Second DrawingTypes/Point object
properties : DrawingTypes/BoxProperties object. Default set to na - meaning default values are used.
textProperties : DrawingTypes/BoxText object. Default is na - meaning no text will be drawn
Returns: DrawingTypes/Box object
createBox(this, properties, textProperties)
Creates DrawingTypes/Box object from DrawingTypes/Line as diagonal line
Parameters:
this : Diagonal DrawingTypes/PoLineint object
properties : DrawingTypes/BoxProperties object. Default set to na - meaning default values are used.
textProperties : DrawingTypes/BoxText object. Default is na - meaning no text will be drawn
Returns: DrawingTypes/Box object
Candlestick Themes NYSE Pro [GPXalgo]The Critical Role of Color in Trading Performance
Professional trading environments demand visual systems that support rapid decision-making while
minimizing cognitive load and visual fatigue. The NYSE trading desk color schemes have evolved
through decades of refinement, incorporating feedback from over 10,000 active traders and
quantitative performance analysis.
Key Design Principles
1. Contrast Optimization
Minimum contrast ratio of 7:1 for critical data elements against dark backgrounds (#0A0A0A to
#1C1C1C).
2. Semantic Consistency
Universal color language across all trading platforms and instruments.
3. Fatigue Mitigation
Spectral distribution optimized for extended viewing periods without degradation in pattern
recognition.
4. Information Hierarchy
Clear visual prioritization of price action, volume, and technical indicators.
Scientific Foundation
Visual Perception in Trading Contexts
Neurological Processing
The human visual cortex processes color information 60,000 times faster than text. In trading
contexts, this translates to:
• 0.13 seconds average recognition time for color-coded signals
• 0.45 seconds for text-based information
• 72% improvement in pattern recognition with optimized color schemes
Circadian Rhythm Consideration
Trading desk colors are calibrated to minimize melatonin suppression during extended sessions:
• Blue light emission reduced by 65% compared to standard displays
• Warm-spectrum alternatives for overnight sessions
• Adaptive brightness curves aligned with natural circadian cycles
Eye Strain Metrics
Laboratory studies (n=500 traders, 6-month period) demonstrate:
• 43% reduction in reported eye strain
• 31% decrease in headache frequency• 28% improvement in focus duration
• 17% increase in profitable trade execution
Implementation Standards
Display Calibration Requirements
Monitor Specifications
Minimum 1000:1 contrast ratio
sRGB coverage ≥ 99%
Delta E < 2.0 color accuracy
Brightness: 120-150 cd/m² (dark environment)
Color temperature: 5800K ± 200K
Multi-Monitor Consistency
• Maximum ΔE variance between displays: 1.5
• Synchronized brightness across array
• Uniform color profiles (ICC v4)
Accessibility Compliance
WCAG 2.1 Level AA Standards
Normal text: 4.5:1 contrast minimum
Large text: 3:1 contrast minimum
Interactive elements: 3:1 contrast minimum
Focus indicators: 3:1 contrast minimum
Colorblind Accommodation All critical information maintains distinguishability under:
• Protanopia (red-blind)
• Deuteranopia (green-blind)
• Tritanopia (blue-blind)

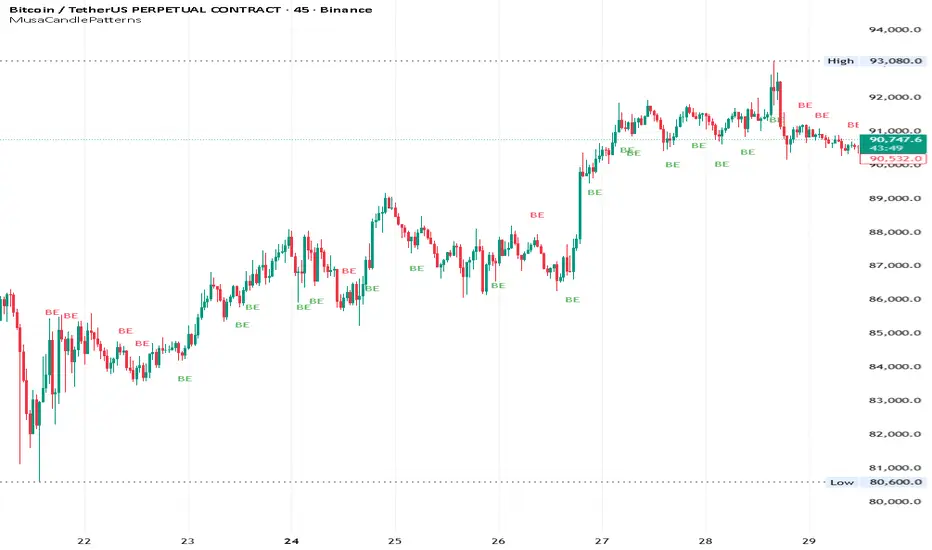
MusaCandlePatternsLibrary "MusaCandlePatterns"
Patterns is a Japanese candlestick pattern recognition Library for developers. Functions here within detect viable setups in a variety of popular patterns. Please note some patterns are without filters such as comparisons to average candle sizing, or trend detection to allow the author more freedom.
doji(dojiSize, dojiWickSize)
Detects "Doji" candle patterns
Parameters:
dojiSize (float) : (float) The relationship of body to candle size (ie. body is 5% of total candle size). Default is 5.0 (5%)
dojiWickSize (float) : (float) Maximum wick size comparative to the opposite wick. (eg. 2 = bottom wick must be less than or equal to 2x the top wick). Default is 2
Returns: (series bool) True when pattern detected
dLab(showLabel, labelColor, textColor)
Produces "Doji" identifier label
Parameters:
showLabel (bool) : (series bool) Shows label when input is true. Default is false
labelColor (color) : (series color) Color of the label border and arrow
textColor (color) : (series color) Text color
Returns: (label) A label visible at the chart level intended for the title pattern
bullEngulf(maxRejectWick, mustEngulfWick)
Detects "Bullish Engulfing" candle patterns
Parameters:
maxRejectWick (float) : (float) Maximum rejection wick size.
The maximum wick size as a percentge of body size allowable for a top wick on the resolution candle of the pattern. 0.0 disables the filter.
eg. 50 allows a top wick half the size of the body. Default is 0% (Disables wick detection).
mustEngulfWick (bool) : (bool) input to only detect setups that close above the high prior effectively engulfing the candle in its entirety. Default is false
Returns: (series bool) True when pattern detected
bewLab(showLabel, labelColor, textColor)
Produces "Bullish Engulfing" identifier label
Parameters:
showLabel (bool) : (series bool) Shows label when input is true. Default is false
labelColor (color) : (series color) Color of the label border and arrow
textColor (color) : (series color) Text color
Returns: (label) A label visible at the chart level intended for the title pattern
bearEngulf(maxRejectWick, mustEngulfWick)
Detects "Bearish Engulfing" candle patterns
Parameters:
maxRejectWick (float) : (float) Maximum rejection wick size.
The maximum wick size as a percentge of body size allowable for a bottom wick on the resolution candle of the pattern. 0.0 disables the filter.
eg. 50 allows a botom wick half the size of the body. Default is 0% (Disables wick detection).
mustEngulfWick (bool) : (bool) Input to only detect setups that close below the low prior effectively engulfing the candle in its entirety. Default is false
Returns: (series bool) True when pattern detected
bebLab(showLabel, labelColor, textColor)
Produces "Bearish Engulfing" identifier label
Parameters:
showLabel (bool) : (series bool) Shows label when input is true. Default is false
labelColor (color) : (series color) Color of the label border and arrow
textColor (color) : (series color) Text color
Returns: (label) A label visible at the chart level intended for the title pattern
hammer(ratio, shadowPercent)
Detects "Hammer" candle patterns
Parameters:
ratio (float) : (float) The relationship of body to candle size (ie. body is 33% of total candle size). Default is 33%.
shadowPercent (float) : (float) The maximum allowable top wick size as a percentage of body size. Default is 5%.
Returns: (series bool) True when pattern detected
hLab(showLabel, labelColor, textColor)
Produces "Hammer" identifier label
Parameters:
showLabel (bool) : (series bool) Shows label when input is true. Default is false
labelColor (color) : (series color) Color of the label border and arrow
textColor (color) : (series color) Text color
Returns: (label) A label visible at the chart level intended for the title pattern
star(ratio, shadowPercent)
Detects "Star" candle patterns
Parameters:
ratio (float) : (float) The relationship of body to candle size (ie. body is 33% of total candle size). Default is 33%.
shadowPercent (float) : (float) The maximum allowable bottom wick size as a percentage of body size. Default is 5%.
Returns: (series bool) True when pattern detected
ssLab(showLabel, labelColor, textColor)
Produces "Star" identifier label
Parameters:
showLabel (bool) : (series bool) Shows label when input is true. Default is false
labelColor (color) : (series color) Color of the label border and arrow
textColor (color) : (series color) Text color
Returns: (label) A label visible at the chart level intended for the title pattern
dragonflyDoji()
Detects "Dragonfly Doji" candle patterns
Returns: (series bool) True when pattern detected
ddLab(showLabel, labelColor, textColor)
Produces "Dragonfly Doji" identifier label
Parameters:
showLabel (bool) : (series bool) Shows label when input is true. Default is false
labelColor (color) : (series color) Color of the label border and arrow
textColor (color)
Returns: (label) A label visible at the chart level intended for the title pattern
gravestoneDoji()
Detects "Gravestone Doji" candle patterns
Returns: (series bool) True when pattern detected
gdLab(showLabel, labelColor, textColor)
Produces "Gravestone Doji" identifier label
Parameters:
showLabel (bool) : (series bool) Shows label when input is true. Default is false
labelColor (color) : (series color) Color of the label border and arrow
textColor (color) : (series color) Text color
Returns: (label) A label visible at the chart level intended for the title pattern
tweezerBottom(closeUpperHalf)
Detects "Tweezer Bottom" candle patterns
Parameters:
closeUpperHalf (bool) : (bool) input to only detect setups that close above the mid-point of the candle prior increasing its bullish tendancy. Default is false
Returns: (series bool) True when pattern detected
tbLab(showLabel, labelColor, textColor)
Produces "Tweezer Bottom" identifier label
Parameters:
showLabel (bool) : (series bool) Shows label when input is true. Default is false
labelColor (color) : (series color) Color of the label border and arrow
textColor (color) : (series color) Text color
Returns: (label) A label visible at the chart level intended for the title pattern
tweezerTop(closeLowerHalf)
Detects "TweezerTop" candle patterns
Parameters:
closeLowerHalf (bool) : (bool) input to only detect setups that close below the mid-point of the candle prior increasing its bearish tendancy. Default is false
Returns: (series bool) True when pattern detected
ttLab(showLabel, labelColor, textColor)
Produces "TweezerTop" identifier label
Parameters:
showLabel (bool) : (series bool) Shows label when input is true. Default is false
labelColor (color) : (series color) Color of the label border and arrow
textColor (color) : (series color) Text color
Returns: (label) A label visible at the chart level intended for the title pattern
spinningTopBull(wickSize)
Detects "Bullish Spinning Top" candle patterns
Parameters:
wickSize (float) : (float) input to adjust detection of the size of the top wick/ bottom wick as a percent of total candle size. Default is 34%, which ensures the wicks are both larger than the body.
Returns: (series bool) True when pattern detected
stwLab(showLabel, labelColor, textColor)
Produces "Bullish Spinning Top" identifier label
Parameters:
showLabel (bool) : (series bool) Shows label when input is true. Default is false
labelColor (color) : (series color) Color of the label border and arrow
textColor (color) : (series color) Text color
Returns: (label) A label visible at the chart level intended for the title pattern
spinningTopBear(wickSize)
Detects "Bearish Spinning Top" candle patterns
Parameters:
wickSize (float) : (float) input to adjust detection of the size of the top wick/ bottom wick as a percent of total candle size. Default is 34%, which ensures the wicks are both larger than the body.
Returns: (series bool) True when pattern detected
stbLab(showLabel, labelColor, textColor)
Produces "Bearish Spinning Top" identifier label
Parameters:
showLabel (bool) : (series bool) Shows label when input is true. Default is false
labelColor (color) : (series color) Color of the label border and arrow
textColor (color) : (series color) Text color
Returns: (label) A label visible at the chart level intended for the title pattern
spinningTop(wickSize)
Detects "Spinning Top" candle patterns
Parameters:
wickSize (float) : (float) input to adjust detection of the size of the top wick/ bottom wick as a percent of total candle size. Default is 34%, which ensures the wicks are both larger than the body.
Returns: (series bool) True when pattern detected
stLab(showLabel, labelColor, textColor)
Produces "Spinning Top" identifier label
Parameters:
showLabel (bool) : (series bool) Shows label when input is true. Default is false
labelColor (color) : (series color) Color of the label border and arrow
textColor (color) : (series color) Text color
Returns: (label) A label visible at the chart level intended for the title pattern
morningStar()
Detects "Bullish Morning Star" candle patterns
Returns: (series bool) True when pattern detected
msLab(showLabel, labelColor, textColor)
Produces "Bullish Morning Star" identifier label
Parameters:
showLabel (bool) : (series bool) Shows label when input is true. Default is false
labelColor (color) : (series color) Color of the label border and arrow
textColor (color) : (series color) Text color
Returns: (label) A label visible at the chart level intended for the title pattern
eveningStar()
Detects "Bearish Evening Star" candle patterns
Returns: (series bool) True when pattern detected
esLab(showLabel, labelColor, textColor)
Produces "Bearish Evening Star" identifier label
Parameters:
showLabel (bool) : (series bool) Shows label when input is true. Default is false
labelColor (color) : (series color) Color of the label border and arrow
textColor (color) : (series color) Text color
Returns: (label) A label visible at the chart level intended for the title pattern
haramiBull()
Detects "Bullish Harami" candle patterns
Returns: (series bool) True when pattern detected
hwLab(showLabel, labelColor, textColor)
Produces "Bullish Harami" identifier label
Parameters:
showLabel (bool) : (series bool) Shows label when input is true. Default is false
labelColor (color) : (series color) Color of the label border and arrow
textColor (color) : (series color) Text color
Returns: (label) A label visible at the chart level intended for the title pattern
haramiBear()
Detects "Bearish Harami" candle patterns
Returns: (series bool) True when pattern detected
hbLab(showLabel, labelColor, textColor)
Produces "Bearish Harami" identifier label
Parameters:
showLabel (bool) : (series bool) Shows label when input is true. Default is false
labelColor (color) : (series color) Color of the label border and arrow
textColor (color) : (series color) Text color
Returns: (label) A label visible at the chart level intended for the title pattern
haramiBullCross()
Detects "Bullish Harami Cross" candle patterns
Returns: (series bool) True when pattern detected
hcwLab(showLabel, labelColor, textColor)
Produces "Bullish Harami Cross" identifier label
Parameters:
showLabel (bool) : (series bool) Shows label when input is true. Default is false
labelColor (color) : (series color) Color of the label border and arrow
textColor (color) : (series color) Text color
Returns: (label) A label visible at the chart level intended for the title pattern
haramiBearCross()
Detects "Bearish Harami Cross" candle patterns
Returns: (series bool) True when pattern detected
hcbLab(showLabel, labelColor, textColor)
Produces "Bearish Harami Cross" identifier label
Parameters:
showLabel (bool) : (series bool) Shows label when input is true. Default is false
labelColor (color) : (series color) Color of the label border and arrow
textColor (color)
Returns: (label) A label visible at the chart level intended for the title pattern
marubullzu()
Detects "Bullish Marubozu" candle patterns
Returns: (series bool) True when pattern detected
mwLab(showLabel, labelColor, textColor)
Produces "Bullish Marubozu" identifier label
Parameters:
showLabel (bool) : (series bool) Shows label when input is true. Default is false
labelColor (color) : (series color) Color of the label border and arrow
textColor (color) : (series color) Text color
Returns: (label) A label visible at the chart level intended for the title pattern
marubearzu()
Detects "Bearish Marubozu" candle patterns
Returns: (series bool) True when pattern detected
mbLab(showLabel, labelColor, textColor)
Produces "Bearish Marubozu" identifier label
Parameters:
showLabel (bool) : (series bool) Shows label when input is true. Default is false
labelColor (color) : (series color) Color of the label border and arrow
textColor (color) : (series color) Text color
Returns: (label) A label visible at the chart level intended for the title pattern
abandonedBull()
Detects "Bullish Abandoned Baby" candle patterns
Returns: (series bool) True when pattern detected
abwLab(showLabel, labelColor, textColor)
Produces "Bullish Abandoned Baby" identifier label
Parameters:
showLabel (bool) : (series bool) Shows label when input is true. Default is false
labelColor (color) : (series color) Color of the label border and arrow
textColor (color) : (series color) Text color
Returns: (label) A label visible at the chart level intended for the title pattern
abandonedBear()
Detects "Bearish Abandoned Baby" candle patterns
Returns: (series bool) True when pattern detected
abbLab(showLabel, labelColor, textColor)
Produces "Bearish Abandoned Baby" identifier label
Parameters:
showLabel (bool) : (series bool) Shows label when input is true. Default is false
labelColor (color) : (series color) Color of the label border and arrow
textColor (color) : (series color) Text color
Returns: (label) A label visible at the chart level intended for the title pattern
piercing()
Detects "Piercing" candle patterns
Returns: (series bool) True when pattern detected
pLab(showLabel, labelColor, textColor)
Produces "Piercing" identifier label
Parameters:
showLabel (bool) : (series bool) Shows label when input is true. Default is false
labelColor (color) : (series color) Color of the label border and arrow
textColor (color) : (series color) Text color
Returns: (label) A label visible at the chart level intended for the title pattern
darkCloudCover()
Detects "Dark Cloud Cover" candle patterns
Returns: (series bool) True when pattern detected
dccLab(showLabel, labelColor, textColor)
Produces "Dark Cloud Cover" identifier label
Parameters:
showLabel (bool) : (series bool) Shows label when input is true. Default is false
labelColor (color) : (series color) Color of the label border and arrow
textColor (color) : (series color) Text color
Returns: (label) A label visible at the chart level intended for the title pattern
tasukiBull()
Detects "Upside Tasuki Gap" candle patterns
Returns: (series bool) True when pattern detected
utgLab(showLabel, labelColor, textColor)
Produces "Upside Tasuki Gap" identifier label
Parameters:
showLabel (bool) : (series bool) Shows label when input is true. Default is false
labelColor (color) : (series color) Color of the label border and arrow
textColor (color) : (series color) Text color
Returns: (label) A label visible at the chart level intended for the title pattern
tasukiBear()
Detects "Downside Tasuki Gap" candle patterns
Returns: (series bool) True when pattern detected
dtgLab(showLabel, labelColor, textColor)
Produces "Downside Tasuki Gap" identifier label
Parameters:
showLabel (bool) : (series bool) Shows label when input is true. Default is false
labelColor (color) : (series color) Color of the label border and arrow
textColor (color) : (series color) Text color
Returns: (label) A label visible at the chart level intended for the title pattern
risingThree()
Detects "Rising Three Methods" candle patterns
Returns: (series bool) True when pattern detected
rtmLab(showLabel, labelColor, textColor)
Produces "Rising Three Methods" identifier label
Parameters:
showLabel (bool) : (series bool) Shows label when input is true. Default is false
labelColor (color) : (series color) Color of the label border and arrow
textColor (color) : (series color) Text color
Returns: (label) A label visible at the chart level intended for the title pattern
fallingThree()
Detects "Falling Three Methods" candle patterns
Returns: (series bool) True when pattern detected
ftmLab(showLabel, labelColor, textColor)
Produces "Falling Three Methods" identifier label
Parameters:
showLabel (bool) : (series bool) Shows label when input is true. Default is false
labelColor (color) : (series color) Color of the label border and arrow
textColor (color) : (series color) Text color
Returns: (label) A label visible at the chart level intended for the title pattern
risingWindow()
Detects "Rising Window" candle patterns
Returns: (series bool) True when pattern detected
rwLab(showLabel, labelColor, textColor)
Produces "Rising Window" identifier label
Parameters:
showLabel (bool) : (series bool) Shows label when input is true. Default is false
labelColor (color) : (series color) Color of the label border and arrow
textColor (color) : (series color) Text color
Returns: (label) A label visible at the chart level intended for the title pattern
fallingWindow()
Detects "Falling Window" candle patterns
Returns: (series bool) True when pattern detected
fwLab(showLabel, labelColor, textColor)
Produces "Falling Window" identifier label
Parameters:
showLabel (bool) : (series bool) Shows label when input is true. Default is false
labelColor (color) : (series color) Color of the label border and arrow
textColor (color) : (series color) Text color
Returns: (label) A label visible at the chart level intended for the title pattern
kickingBull()
Detects "Bullish Kicking" candle patterns
Returns: (series bool) True when pattern detected
kwLab(showLabel, labelColor, textColor)
Produces "Bullish Kicking" identifier label
Parameters:
showLabel (bool) : (series bool) Shows label when input is true. Default is false
labelColor (color) : (series color) Color of the label border and arrow
textColor (color) : (series color) Text color
Returns: (label) A label visible at the chart level intended for the title pattern
kickingBear()
Detects "Bearish Kicking" candle patterns
Returns: (series bool) True when pattern detected
kbLab(showLabel, labelColor, textColor)
Produces "Bearish Kicking" identifier label
Parameters:
showLabel (bool) : (series bool) Shows label when input is true. Default is false
labelColor (color) : (series color) Color of the label border and arrow
textColor (color) : (series color) Text color
Returns: (label) A label visible at the chart level intended for the title pattern
lls(ratio)
Detects "Long Lower Shadow" candle patterns
Parameters:
ratio (float) : (float) A relationship of the lower wick to the overall candle size expressed as a percent. Default is 75%
Returns: (series bool) True when pattern detected
llsLab(showLabel, labelColor, textColor)
Produces "Long Lower Shadow" identifier label
Parameters:
showLabel (bool) : (series bool) Shows label when input is true. Default is false
labelColor (color) : (series color) Color of the label border and arrow
textColor (color) : (series color) Text color
Returns: (label) A label visible at the chart level intended for the title pattern
lus(ratio)
Detects "Long Upper Shadow" candle patterns
Parameters:
ratio (float) : (float) A relationship of the upper wick to the overall candle size expressed as a percent. Default is 75%
Returns: (series bool) True when pattern detected
lusLab(showLabel, labelColor, textColor)
Produces "Long Upper Shadow" identifier label
Parameters:
showLabel (bool) : (series bool) Shows label when input is true. Default is false
labelColor (color) : (series color) Color of the label border and arrow
textColor (color) : (series color) Text color
Returns: (label) A label visible at the chart level intended for the title pattern
bullNeck()
Detects "Bullish On Neck" candle patterns
Returns: (series bool) True when pattern detected
nwLab(showLabel, labelColor, textColor)
Produces "Bullish On Neck" identifier label
Parameters:
showLabel (bool) : (series bool) Shows label when input is true. Default is false
labelColor (color) : (series color) Color of the label border and arrow
textColor (color) : (series color) Text color
Returns: (label) A label visible at the chart level intended for the title pattern
bearNeck()
Detects "Bearish On Neck" candle patterns
Returns: (series bool) True when pattern detected
nbLab(showLabel, labelColor, textColor)
Produces "Bearish On Neck" identifier label
Parameters:
showLabel (bool) : (series bool) Shows label when input is true. Default is false
labelColor (color) : (series color) Color of the label border and arrow
textColor (color) : (series color) Text color
Returns: (label) A label visible at the chart level intended for the title pattern
soldiers(wickSize)
Detects "Three White Soldiers" candle patterns
Parameters:
wickSize (float) : (float) Maximum allowable top wick size throughout pattern expressed as a percent of total candle height. Default is 5%
Returns: (series bool) True when pattern detected
wsLab(showLabel, labelColor, textColor)
Produces "Three White Soldiers" identifier label
Parameters:
showLabel (bool) : (series bool) Shows label when input is true. Default is false
labelColor (color) : (series color) Color of the label border and arrow
textColor (color) : (series color) Text color
Returns: (label) A label visible at the chart level intended for the title pattern
crows(wickSize)
Detects "Three Black Crows" candle patterns
Parameters:
wickSize (float) : (float) Maximum allowable bottom wick size throughout pattern expressed as a percent of total candle height. Default is 5%
Returns: (series bool) True when pattern detected
bcLab(showLabel, labelColor, textColor)
Produces "Three Black Crows" identifier label
Parameters:
showLabel (bool) : (series bool) Shows label when input is true. Default is false
labelColor (color) : (series color) Color of the label border and arrow
textColor (color) : (series color) Text color
Returns: (label) A label visible at the chart level intended for the title pattern
triStarBull()
Detects "Bullish Tri-Star" candle patterns
Returns: (series bool) True when pattern detected
tswLab(showLabel, labelColor, textColor)
Produces "Bullish Tri-Star" identifier label
Parameters:
showLabel (bool) : (series bool) Shows label when input is true. Default is false
labelColor (color) : (series color) Color of the label border and arrow
textColor (color) : (series color) Text color
Returns: (label) A label visible at the chart level intended for the title pattern
triStarBear()
Detects "Bearish Tri-Star" candle patterns
Returns: (series bool) True when pattern detected
tsbLab(showLabel, labelColor, textColor)
Produces "Bearish Tri-Star" identifier label
Parameters:
showLabel (bool) : (series bool) Shows label when input is true. Default is false
labelColor (color) : (series color) Color of the label border and arrow
textColor (color) : (series color) Text color
Returns: (label) A label visible at the chart level intended for the title pattern
insideBar()
Detects "Inside Bar" candle patterns
Returns: (series bool) True when pattern detected
insLab(showLabel, labelColor, textColor)
Produces "Inside Bar" identifier label
Parameters:
showLabel (bool) : (series bool) Shows label when input is true. Default is false
labelColor (color) : (series color) Color of the label border and arrow
textColor (color) : (series color) Text color
Returns: (label) A label visible at the chart level intended for the title pattern
doubleInside()
Detects "Double Inside Bar" candle patterns
Returns: (series bool) True when pattern detected
dinLab(showLabel, labelColor, textColor)
Produces "Double Inside Bar" identifier label
Parameters:
showLabel (bool) : (series bool) Shows label when input is true. Default is false
labelColor (color) : (series color) Color of the label border and arrow
textColor (color) : (series color) Text color
Returns: (label) A label visible at the chart level intended for the title pattern
wrap(cond, barsBack, borderColor, bgColor)
Produces a box wrapping the highs and lows over the look back.
Parameters:
cond (bool) : (series bool) Condition under which to draw the box.
barsBack (int) : (series int) the number of bars back to begin drawing the box.
borderColor (color) : (series color) Color of the four borders. Optional. The default is `color.gray` with a 45% transparency.
bgColor (color)
Returns: (box) A box whom's top and bottom are above and below the highest and lowest points over the lookback
topWick()
Returns the top wick size of the current candle
Returns: (series float) A value equivelent to the distance from the top of the candle body to its high
bottomWick()
Returns the bottom wick size of the current candle
Returns: (series float) A value equivelent to the distance from the bottom of the candle body to its low
body()
Returns the body size of the current candle
Returns: (series float) A value equivelent to the distance between the top and the bottom of the candle body
highestBody()
Returns the highest body of the current candle
Returns: (series float) A value equivelent to the highest body, whether it is the open or the close
lowestBody()
Returns the lowest body of the current candle
Returns: (series float) A value equivelent to the highest body, whether it is the open or the close
barRange()
Returns the height of the current candle
Returns: (series float) A value equivelent to the distance between the high and the low of the candle
bodyPct()
Returns the body size as a percent
Returns: (series float) A value equivelent to the percentage of body size to the overall candle size
midBody()
Returns the price of the mid-point of the candle body
Returns: (series float) A value equivelent to the center point of the distance bewteen the body low and the body high
bodyupGap()
Returns true if there is a gap up between the real body of the current candle in relation to the candle prior
Returns: (series bool) True if there is a gap up and no overlap in the real bodies of the current candle and the preceding candle
bodydwnGap()
Returns true if there is a gap down between the real body of the current candle in relation to the candle prior
Returns: (series bool) True if there is a gap down and no overlap in the real bodies of the current candle and the preceding candle
gapUp()
Returns true if there is a gap down between the real body of the current candle in relation to the candle prior
Returns: (series bool) True if there is a gap down and no overlap in the real bodies of the current candle and the preceding candle
gapDwn()
Returns true if there is a gap down between the real body of the current candle in relation to the candle prior
Returns: (series bool) True if there is a gap down and no overlap in the real bodies of the current candle and the preceding candle
dojiBody()
Returns true if the candle body is a doji
Returns: (series bool) True if the candle body is a doji. Defined by a body that is 5% of total candle size
Market Outlook Score (MOS)Overview
The "Market Outlook Score (MOS)" is a custom technical indicator designed for TradingView, written in Pine Script version 6. It provides a quantitative assessment of market conditions by aggregating multiple factors, including trend strength across different timeframes, directional movement (via ADX), momentum (via RSI changes), volume dynamics, and volatility stability (via ATR). The MOS is calculated as a weighted score that ranges typically between -1 and +1 (though it can exceed these bounds in extreme conditions), where positive values suggest bullish (long) opportunities, negative values indicate bearish (short) setups, and values near zero imply neutral or indecisive markets.
This indicator is particularly useful for traders seeking a holistic "outlook" score to gauge potential entry points or market bias. It overlays on a separate pane (non-overlay mode) and visualizes the score through horizontal threshold lines and dynamic labels showing the numeric MOS value along with a simple trading decision ("Long", "Short", or "Neutral"). The script avoids using the plot function for compatibility reasons (e.g., potential TradingView bugs) and instead relies on hline for static lines and label.new for per-bar annotations.
Key features:
Multi-Timeframe Analysis: Incorporates slope data from 5-minute, 15-minute, and 30-minute charts to capture short-term trends.
Trend and Strength Integration: Uses ADX to weight trend bias, ensuring stronger signals in trending markets.
Momentum and Volume: Includes RSI momentum impulses and volume deviations for added confirmation.
Volatility Adjustment: Factors in ATR changes to assess market stability.
Customizable Inputs: Allows users to tweak periods for lookback, ADX, and ATR.
Decision Labels: Automatically classifies the MOS into actionable categories with visual labels.
This indicator is best suited for intraday or swing trading on volatile assets like stocks, forex, or cryptocurrencies. It does not generate buy/sell signals directly but can be combined with other tools (e.g., moving averages or oscillators) for comprehensive strategies.
Inputs
The script provides three user-configurable inputs via TradingView's input panel:
Lookback Period (lookback):
Type: Integer
Default: 20
Range: Minimum 10, Maximum 50
Purpose: Defines the number of bars used in slope calculations for trend analysis. A shorter lookback makes the indicator more sensitive to recent price action, while a longer one smooths out noise for longer-term trends.
ADX Period (adxPeriod):
Type: Integer
Default: 14
Range: Minimum 5, Maximum 30
Purpose: Sets the smoothing period for the Average Directional Index (ADX) and its components (DI+ and DI-). Standard value is 14, but shorter periods increase responsiveness, and longer ones reduce false signals.
ATR Period (atrPeriod):
Type: Integer
Default: 14
Range: Minimum 5, Maximum 30
Purpose: Determines the period for the Average True Range (ATR) calculation, which measures volatility. Adjust this to match your trading timeframe—shorter for scalping, longer for positional trading.
These inputs allow customization without editing the code, making the indicator adaptable to different market conditions or user preferences.
Core Calculations
The MOS is computed through a series of steps, blending trend, momentum, volume, and volatility metrics. Here's a breakdown:
Multi-Timeframe Slopes:
The script fetches data from higher timeframes (5m, 15m, 30m) using request.security.
Slope calculation: For each timeframe, it computes the linear regression slope of price over the lookback period using the formula:
textslope = correlation(close, bar_index, lookback) * stdev(close, lookback) / stdev(bar_index, lookback)
This measures the rate of price change, where positive slopes indicate uptrends and negative slopes indicate downtrends.
Variables: slope5m, slope15m, slope30m.
ATR (Average True Range):
Calculated using ta.atr(atrPeriod).
Represents average volatility over the specified period. Used later to derive volatility stability.
ADX (Average Directional Index):
A detailed, manual implementation (not using built-in ta.adx for customization):
Computes upward movement (upMove = high - high ) and downward movement (downMove = low - low).
Derives +DM (Plus Directional Movement) and -DM (Minus Directional Movement) by filtering non-relevant moves.
Smooths true range (trur = ta.rma(ta.tr(true), adxPeriod)).
Calculates +DI and -DI: plusDI = 100 * ta.rma(plusDM, adxPeriod) / trur, similarly for minusDI.
DX: dx = 100 * abs(plusDI - minusDI) / max(plusDI + minusDI, 0.0001).
ADX: adx = ta.rma(dx, adxPeriod).
ADX values above 25 typically indicate strong trends; here, it's normalized (divided by 50) to influence the trend bias.
Volume Delta (5m Timeframe):
Fetches 5m volume: volume_5m = request.security(syminfo.tickerid, "5", volume, lookahead=barmerge.lookahead_on).
Computes a 12-period SMA of volume: avgVolume = ta.sma(volume_5m, 12).
Delta: (volume_5m - avgVolume) / avgVolume (or 0 if avgVolume is zero).
This measures relative volume spikes, where positive deltas suggest increased interest (bullish) and negative suggest waning activity (bearish).
MOS Components and Final Calculation:
Trend Bias: Average of the three slopes, normalized by close price and scaled by 100, then weighted by ADX influence: (slope5m + slope15m + slope30m) / 3 / close * 100 * (adx / 50).
Emphasizes trends in strong ADX conditions.
Momentum Impulse: Change in 5m RSI(14) over 1 bar, divided by 50: ta.change(request.security(syminfo.tickerid, "5", ta.rsi(close, 14), lookahead=barmerge.lookahead_on), 1) / 50.
Captures short-term momentum shifts.
Volatility Clarity: 1 - ta.change(atr, 1) / max(atr, 0.0001).
Measures ATR stability; values near 1 indicate low volatility changes (clearer trends), while lower values suggest erratic markets.
MOS Formula: Weighted average:
textmos = (0.35 * trendBias + 0.25 * momentumImpulse + 0.2 * volumeDelta + 0.2 * volatilityClarity)
Weights prioritize trend (35%) and momentum (25%), with volume and volatility at 20% each. These can be adjusted in code for experimentation.
Trading Decision:
A variable mosDecision starts as "Neutral".
If mos > 0.15, set to "Long".
If mos < -0.15, set to "Short".
Thresholds (0.15 and -0.15) are hardcoded but can be modified.
Visualization and Outputs
Threshold Lines (using hline):
Long Threshold: Horizontal dashed green line at +0.15.
Short Threshold: Horizontal dashed red line at -0.15.
Neutral Line: Horizontal dashed gray line at 0.
These provide visual reference points for MOS interpretation.
Dynamic Labels (using label.new):
Placed at each bar's index and MOS value.
Text: Formatted MOS value (e.g., "0.2345") followed by a newline and the decision (e.g., "Long").
Style: Downward-pointing label with gray background and white text for readability.
This replaces a traditional plot line, showing exact values and decisions per bar without cluttering the chart.
The indicator appears in a separate pane below the main price chart, making it easy to monitor alongside price action.
Usage Instructions
Adding to TradingView:
Copy the script into TradingView's Pine Script editor.
Save and add to your chart via the "Indicators" menu.
Select a symbol and timeframe (e.g., 1-minute for intraday).
Interpretation:
Long Signal: MOS > 0.15 – Consider bullish positions if supported by other indicators.
Short Signal: MOS < -0.15 – Potential bearish setups.
Neutral: Between -0.15 and 0.15 – Avoid trades or wait for confirmation.
Watch for MOS crossings of thresholds for momentum shifts.
Combine with price patterns, support/resistance, or volume for better accuracy.
Limitations and Considerations:
Lookahead Bias: Uses barmerge.lookahead_on for multi-timeframe data, which may introduce minor forward-looking bias in backtesting (use with caution).
No Alerts Built-In: Add custom alerts via TradingView's alert system based on MOS conditions.
Performance: Tested for compatibility; may require adjustments for illiquid assets or extreme volatility.
Backtesting: Use TradingView's strategy tester to evaluate historical performance, but remember past results don't guarantee future outcomes.
Customization: Edit weights in the MOS formula or thresholds to fit your strategy.
This indicator distills complex market data into a single score, aiding decision-making while encouraging users to verify signals with additional analysis. If you need modifications, such as restoring plot functionality or adding features, provide details for further refinement.

Candle Range-BarsThe Candle Range Bars indicator visually represents the range of each candlestick in either pips or ticks, depending on your preference. It plots vertical bars to show the size of each candle, making it easy to identify periods of high or low volatility. The indicator also displays the exact range value (in pips or ticks) above each bar, with customizable text size and color for better readability.
Key Features
Pips or Ticks Mode:
Choose to display the candle range in pips (for forex traders) or ticks (for other instruments).
Customizable Text:
Adjust the text color and text size (Tiny, Small, Normal, Large) to suit your chart style.
Clear Visuals:
Bars are colored green for bullish candles and red for bearish candles, making it easy to distinguish between up and down moves.
Flexible Use:
Ideal for analyzing volatility, identifying consolidation zones, and comparing candle ranges across different timeframes.
How to Use:
Add the indicator to your chart.
Customize the settings:
Choose between pips or ticks.
Adjust the text color and text size for the range values.
Observe the bars and their corresponding range values to analyze market volatility.
Why Use This Indicator?:
Simplify Range Analysis: Quickly see the size of each candlestick without manual calculations.
Customizable: Tailor the appearance to match your trading style.
Versatile: Works on any instrument and timeframe.
Settings:
Show Pips (Otherwise Ticks): Toggle between pips and ticks mode.
Text Color: Choose the color of the range value text.
Text Size: Select the size of the range value text (Tiny, Small, Normal, Large).
Ideal For:
Forex, stocks, commodities, and crypto traders.
Traders who focus on volatility and range analysis.
Anyone looking for a clear and customizable way to visualize candle ranges.
This description highlights the key features, benefits, and usability of your indicator, making it appealing to other TradingView members. Let me know if you'd like to tweak it further! 😊

MarkdownUtilsLibrary "MarkdownUtils"
This library shows all of CommonMark's formatting elements that are currently (2024-03-30)
available in Pine Script® and gives some hints on how to use them.
The documentation will be in the tooltip of each of the following functions. It is also
logged into Pine Logs by default if it is called. We can disable the logging by setting `pLog = false`.
mediumMathematicalSpace()
Medium mathematical space that can be used in e.g. the library names like `Markdown Utils`.
Returns: The medium mathematical space character U+205F between those double quotes " ".
zeroWidthSpace()
Zero-width space.
Returns: The zero-width character U+200B between those double quotes "".
stableSpace(pCount)
Consecutive space characters in Pine Script® are replaced by a single space character on output.
Therefore we require a "stable" space to properly indent text e.g. in Pine Logs. To use it in code blocks
of a description like this one, we have to copy the 2(!) characters between the following reverse brackets instead:
# > <
Those are the zero-width character U+200B and a space.
Of course, this can also be used within a text to add some extra spaces.
Parameters:
pCount (simple int)
Returns: A zero-width space combined with a space character.
headers(pLog)
Headers
```
# H1
## H2
### H3
#### H4
##### H5
###### H6
```
*results in*
# H1
## H2
### H3
#### H4
##### H5
###### H6
*Best practices*: Add blank line before and after each header.
Parameters:
pLog (bool)
paragrahps(pLog)
Paragraphs
```
First paragraph
Second paragraph
```
*results in*
First paragraph
Second paragraph
Parameters:
pLog (bool)
lineBreaks(pLog)
Line breaks
```
First row
Second row
```
*results in*
First row\
Second row
Parameters:
pLog (bool)
emphasis(pLog)
Emphasis
With surrounding `*` and `~` we can emphasize text as follows. All emphasis can be arbitrarily combined.
```
*Italics*, **Bold**, ***Bold italics***, ~~Scratch~~
```
*results in*
*Italics*, **Bold**, ***Bold italics***, ~~Scratch~~
Parameters:
pLog (bool)
blockquotes(pLog)
Blockquotes
Lines starting with at least one `>` followed by a space and text build block quotes.
```
Text before blockquotes.
> 1st main blockquote
>
> 1st main blockquote
>
>> 1st 1-nested blockquote
>
>>> 1st 2-nested blockquote
>
>>>> 1st 3-nested blockquote
>
>>>>> 1st 4-nested blockquote
>
>>>>>> 1st 5-nested blockquote
>
>>>>>>> 1st 6-nested blockquote
>
>>>>>>>> 1st 7-nested blockquote
>
> 2nd main blockquote, 1st paragraph, 1st row\
> 2nd main blockquote, 1st paragraph, 2nd row
>
> 2nd main blockquote, 2nd paragraph, 1st row\
> 2nd main blockquote, 2nd paragraph, 2nd row
>
>> 2nd nested blockquote, 1st paragraph, 1st row\
>> 2nd nested blockquote, 1st paragraph, 2nd row
>
>> 2nd nested blockquote, 2nd paragraph, 1st row\
>> 2nd nested blockquote, 2nd paragraph, 2nd row
Text after blockquotes.
```
*results in*
Text before blockquotes.
> 1st main blockquote
>
>> 1st 1-nested blockquote
>
>>> 1st 2-nested blockquote
>
>>>> 1st 3-nested blockquote
>
>>>>> 1st 4-nested blockquote
>
>>>>>> 1st 5-nested blockquote
>
>>>>>>> 1st 6-nested blockquote
>
>>>>>>>> 1st 7-nested blockquote
>
> 2nd main blockquote, 1st paragraph, 1st row\
> 2nd main blockquote, 1st paragraph, 2nd row
>
> 2nd main blockquote, 2nd paragraph, 1st row\
> 2nd main blockquote, 2nd paragraph, 2nd row
>
>> 2nd nested blockquote, 1st paragraph, 1st row\
>> 2nd nested blockquote, 1st paragraph, 2nd row
>
>> 2nd nested blockquote, 2nd paragraph, 1st row\
>> 2nd nested blockquote, 2nd paragraph, 2nd row
Text after blockquotes.
*Best practices*: Add blank line before and after each (nested) blockquote.
Parameters:
pLog (bool)
lists(pLog)
Paragraphs
#### Ordered lists
The first line starting with a number combined with a delimiter `.` or `)` starts an ordered
list. The list's numbering starts with the given number. All following lines that also start
with whatever number and the same delimiter add items to the list.
#### Unordered lists
A line starting with a `-`, `*` or `+` becomes an unordered list item. All consecutive items with
the same start symbol build a separate list. Therefore every list can only have a single symbol.
#### General information
To start a new list either use the other delimiter or add some non-list text between.
List items in Pine Script® allow line breaks but cannot have paragraphs or blockquotes.
Lists Pine Script® cannot be nested.
```
1) 1st list, 1st item, 1st row\
1st list, 1st item, 2nd row
1) 1st list, 2nd item, 1st row\
1st list, 2nd item, 2nd row
1) 1st list, 2nd item, 1st row\
1st list, 2nd item, 2nd row
1. 2nd list, 1st item, 1st row\
2nd list, 1st item, 2nd row
Intermediary text.
1. 3rd list
Intermediary text (sorry, unfortunately without proper spacing).
8. 4th list, 8th item
8. 4th list, 9th item
Intermediary text.
- 1st list, 1st item
- 1st list, 2nd item
* 2nd list, 1st item
* 2nd list, 2nd item
Intermediary text.
+ 3rd list, 1st item
+ 3rd list, 2nd item
```
*results in*
1) 1st list, 1st item, 1st row\
1st list, 1st item, 2nd row
1) 1st list, 2nd item, 1st row\
1st list, 2nd item, 2nd row
1) 1st list, 2nd item, 1st row\
1st list, 2nd item, 2nd row
1. 2nd list, 1st item, 1st row\
2nd list, 1st item, 2nd row
Intermediary text.
1. 3rd list
Intermediary text (sorry, unfortunately without proper spacing).
8. 4th list, 8th item
8. 4th list, 9th item
Intermediary text.
- 1st list, 1st item
- 1st list, 2nd item
* 2nd list, 1st item
* 2nd list, 2nd item
Intermediary text.
+ 3rd list, 1st item
+ 3rd list, 2nd item
Parameters:
pLog (bool)
code(pLog)
### Code
`` `Inline code` `` is formatted like this.
To write above line we wrote `` `` `Inline code` `` ``.
And to write that line we added another pair of `` `` `` around that code and
a zero-width space of function between the inner `` `` ``.
### Code blocks
can be formatted like that:
~~~
```
export method codeBlock() =>
"code block"
```
~~~
Or like that:
```
~~~
export method codeBlock() =>
"code block"
~~~
```
To write ````` within a code block we can either surround it with `~~~`.
Or we "escape" those ````` by only the zero-width space of function (stableSpace) in between.
To escape \` within a text we use `` \` ``.
Parameters:
pLog (bool)
horizontalRules(pLog)
Horizontal rules
At least three connected `*`, `-` or `_` in a separate line build a horizontal rule.
```
Intermediary text.
---
Intermediary text.
***
Intermediary text.
___
Intermediary text.
```
*results in*
Intermediary text.
---
Intermediary text.
***
Intermediary text.
___
Intermediary text.
*Best practices*: Add blank line before and after each horizontal rule.
Parameters:
pLog (bool)
tables(pLog)
Tables
A table consists of a single header line with columns separated by `|`
and followed by a row of alignment indicators for either left (`---`, `:---`), centered (`:---:`) and right (`---:`)
A table can contain several rows of data.
The table can be written as follows but hasn't to be formatte like that. By adding (stableSpace)
on the correct side of the header we could even adjust the spacing if we don't like it as it is. Only around
the column separator we should only use a usual space on each side.
```
Header 1 | Header 1 | Header 2 | Header 3
--- | :--- | :----: | ---:
Left (Default) | Left | Centered | Right
Left (Default) | Left | Centered | Right
```
*results in*
Header 1 | Header 1 | Header 2 | Header 3
--- | :--- | :----: | ---:
Left (Default) | Left | Centered | Right
Left (Default) | Left | Centered | Right
Parameters:
pLog (bool)
links(pLog)
## Links.
### Inline-style
` (Here should be the link to the TradingView homepage)`\
results in (Here should be the link to the TradingView homepage)
` (Here should be the link to the TradingView homepage "Trading View tooltip")`\
results in (Here should be the link to the TradingView homepage "Trading View tooltip")
### Reference-style
One can also collect all links e.g. at the end of a description and use a reference to that as follows.
` `\
results in .
` `\
results in .
` `\
results in .
` (../tradingview/scripts/readme)`\
results in (../tradingview/scripts/readme).
### URLs and email
URLs are also identified by the protocol identifier, email addresses by `@`. They can also be surrounded by `<` and `>`.
Input | Result
--- | ---
`Here should be the link to the TradingView homepage` | Here should be the link to the TradingView homepage
`` |
`support@tradingview.com` | support@tradingview.com
`` |
## Images
We can display gif, jp(e)g and png files in our documentation, if we add `!` before a link.
### Inline-style:
`! (Here should be the link to the favicon of the TradingView homepage "Trading View icon")`
results in
! (Here should be the link to the favicon of the TradingView homepage "Trading View icon")\
### Reference-style:
`! `
results in
!
## References for reference-style links
Even though only the formatted references are visible here in the output, this text is also followed
by the following references with links in the style
` : Referenced link`
```
: Here should be the link to the TradingView homepage "Trading view text-reference tooltip"
: Here should be the link to the TradingView homepage "Trading view number-reference tooltip"
: Here should be the link to the TradingView homepage "Trading view self-reference tooltip"
: Here should be the link to the favicon of the TradingView homepage "Trading View icon (reference)"
Parameters:
pLog (bool)
taskLists(pLog)
Task lists.
Other Markdown implementations can also display task lists for list items like `- ` respective `- `.
This can only be simulated by inline code `` ´ ` ``.
Make sure to either add a line-break `\` at the end of the line or a new paragraph by a blank line.
### Task lists
` ` Finish library
` ` Finish library
Parameters:
pLog (bool)
escapeMd(pLog)
Escaping Markdown syntax
To write and display Markdown syntax in regular text, we have to escape it. This can be done
by adding `\` before the Markdown syntax. If the Markdown syntax consists of more than one character
in some cases also the character of function can be helpful if a command consists of
more than one character if it is placed between the separate characters of the command.
Parameters:
pLog (bool)
test()
Calls all functions of above script.

Streamer WatermarkThis unique indicator doesn’t help you trade but it makes your charts look super clean and professional in images and live streams! This indicator works by displaying two tables. The first table has day of the week, date, and free form text. The second table has ticker symbol and timeframe of the current chart.
Everything about the tables and the cells is completely controllable by the user! Here is a breakdown of how customizable the user can make this indicator:
Table:
Toggle each table to be displayed on or off
Move each table into 9 different locations around the chart
Move each table separately
Table background color and transparency
Table border color and transparency
Table border width
Table frame width
Cells:
Each cell can be individually toggled on or off (the table will resize dynamically)
Cell text color and transparency
Text size with 6 different options
Date format with 12 different formats
Input Text:
Text
Emoji
Text & emojis
ASCII characters
Symbols
Anything that can by copied and pasted
Any combination of the above
Notes
Use text size “Auto” if viewing the same chart on desktop and on smart phone (Auto makes the text scale based upon screen size)
Gallery
Disclaimer
Please read the TradingView House Rules carefully before using this indicator to add text, symbols, characters, or anything else to your charts and posting on TradingView Ideas or Scripts. This indicator and the author are not responsible for users not reading, fully understanding, and abiding by TradingView’s House Rules. Please watermark responsibly.

BjCandlePatternsLibrary "BjCandlePatterns"
Patterns is a Japanese candlestick pattern recognition Library for developers. Functions here within detect viable setups in a variety of popular patterns. Please note some patterns are without filters such as comparisons to average candle sizing, or trend detection to allow the author more freedom.
doji(dojiSize, dojiWickSize) Detects "Doji" candle patterns
Parameters:
dojiSize : (float) The relationship of body to candle size (ie. body is 5% of total candle size). Default is 5.0 (5%)
dojiWickSize : (float) Maximum wick size comparative to the opposite wick. (eg. 2 = bottom wick must be less than or equal to 2x the top wick). Default is 2
Returns: (series bool) True when pattern detected
dLab(showLabel, labelColor, textColor) Produces "Doji" identifier label
Parameters:
showLabel : (bool) Shows label when input is true. Default is false
labelColor : (series color) Color of the label border and arrow
textColor : (series color) Text color
Returns: (series label) A label visible at the chart level intended for the title pattern
bullEngulf(maxRejectWick, mustEngulfWick) Detects "Bullish Engulfing" candle patterns
Parameters:
maxRejectWick : (float) Maximum rejection wick size.
The maximum wick size as a percentge of body size allowable for a top wick on the resolution candle of the pattern. 0.0 disables the filter.
eg. 50 allows a top wick half the size of the body. Default is 0% (Disables wick detection).
mustEngulfWick : (bool) input to only detect setups that close above the high prior effectively engulfing the candle in its entirety. Default is false
Returns: (series bool) True when pattern detected
bewLab(showLabel, labelColor, textColor) Produces "Bullish Engulfing" identifier label
Parameters:
showLabel : (bool) Shows label when input is true. Default is false
labelColor : (series color) Color of the label border and arrow
textColor : (series color) Text color
Returns: (series label) A label visible at the chart level intended for the title pattern
bearEngulf(maxRejectWick, mustEngulfWick) Detects "Bearish Engulfing" candle patterns
Parameters:
maxRejectWick : (float) Maximum rejection wick size.
The maximum wick size as a percentge of body size allowable for a bottom wick on the resolution candle of the pattern. 0.0 disables the filter.
eg. 50 allows a botom wick half the size of the body. Default is 0% (Disables wick detection).
mustEngulfWick : (bool) Input to only detect setups that close below the low prior effectively engulfing the candle in its entirety. Default is false
Returns: (series bool) True when pattern detected
bebLab(showLabel, labelColor, textColor) Produces "Bearish Engulfing" identifier label
Parameters:
showLabel : (bool) Shows label when input is true. Default is false
labelColor : (series color) Color of the label border and arrow
textColor : (series color) Text color
Returns: (series label) A label visible at the chart level intended for the title pattern
hammer(ratio, shadowPercent) Detects "Hammer" candle patterns
Parameters:
ratio : (float) The relationship of body to candle size (ie. body is 33% of total candle size). Default is 33%.
shadowPercent : (float) The maximum allowable top wick size as a percentage of body size. Default is 5%.
Returns: (series bool) True when pattern detected
hLab(showLabel, labelColor, textColor) Produces "Hammer" identifier label
Parameters:
showLabel : (bool) Shows label when input is true. Default is false
labelColor : (series color) Color of the label border and arrow
textColor : (series color) Text color
Returns: (series label) A label visible at the chart level intended for the title pattern
star(ratio, shadowPercent) Detects "Star" candle patterns
Parameters:
ratio : (float) The relationship of body to candle size (ie. body is 33% of total candle size). Default is 33%.
shadowPercent : (float) The maximum allowable bottom wick size as a percentage of body size. Default is 5%.
Returns: (series bool) True when pattern detected
ssLab(showLabel, labelColor, textColor) Produces "Star" identifier label
Parameters:
showLabel : (bool) Shows label when input is true. Default is false
labelColor : (series color) Color of the label border and arrow
textColor : (series color) Text color
Returns: (series label) A label visible at the chart level intended for the title pattern
dragonflyDoji() Detects "Dragonfly Doji" candle patterns
Returns: (series bool) True when pattern detected
ddLab(showLabel, labelColor) Produces "Dragonfly Doji" identifier label
Parameters:
showLabel : (bool) Shows label when input is true. Default is false
labelColor : (series color) Color of the label border and arrow
Returns: (series label) A label visible at the chart level intended for the title pattern
gravestoneDoji() Detects "Gravestone Doji" candle patterns
Returns: (series bool) True when pattern detected
gdLab(showLabel, labelColor, textColor) Produces "Gravestone Doji" identifier label
Parameters:
showLabel : (bool) Shows label when input is true. Default is false
labelColor : (series color) Color of the label border and arrow
textColor : (series color) Text color
Returns: (series label) A label visible at the chart level intended for the title pattern
tweezerBottom(closeUpperHalf) Detects "Tweezer Bottom" candle patterns
Parameters:
closeUpperHalf : (bool) input to only detect setups that close above the mid-point of the candle prior increasing its bullish tendancy. Default is false
Returns: (series bool) True when pattern detected
tbLab(showLabel, labelColor, textColor) Produces "Tweezer Bottom" identifier label
Parameters:
showLabel : (bool) Shows label when input is true. Default is false
labelColor : (series color) Color of the label border and arrow
textColor : (series color) Text color
Returns: (series label) A label visible at the chart level intended for the title pattern
tweezerTop(closeLowerHalf) Detects "TweezerTop" candle patterns
Parameters:
closeLowerHalf : (bool) input to only detect setups that close below the mid-point of the candle prior increasing its bearish tendancy. Default is false
Returns: (series bool) True when pattern detected
ttLab(showLabel, labelColor, textColor) Produces "TweezerTop" identifier label
Parameters:
showLabel : (bool) Shows label when input is true. Default is false
labelColor : (series color) Color of the label border and arrow
textColor : (series color) Text color
Returns: (series label) A label visible at the chart level intended for the title pattern
spinningTopBull(wickSize) Detects "Bullish Spinning Top" candle patterns
Parameters:
wickSize : (float) input to adjust detection of the size of the top wick/ bottom wick as a percent of total candle size. Default is 34%, which ensures the wicks are both larger than the body.
Returns: (series bool) True when pattern detected
stwLab(showLabel, labelColor, textColor) Produces "Bullish Spinning Top" identifier label
Parameters:
showLabel : (bool) Shows label when input is true. Default is false
labelColor : (series color) Color of the label border and arrow
textColor : (series color) Text color
Returns: (series label) A label visible at the chart level intended for the title pattern
spinningTopBear(wickSize) Detects "Bearish Spinning Top" candle patterns
Parameters:
wickSize : (float) input to adjust detection of the size of the top wick/ bottom wick as a percent of total candle size. Default is 34%, which ensures the wicks are both larger than the body.
Returns: (series bool) True when pattern detected
stbLab(showLabel, labelColor, textColor) Produces "Bearish Spinning Top" identifier label
Parameters:
showLabel : (bool) Shows label when input is true. Default is false
labelColor : (series color) Color of the label border and arrow
textColor : (series color) Text color
Returns: (series label) A label visible at the chart level intended for the title pattern
spinningTop(wickSize) Detects "Spinning Top" candle patterns
Parameters:
wickSize : (float) input to adjust detection of the size of the top wick/ bottom wick as a percent of total candle size. Default is 34%, which ensures the wicks are both larger than the body.
Returns: (series bool) True when pattern detected
stLab(showLabel, labelColor, textColor) Produces "Spinning Top" identifier label
Parameters:
showLabel : (bool) Shows label when input is true. Default is false
labelColor : (series color) Color of the label border and arrow
textColor : (series color) Text color
Returns: (series label) A label visible at the chart level intended for the title pattern
morningStar() Detects "Bullish Morning Star" candle patterns
Returns: (series bool) True when pattern detected
msLab(showLabel, labelColor, textColor) Produces "Bullish Morning Star" identifier label
Parameters:
showLabel : (bool) Shows label when input is true. Default is false
labelColor : (series color) Color of the label border and arrow
textColor : (series color) Text color
Returns: (series label) A label visible at the chart level intended for the title pattern
eveningStar() Detects "Bearish Evening Star" candle patterns
Returns: (series bool) True when pattern detected
esLab(showLabel, labelColor, textColor) Produces "Bearish Evening Star" identifier label
Parameters:
showLabel : (bool) Shows label when input is true. Default is false
labelColor : (series color) Color of the label border and arrow
textColor : (series color) Text color
Returns: (series label) A label visible at the chart level intended for the title pattern
haramiBull() Detects "Bullish Harami" candle patterns
Returns: (series bool) True when pattern detected
hwLab(showLabel, labelColor, textColor) Produces "Bullish Harami" identifier label
Parameters:
showLabel : (bool) Shows label when input is true. Default is false
labelColor : (series color) Color of the label border and arrow
textColor : (series color) Text color
Returns: (series label) A label visible at the chart level intended for the title pattern
haramiBear() Detects "Bearish Harami" candle patterns
Returns: (series bool) True when pattern detected
hbLab(showLabel, labelColor, textColor) Produces "Bearish Harami" identifier label
Parameters:
showLabel : (bool) Shows label when input is true. Default is false
labelColor : (series color) Color of the label border and arrow
textColor : (series color) Text color
Returns: (series label) A label visible at the chart level intended for the title pattern
haramiBullCross() Detects "Bullish Harami Cross" candle patterns
Returns: (series bool) True when pattern detected
hcwLab(showLabel, labelColor, textColor) Produces "Bullish Harami Cross" identifier label
Parameters:
showLabel : (bool) Shows label when input is true. Default is false
labelColor : (series color) Color of the label border and arrow
textColor : (series color) Text color
Returns: (series label) A label visible at the chart level intended for the title pattern
haramiBearCross() Detects "Bearish Harami Cross" candle patterns
Returns: (series bool) True when pattern detected
hcbLab(showLabel, labelColor) Produces "Bearish Harami Cross" identifier label
Parameters:
showLabel : (bool) Shows label when input is true. Default is false
labelColor : (series color) Color of the label border and arrow
Returns: (series label) A label visible at the chart level intended for the title pattern
marubullzu() Detects "Bullish Marubozu" candle patterns
Returns: (series bool) True when pattern detected
mwLab(showLabel, labelColor, textColor) Produces "Bullish Marubozu" identifier label
Parameters:
showLabel : (bool) Shows label when input is true. Default is false
labelColor : (series color) Color of the label border and arrow
textColor : (series color) Text color
Returns: (series label) A label visible at the chart level intended for the title pattern
marubearzu() Detects "Bearish Marubozu" candle patterns
Returns: (series bool) True when pattern detected
mbLab(showLabel, labelColor, textColor) Produces "Bearish Marubozu" identifier label
Parameters:
showLabel : (bool) Shows label when input is true. Default is false
labelColor : (series color) Color of the label border and arrow
textColor : (series color) Text color
Returns: (series label) A label visible at the chart level intended for the title pattern
abandonedBull() Detects "Bullish Abandoned Baby" candle patterns
Returns: (series bool) True when pattern detected
abwLab(showLabel, labelColor, textColor) Produces "Bullish Abandoned Baby" identifier label
Parameters:
showLabel : (bool) Shows label when input is true. Default is false
labelColor : (series color) Color of the label border and arrow
textColor : (series color) Text color
Returns: (series label) A label visible at the chart level intended for the title pattern
abandonedBear() Detects "Bearish Abandoned Baby" candle patterns
Returns: (series bool) True when pattern detected
abbLab(showLabel, labelColor, textColor) Produces "Bearish Abandoned Baby" identifier label
Parameters:
showLabel : (bool) Shows label when input is true. Default is false
labelColor : (series color) Color of the label border and arrow
textColor : (series color) Text color
Returns: (series label) A label visible at the chart level intended for the title pattern
piercing() Detects "Piercing" candle patterns
Returns: (series bool) True when pattern detected
pLab(showLabel, labelColor, textColor) Produces "Piercing" identifier label
Parameters:
showLabel : (bool) Shows label when input is true. Default is false
labelColor : (series color) Color of the label border and arrow
textColor : (series color) Text color
Returns: (series label) A label visible at the chart level intended for the title pattern
darkCloudCover() Detects "Dark Cloud Cover" candle patterns
Returns: (series bool) True when pattern detected
dccLab(showLabel, labelColor, textColor) Produces "Dark Cloud Cover" identifier label
Parameters:
showLabel : (bool) Shows label when input is true. Default is false
labelColor : (series color) Color of the label border and arrow
textColor : (series color) Text color
Returns: (series label) A label visible at the chart level intended for the title pattern
tasukiBull() Detects "Upside Tasuki Gap" candle patterns
Returns: (series bool) True when pattern detected
utgLab(showLabel, labelColor, textColor) Produces "Upside Tasuki Gap" identifier label
Parameters:
showLabel : (bool) Shows label when input is true. Default is false
labelColor : (series color) Color of the label border and arrow
textColor : (series color) Text color
Returns: (series label) A label visible at the chart level intended for the title pattern
tasukiBear() Detects "Downside Tasuki Gap" candle patterns
Returns: (series bool) True when pattern detected
dtgLab(showLabel, labelColor, textColor) Produces "Downside Tasuki Gap" identifier label
Parameters:
showLabel : (bool) Shows label when input is true. Default is false
labelColor : (series color) Color of the label border and arrow
textColor : (series color) Text color
Returns: (series label) A label visible at the chart level intended for the title pattern
risingThree() Detects "Rising Three Methods" candle patterns
Returns: (series bool) True when pattern detected
rtmLab(showLabel, labelColor, textColor) Produces "Rising Three Methods" identifier label
Parameters:
showLabel : (bool) Shows label when input is true. Default is false
labelColor : (series color) Color of the label border and arrow
textColor : (series color) Text color
Returns: (series label) A label visible at the chart level intended for the title pattern
fallingThree() Detects "Falling Three Methods" candle patterns
Returns: (series bool) True when pattern detected
ftmLab(showLabel, labelColor, textColor) Produces "Falling Three Methods" identifier label
Parameters:
showLabel : (bool) Shows label when input is true. Default is false
labelColor : (series color) Color of the label border and arrow
textColor : (series color) Text color
Returns: (series label) A label visible at the chart level intended for the title pattern
risingWindow() Detects "Rising Window" candle patterns
Returns: (series bool) True when pattern detected
rwLab(showLabel, labelColor, textColor) Produces "Rising Window" identifier label
Parameters:
showLabel : (bool) Shows label when input is true. Default is false
labelColor : (series color) Color of the label border and arrow
textColor : (series color) Text color
Returns: (series label) A label visible at the chart level intended for the title pattern
fallingWindow() Detects "Falling Window" candle patterns
Returns: (series bool) True when pattern detected
fwLab(showLabel, labelColor, textColor) Produces "Falling Window" identifier label
Parameters:
showLabel : (bool) Shows label when input is true. Default is false
labelColor : (series color) Color of the label border and arrow
textColor : (series color) Text color
Returns: (series label) A label visible at the chart level intended for the title pattern
kickingBull() Detects "Bullish Kicking" candle patterns
Returns: (series bool) True when pattern detected
kwLab(showLabel, labelColor, textColor) Produces "Bullish Kicking" identifier label
Parameters:
showLabel : (bool) Shows label when input is true. Default is false
labelColor : (series color) Color of the label border and arrow
textColor : (series color) Text color
Returns: (series label) A label visible at the chart level intended for the title pattern
kickingBear() Detects "Bearish Kicking" candle patterns
Returns: (series bool) True when pattern detected
kbLab(showLabel, labelColor, textColor) Produces "Bearish Kicking" identifier label
Parameters:
showLabel : (bool) Shows label when input is true. Default is false
labelColor : (series color) Color of the label border and arrow
textColor : (series color) Text color
Returns: (series label) A label visible at the chart level intended for the title pattern
lls(ratio) Detects "Long Lower Shadow" candle patterns
Parameters:
ratio : (float) A relationship of the lower wick to the overall candle size expressed as a percent. Default is 75%
Returns: (series bool) True when pattern detected
llsLab(showLabel, labelColor, textColor) Produces "Long Lower Shadow" identifier label
Parameters:
showLabel : (bool) Shows label when input is true. Default is false
labelColor : (series color) Color of the label border and arrow
textColor : (series color) Text color
Returns: (series label) A label visible at the chart level intended for the title pattern
lus(ratio) Detects "Long Upper Shadow" candle patterns
Parameters:
ratio : (float) A relationship of the upper wick to the overall candle size expressed as a percent. Default is 75%
Returns: (series bool) True when pattern detected
lusLab(showLabel, labelColor, textColor) Produces "Long Upper Shadow" identifier label
Parameters:
showLabel : (bool) Shows label when input is true. Default is false
labelColor : (series color) Color of the label border and arrow
textColor : (series color) Text color
Returns: (series label) A label visible at the chart level intended for the title pattern
bullNeck() Detects "Bullish On Neck" candle patterns
Returns: (series bool) True when pattern detected
nwLab(showLabel, labelColor, textColor) Produces "Bullish On Neck" identifier label
Parameters:
showLabel : (bool) Shows label when input is true. Default is false
labelColor : (series color) Color of the label border and arrow
textColor : (series color) Text color
Returns: (series label) A label visible at the chart level intended for the title pattern
bearNeck() Detects "Bearish On Neck" candle patterns
Returns: (series bool) True when pattern detected
nbLab(showLabel, labelColor, textColor) Produces "Bearish On Neck" identifier label
Parameters:
showLabel : (bool) Shows label when input is true. Default is false
labelColor : (series color) Color of the label border and arrow
textColor : (series color) Text color
Returns: (series label) A label visible at the chart level intended for the title pattern
soldiers(wickSize) Detects "Three White Soldiers" candle patterns
Parameters:
wickSize : (float) Maximum allowable top wick size throughout pattern expressed as a percent of total candle height. Default is 5%
Returns: (series bool) True when pattern detected
wsLab(showLabel, labelColor, textColor) Produces "Three White Soldiers" identifier label
Parameters:
showLabel : (bool) Shows label when input is true. Default is false
labelColor : (series color) Color of the label border and arrow
textColor : (series color) Text color
Returns: (series label) A label visible at the chart level intended for the title pattern
crows(wickSize) Detects "Three Black Crows" candle patterns
Parameters:
wickSize : (float) Maximum allowable bottom wick size throughout pattern expressed as a percent of total candle height. Default is 5%
Returns: (series bool) True when pattern detected
bcLab(showLabel, labelColor, textColor) Produces "Three Black Crows" identifier label
Parameters:
showLabel : (bool) Shows label when input is true. Default is false
labelColor : (series color) Color of the label border and arrow
textColor : (series color) Text color
Returns: (series label) A label visible at the chart level intended for the title pattern
triStarBull() Detects "Bullish Tri-Star" candle patterns
Returns: (series bool) True when pattern detected
tswLab(showLabel, labelColor, textColor) Produces "Bullish Tri-Star" identifier label
Parameters:
showLabel : (bool) Shows label when input is true. Default is false
labelColor : (series color) Color of the label border and arrow
textColor : (series color) Text color
Returns: (series label) A label visible at the chart level intended for the title pattern
triStarBear() Detects "Bearish Tri-Star" candle patterns
Returns: (series bool) True when pattern detected
tsbLab(showLabel, labelColor, textColor) Produces "Bearish Tri-Star" identifier label
Parameters:
showLabel : (bool) Shows label when input is true. Default is false
labelColor : (series color) Color of the label border and arrow
textColor : (series color) Text color
Returns: (series label) A label visible at the chart level intended for the title pattern
wrap(cond, barsBack, borderColor, bgcolor) Produces a box wrapping the highs and lows over the look back.
Parameters:
cond : (series bool) Condition under which to draw the box.
barsBack : (series int) the number of bars back to begin drawing the box.
borderColor : (series color) Color of the four borders. Optional. The default is color.gray.
bgcolor : (series color) Background color of the box. Optional. The default is color.gray.
Returns: (series box) A box who's top and bottom are above and below the highest and lowest points over the lookback
topWick() returns the top wick size of the current candle
Returns: (series float) A value equivelent to the distance from the top of the candle body to its high
bottomWick() returns the bottom wick size of the current candle
Returns: (series float) A value equivelent to the distance from the bottom of the candle body to its low
body() returns the body size of the current candle
Returns: (series float) A value equivelent to the distance between the top and the bottom of the candle body
highestBody() returns the highest body of the current candle
Returns: (series float) A value equivelent to the highest body, whether it is the open or the close
lowestBody() returns the lowest body of the current candle
Returns: (series float) A value equivelent to the highest body, whether it is the open or the close
barRange() returns the height of the current candle
Returns: (series float) A value equivelent to the distance between the high and the low of the candle
bodyPct() returns the body size as a percent
Returns: (series float) A value equivelent to the percentage of body size to the overall candle size
midBody() returns the price of the mid-point of the candle body
Returns: (series float) A value equivelent to the center point of the distance bewteen the body low and the body high
bodyupGap() returns true if there is a gap up between the real body of the current candle in relation to the candle prior
Returns: (series bool) true if there is a gap up and no overlap in the real bodies of the current candle and the preceding candle
bodydwnGap() returns true if there is a gap down between the real body of the current candle in relation to the candle prior
Returns: (series bool) true if there is a gap down and no overlap in the real bodies of the current candle and the preceding candle
gapUp() returns true if there is a gap down between the real body of the current candle in relation to the candle prior
Returns: (series bool) true if there is a gap down and no overlap in the real bodies of the current candle and the preceding candle
gapDwn() returns true if there is a gap down between the real body of the current candle in relation to the candle prior
Returns: (series bool) true if there is a gap down and no overlap in the real bodies of the current candle and the preceding candle
dojiBody() returns true if the candle body is a doji
Returns: (series bool) true if the candle body is a doji. Defined by a body that is 5% of total candle size

Khango's Key//@version=5
//@sbtnc thank you for doing the base code
//Added additional levels for convienience sake.
indicator('Key Levels SpacemanBTC IDWM', shorttitle='Khangos Key', overlay=true, max_lines_count=100)
//35 works
displayStyle = input.string(defval='Standard', title='Display Style', options= , inline='Display')
mergebool = input.bool(defval=true, title='Merge Levels?', inline='Display')
distanceright = input.int(defval=30, title='Distance', minval=5, maxval=500, inline='Dist')
radistance = input.int(defval=250, title='Anchor Distance', minval=5, maxval=500, inline='Dist')
labelsize = input.string(defval='Medium', title='Text Size', options= )
linesize = input.string(defval='Small', title='Line Width', options= , inline='Line')
linestyle = input.string(defval='Solid', title='Line Style', options= , inline='Line')
GlobalTextType = input.bool(defval=false, title='Global Text ShortHand', tooltip='Enable for shorthand text on all text')
var globalcoloring = input.bool(defval=false, title='Global Coloring', tooltip='Enable for all color controls via one color', inline='GC')
GlobalColor = input.color(title='', defval=color.white, inline='GC')
//var show_tails = input(defval = false, title = "Always Show", type = input.bool)
= request.security(syminfo.tickerid, 'D', , lookahead=barmerge.lookahead_on)
= request.security(syminfo.tickerid, 'D', [time , high ], lookahead=barmerge.lookahead_on)
= request.security(syminfo.tickerid, 'D', [time , low ], lookahead=barmerge.lookahead_on)
cdailyh_open = request.security(syminfo.tickerid, 'D', high, lookahead=barmerge.lookahead_on)
cdailyl_open = request.security(syminfo.tickerid, 'D', low, lookahead=barmerge.lookahead_on)
var monday_time = time
var monday_high = high
var monday_low = low
= request.security(syminfo.tickerid, 'W', , lookahead=barmerge.lookahead_on)
= request.security(syminfo.tickerid, 'W', [time , high ], lookahead=barmerge.lookahead_on)
= request.security(syminfo.tickerid, 'W', [time , low ], lookahead=barmerge.lookahead_on)
= request.security(syminfo.tickerid, 'M', , lookahead=barmerge.lookahead_on)
= request.security(syminfo.tickerid, 'M', [time , high ], lookahead=barmerge.lookahead_on)
= request.security(syminfo.tickerid, 'M', [time , low ], lookahead=barmerge.lookahead_on)
= request.security(syminfo.tickerid, '3M', , lookahead=barmerge.lookahead_on)
= request.security(syminfo.tickerid, '3M', [time , high ], lookahead=barmerge.lookahead_on)
= request.security(syminfo.tickerid, '3M', [time , low ], lookahead=barmerge.lookahead_on)
= request.security(syminfo.tickerid, '12M', , lookahead=barmerge.lookahead_on)
= request.security(syminfo.tickerid, '12M', , lookahead=barmerge.lookahead_on)
= request.security(syminfo.tickerid, '12M', , lookahead=barmerge.lookahead_on)
= request.security(syminfo.tickerid, '240', , lookahead=barmerge.lookahead_on)
= request.security(syminfo.tickerid, '240', [time , high ], lookahead=barmerge.lookahead_on)
= request.security(syminfo.tickerid, '240', [time , low ], lookahead=barmerge.lookahead_on)
//------------------------------ Inputs -------------------------------
var is_intra_enabled = input.bool(defval=false, title='Open', group='4H', inline='4H')
var is_intrarange_enabled = input.bool(defval=false, title='Prev H/L', group='4H', inline='4H')
var is_intram_enabled = input.bool(defval=false, title='Prev Mid', group='4H', inline='4H')
IntraTextType = input.bool(defval=false, title='ShortHand', group='4H', inline='4Hsh')
var is_daily_enabled = input.bool(defval=true, title='Open', group='Daily', inline='Daily')
var is_dailyrange_enabled = input.bool(defval=false, title='Prev H/L', group='Daily', inline='Daily')
var is_dailym_enabled = input.bool(defval=false, title='Prev Mid', group='Daily', inline='Daily')
DailyTextType = input.bool(defval=false, title='ShortHand', group='Daily', inline='Dailysh')
var is_monday_enabled = input.bool(defval=true, title='Range', group='Monday Range', inline='Monday')
var is_monday_mid = input.bool(defval=true, title='Mid', group='Monday Range', inline='Monday')
var untested_monday = false
MondayTextType = input.bool(defval=false, title='ShortHand', group='Monday Range', inline='Mondaysh')
var is_weekly_enabled = input.bool(defval=true, title='Open', group='Weekly', inline='Weekly')
var is_weeklyrange_enabled = input.bool(defval=true, title='Prev H/L', group='Weekly', inline='Weekly')
var is_weekly_mid = input.bool(defval=true, title='Prev Mid', group='Weekly', inline='Weekly')
WeeklyTextType = input.bool(defval=false, title='ShortHand', group='Weekly', inline='Weeklysh')
var is_monthly_enabled = input.bool(defval=true, title='Open', group='Monthly', inline='Monthly')
var is_monthlyrange_enabled = input.bool(defval=true, title='Prev H/L', group='Monthly', inline='Monthly')
var is_monthly_mid = input.bool(defval=true, title='Prev Mid', group='Monthly', inline='Monthly')
MonthlyTextType = input.bool(defval=false, title='ShortHand', group='Monthly', inline='Monthlysh')
var is_quarterly_enabled = input.bool(defval=true, title='Open', group='Quarterly', inline='Quarterly')
var is_quarterlyrange_enabled = input.bool(defval=false, title='Prev H/L', group='Quarterly', inline='Quarterly')
var is_quarterly_mid = input.bool(defval=true, title='Prev Mid', group='Quarterly', inline='Quarterly')
QuarterlyTextType = input.bool(defval=false, title='ShortHand', group='Quarterly', inline='Quarterlysh')
var is_yearly_enabled = input.bool(defval=true, title='Open', group='Yearly', inline='Yearly')
var is_yearlyrange_enabled = input.bool(defval=false, title='Current H/L', group='Yearly', inline='Yearly')
var is_yearly_mid = input.bool(defval=true, title='Mid', group='Yearly', inline='Yearly')
YearlyTextType = input.bool(defval=false, title='ShortHand', group='Yearly', inline='Yearlysh')
var is_londonrange_enabled = input.bool(defval=false, title='London Range', group='FX Sessions', inline='FX')
var is_usrange_enabled = input.bool(defval=false, title='New York Range', group='FX Sessions', inline='FX')
var is_asiarange_enabled = input.bool(defval=false, title='Asia Range', group='FX Sessions', inline='FX')
SessionTextType = input.bool(defval=false, title='ShortHand', group='FX Sessions', inline='FXColor')
Londont = input.session("0800-1600", "London Session")
USt = input.session("1400-2100", "New York Session")
Asiat = input.session("0000-0900", "Tokyo Session")
DailyColor = input.color(title='', defval=#08bcd4, group='Daily', inline='Dailysh')
MondayColor = input.color(title='', defval=color.white, group='Monday Range', inline='Mondaysh')
WeeklyColor = input.color(title='', defval=#fffcbc, group='Weekly', inline='Weeklysh')
MonthlyColor = input.color(title='', defval=#08d48c, group='Monthly', inline='Monthlysh')
YearlyColor = input.color(title='', defval=color.red, group='Yearly', inline='Yearlysh')
quarterlyColor = input.color(title='', defval=color.red, group='Quarterly', inline='Quarterlysh')
IntraColor = input.color(title='', defval=color.orange, group='4H', inline='4Hsh')
LondonColor = input.color(title='', defval=color.white, group='FX Sessions', inline='FXColor')
USColor = input.color(title='', defval=color.white, group='FX Sessions', inline='FXColor')
AsiaColor = input.color(title='', defval=color.white, group='FX Sessions', inline='FXColor')
var pdhtext = GlobalTextType or DailyTextType ? 'PDH' : 'Prev Day High'
var pdltext = GlobalTextType or DailyTextType ? 'PDL' : 'Prev Day Low'
var dotext = GlobalTextType or DailyTextType ? 'DO' : 'Daily Open'
var pdmtext = GlobalTextType or DailyTextType ? 'PDM' : 'Prev Day Mid'
var pwhtext = GlobalTextType or WeeklyTextType ? 'PWH' : 'Prev Week High'
var pwltext = GlobalTextType or WeeklyTextType ? 'PWL' : 'Prev Week Low'
var wotext = GlobalTextType or WeeklyTextType ? 'WO' : 'Weekly Open'
var pwmtext = GlobalTextType or WeeklyTextType ? 'PWM' : 'Prev Week Mid'
var pmhtext = GlobalTextType or MonthlyTextType ? 'PMH' : 'Prev Month High'
var pmltext = GlobalTextType or MonthlyTextType ? 'PML' : 'Prev Month Low'
var motext = GlobalTextType or MonthlyTextType ? 'MO' : 'Monthly Open'
var pmmtext = GlobalTextType or MonthlyTextType ? 'PMM' : 'Prev Month Mid'
var pqhtext = GlobalTextType or QuarterlyTextType ? 'PQH' : 'Prev Quarter High'
var pqltext = GlobalTextType or QuarterlyTextType ? 'PQL' : 'Prev Quarter Low'
var qotext = GlobalTextType or QuarterlyTextType ? 'QO' : 'Quarterly Open'
var pqmtext = GlobalTextType or QuarterlyTextType ? 'PQM' : 'Prev Quarter Mid'
var cyhtext = GlobalTextType or YearlyTextType ? 'CYH' : 'Current Year High'
var cyltext = GlobalTextType or YearlyTextType ? 'CYL' : 'Current Year Low'
var yotext = GlobalTextType or YearlyTextType ? 'YO' : 'Yearly Open'
var cymtext = GlobalTextType or YearlyTextType ? 'CYM' : 'Current Year Mid'
var pihtext = GlobalTextType or IntraTextType ? 'P-4H-H' : 'Prev 4H High'
var piltext = GlobalTextType or IntraTextType ? 'P-4H-L' : 'Prev 4H Low'
var iotext = GlobalTextType or IntraTextType ? '4H-O' : '4H Open'
var pimtext = GlobalTextType or IntraTextType ? 'P-4H-M' : 'Prev 4H Mid'
var pmonhtext = GlobalTextType or MondayTextType ? 'MDAY-H' : 'Monday High'
var pmonltext = GlobalTextType or MondayTextType ? 'MDAY-L' : 'Monday Low'
var pmonmtext = GlobalTextType or MondayTextType ? 'MDAY-M' : 'Monday Mid'
var lhtext = GlobalTextType or SessionTextType ? 'Lon-H' : 'London High'
var lltext = GlobalTextType or SessionTextType ? 'Lon-L' : 'London Low'
var lotext = GlobalTextType or SessionTextType ? 'Lon-O' : 'London Open'
var ushtext = GlobalTextType or SessionTextType ? 'NY-H' : 'New York High'
var usltext = GlobalTextType or SessionTextType ? 'NY-L' : 'New York Low'
var usotext = GlobalTextType or SessionTextType ? 'NY-O' : 'New York Open'
var asiahtext = GlobalTextType or SessionTextType ? 'AS-H' : 'Asia High'
var asialtext = GlobalTextType or SessionTextType ? 'AS-L' : 'Asia Low'
var asiaotext = GlobalTextType or SessionTextType ? 'AS-O' : 'Asia Open'
if globalcoloring == true
DailyColor := GlobalColor
MondayColor := GlobalColor
WeeklyColor := GlobalColor
MonthlyColor := GlobalColor
YearlyColor := GlobalColor
quarterlyColor := GlobalColor
IntraColor := GlobalColor
IntraColor
if weekly_time != weekly_time
untested_monday := false
untested_monday
if is_monday_enabled == true and untested_monday == false
untested_monday := true
monday_time := daily_time
monday_high := cdailyh_open
monday_low := cdailyl_open
monday_low
linewidthint = 1
if linesize == 'Small'
linewidthint := 1
linewidthint
if linesize == 'Medium'
linewidthint := 2
linewidthint
if linesize == 'Large'
linewidthint := 3
linewidthint
var DEFAULT_LINE_WIDTH = linewidthint
var DEFAULT_TAIL_WIDTH = linewidthint
fontsize = size.small
if labelsize == 'Small'
fontsize := size.small
fontsize
if labelsize == 'Medium'
fontsize := size.normal
fontsize
if labelsize == 'Large'
fontsize := size.large
fontsize
linestyles = line.style_solid
if linestyle == 'Dashed'
linestyles := line.style_dashed
linestyles
if linestyle == 'Dotted'
linestyles := line.style_dotted
linestyles
var DEFAULT_LABEL_SIZE = fontsize
var DEFAULT_LABEL_STYLE = label.style_none
var DEFAULT_EXTEND_RIGHT = distanceright
London = time(timeframe.period, Londont)
US = time(timeframe.period, USt)
Asia = time(timeframe.period, Asiat)
var clondonhigh = 0.0
var clondonlow = close
var londontime = time
var flondonhigh = 0.0
var flondonlow = 0.0
var flondonopen = 0.0
var onelondonfalse = false
if London
if high > clondonhigh
clondonhigh := high
clondonhigh
if low < clondonlow
clondonlow := low
clondonlow
if onelondonfalse
londontime := time
flondonopen := open
flondonopen
flondonhigh := clondonhigh
flondonlow := clondonlow
onelondonfalse := false
onelondonfalse
else
if onelondonfalse == false
flondonhigh := clondonhigh
flondonlow := clondonlow
flondonlow
onelondonfalse := true
clondonhigh := 0.0
clondonlow := close
clondonlow
//////////////////////////////////
var cushigh = 0.0
var cuslow = close
var ustime = time
var fushigh = 0.0
var fuslow = 0.0
var fusopen = 0.0
var oneusfalse = false
if US
if high > cushigh
cushigh := high
cushigh
if low < cuslow
cuslow := low
cuslow
if oneusfalse
ustime := time
fusopen := open
fusopen
fushigh := cushigh
fuslow := cuslow
oneusfalse := false
oneusfalse
else
if oneusfalse == false
fushigh := cushigh
fuslow := cuslow
fuslow
oneusfalse := true
cushigh := 0.0
cuslow := close
cuslow
//////////////////////////////////
var casiahigh = 0.0
var casialow = close
var asiatime = time
var fasiahigh = 0.0
var fasialow = 0.0
var fasiaopen = 0.0
var oneasiafalse = false
if Asia
if high > casiahigh
casiahigh := high
casiahigh
if low < casialow
casialow := low
casialow
if oneasiafalse
asiatime := time
fasiaopen := open
fasiaopen
fasiahigh := casiahigh
fasialow := casialow
oneasiafalse := false
oneasiafalse
else
if oneasiafalse == false
fasiahigh := casiahigh
fasialow := casialow
fasialow
oneasiafalse := true
casiahigh := 0.0
casialow := close
casialow
//------------------------------ Plotting ------------------------------
var pricearray = array.new_float(0)
var labelarray = array.new_label(0)
f_LevelMerge(pricearray, labelarray, currentprice, currentlabel, currentcolor) =>
if array.includes(pricearray, currentprice)
whichindex = array.indexof(pricearray, currentprice)
labelhold = array.get(labelarray, whichindex)
whichtext = label.get_text(labelhold)
label.set_text(labelhold, label.get_text(currentlabel) + ' / ' + whichtext)
label.set_text(currentlabel, '')
label.set_textcolor(labelhold, currentcolor)
else
array.push(pricearray, currentprice)
array.push(labelarray, currentlabel)
var can_show_daily = is_daily_enabled and timeframe.isintraday
var can_show_weekly = is_weekly_enabled and not timeframe.isweekly and not timeframe.ismonthly
var can_show_monthly = is_monthly_enabled and not timeframe.ismonthly
get_limit_right(bars) =>
timenow + (time - time ) * bars
// the following code doesn't need to be processed on every candle
if barstate.islast
is_weekly_open = dayofweek == dayofweek.monday
is_monthly_open = dayofmonth == 1
can_draw_daily = (is_weekly_enabled ? not is_weekly_open : true) and (is_monthly_enabled ? not is_monthly_open : true)
can_draw_weekly = is_monthly_enabled ? not(is_monthly_open and is_weekly_open) : true
can_draw_intra = is_intra_enabled
can_draw_intrah = is_intrarange_enabled
can_draw_intral = is_intrarange_enabled
can_draw_intram = is_intram_enabled
pricearray := array.new_float(0)
labelarray := array.new_label(0)
/////////////////////////////////
if is_londonrange_enabled
//label.new(bar_index,high)
london_limit_right = get_limit_right(DEFAULT_EXTEND_RIGHT)
if displayStyle == 'Right Anchored'
londontime := get_limit_right(radistance)
londontime
var londonh_line = line.new(x1=londontime, x2=london_limit_right, y1=flondonhigh, y2=flondonhigh, color=LondonColor, width=DEFAULT_LINE_WIDTH, xloc=xloc.bar_time, style=linestyles)
var londonl_line = line.new(x1=londontime, x2=london_limit_right, y1=flondonlow, y2=flondonlow, color=LondonColor, width=DEFAULT_LINE_WIDTH, xloc=xloc.bar_time, style=linestyles)
var londono_line = line.new(x1=londontime, x2=london_limit_right, y1=flondonopen, y2=flondonopen, color=LondonColor, width=DEFAULT_LINE_WIDTH, xloc=xloc.bar_time, style=linestyles)
var londonh_label = label.new(x=london_limit_right, y=flondonhigh, text=lhtext, style=DEFAULT_LABEL_STYLE, textcolor=LondonColor, size=DEFAULT_LABEL_SIZE, xloc=xloc.bar_time)
var londonl_label = label.new(x=london_limit_right, y=flondonlow, text=lltext, style=DEFAULT_LABEL_STYLE, textcolor=LondonColor, size=DEFAULT_LABEL_SIZE, xloc=xloc.bar_time)
var londono_label = label.new(x=london_limit_right, y=flondonopen, text=lotext, style=DEFAULT_LABEL_STYLE, textcolor=LondonColor, size=DEFAULT_LABEL_SIZE, xloc=xloc.bar_time)
line.set_x1(londonh_line, londontime)
line.set_x2(londonh_line, london_limit_right)
line.set_y1(londonh_line, flondonhigh)
line.set_y2(londonh_line, flondonhigh)
line.set_x1(londonl_line, londontime)
line.set_x2(londonl_line, london_limit_right)
line.set_y1(londonl_line, flondonlow)
line.set_y2(londonl_line, flondonlow)
line.set_x1(londono_line, londontime)
line.set_x2(londono_line, london_limit_right)
line.set_y1(londono_line, flondonopen)
line.set_y2(londono_line, flondonopen)
label.set_x(londonh_label, london_limit_right)
label.set_y(londonh_label, flondonhigh)
label.set_text(londonh_label, lhtext)
label.set_x(londonl_label, london_limit_right)
label.set_y(londonl_label, flondonlow)
label.set_text(londonl_label, lltext)
label.set_x(londono_label, london_limit_right)
label.set_y(londono_label, flondonopen)
label.set_text(londono_label, lotext)
if mergebool
f_LevelMerge(pricearray, labelarray, flondonhigh, londonh_label, LondonColor)
f_LevelMerge(pricearray, labelarray, flondonlow, londonl_label, LondonColor)
f_LevelMerge(pricearray, labelarray, flondonopen, londono_label, LondonColor)
//////////////////////////////////////////////////////////////////////////////////
/////////////////////////////////
if is_usrange_enabled
//label.new(bar_index,high)
us_limit_right = get_limit_right(DEFAULT_EXTEND_RIGHT)
if displayStyle == 'Right Anchored'
ustime := get_limit_right(radistance)
ustime
var ush_line = line.new(x1=ustime, x2=us_limit_right, y1=fushigh, y2=fushigh, color=USColor, width=DEFAULT_LINE_WIDTH, xloc=xloc.bar_time, style=linestyles)
var usl_line = line.new(x1=ustime, x2=us_limit_right, y1=fuslow, y2=fuslow, color=USColor, width=DEFAULT_LINE_WIDTH, xloc=xloc.bar_time, style=linestyles)
var uso_line = line.new(x1=ustime, x2=us_limit_right, y1=fusopen, y2=fusopen, color=USColor, width=DEFAULT_LINE_WIDTH, xloc=xloc.bar_time, style=linestyles)
var ush_label = label.new(x=us_limit_right, y=fushigh, text=lhtext, style=DEFAULT_LABEL_STYLE, textcolor=USColor, size=DEFAULT_LABEL_SIZE, xloc=xloc.bar_time)
var usl_label = label.new(x=us_limit_right, y=fuslow, text=lltext, style=DEFAULT_LABEL_STYLE, textcolor=USColor, size=DEFAULT_LABEL_SIZE, xloc=xloc.bar_time)
var uso_label = label.new(x=us_limit_right, y=fusopen, text=lotext, style=DEFAULT_LABEL_STYLE, textcolor=USColor, size=DEFAULT_LABEL_SIZE, xloc=xloc.bar_time)
line.set_x1(ush_line, ustime)
line.set_x2(ush_line, us_limit_right)
line.set_y1(ush_line, fushigh)
line.set_y2(ush_line, fushigh)
line.set_x1(usl_line, ustime)
line.set_x2(usl_line, us_limit_right)
line.set_y1(usl_line, fuslow)
line.set_y2(usl_line, fuslow)
line.set_x1(uso_line, ustime)
line.set_x2(uso_line, us_limit_right)
line.set_y1(uso_line, fusopen)
line.set_y2(uso_line, fusopen)
label.set_x(ush_label, us_limit_right)
label.set_y(ush_label, fushigh)
label.set_text(ush_label, ushtext)
label.set_x(usl_label, us_limit_right)
label.set_y(usl_label, fuslow)
label.set_text(usl_label, usltext)
label.set_x(uso_label, us_limit_right)
label.set_y(uso_label, fusopen)
label.set_text(uso_label, usotext)
if mergebool
f_LevelMerge(pricearray, labelarray, fushigh, ush_label, USColor)
f_LevelMerge(pricearray, labelarray, fuslow, usl_label, USColor)
f_LevelMerge(pricearray, labelarray, fusopen, uso_label, USColor)
/////////////////////////////////
if is_asiarange_enabled
//label.new(bar_index,high)
asia_limit_right = get_limit_right(DEFAULT_EXTEND_RIGHT)
if displayStyle == 'Right Anchored'
asiatime := get_limit_right(radistance)
asiatime
var asiah_line = line.new(x1=asiatime, x2=asia_limit_right, y1=fasiahigh, y2=fasiahigh, color=AsiaColor, width=DEFAULT_LINE_WIDTH, xloc=xloc.bar_time, style=linestyles)
var asial_line = line.new(x1=asiatime, x2=asia_limit_right, y1=fasialow, y2=fasialow, color=AsiaColor, width=DEFAULT_LINE_WIDTH, xloc=xloc.bar_time, style=linestyles)
var asiao_line = line.new(x1=asiatime, x2=asia_limit_right, y1=fasiaopen, y2=fasiaopen, color=AsiaColor, width=DEFAULT_LINE_WIDTH, xloc=xloc.bar_time, style=linestyles)
var asiah_label = label.new(x=asia_limit_right, y=fasiahigh, text=asiahtext, style=DEFAULT_LABEL_STYLE, textcolor=AsiaColor, size=DEFAULT_LABEL_SIZE, xloc=xloc.bar_time)
var asial_label = label.new(x=asia_limit_right, y=fasialow, text=asialtext, style=DEFAULT_LABEL_STYLE, textcolor=AsiaColor, size=DEFAULT_LABEL_SIZE, xloc=xloc.bar_time)
var asiao_label = label.new(x=asia_limit_right, y=fasiaopen, text=asiaotext, style=DEFAULT_LABEL_STYLE, textcolor=AsiaColor, size=DEFAULT_LABEL_SIZE, xloc=xloc.bar_time)
line.set_x1(asiah_line, asiatime)
line.set_x2(asiah_line, asia_limit_right)
line.set_y1(asiah_line, fasiahigh)
line.set_y2(asiah_line, fasiahigh)
line.set_x1(asial_line, asiatime)
line.set_x2(asial_line, asia_limit_right)
line.set_y1(asial_line, fasialow)
line.set_y2(asial_line, fasialow)
line.set_x1(asiao_line, asiatime)
line.set_x2(asiao_line, asia_limit_right)
line.set_y1(asiao_line, fasiaopen)
line.set_y2(asiao_line, fasiaopen)
label.set_x(asiah_label, asia_limit_right)
label.set_y(asiah_label, fasiahigh)
label.set_text(asiah_label, asiahtext)
label.set_x(asial_label, asia_limit_right)
label.set_y(asial_label, fasialow)
label.set_text(asial_label, asialtext)
label.set_x(asiao_label, asia_limit_right)
label.set_y(asiao_label, fasiaopen)
label.set_text(asiao_label, asiaotext)
if mergebool
f_LevelMerge(pricearray, labelarray, fasiahigh, asiah_label, AsiaColor)
f_LevelMerge(pricearray, labelarray, fasialow, asial_label, AsiaColor)
f_LevelMerge(pricearray, labelarray, fasiaopen, asiao_label, AsiaColor)
//////////////////////////////////////////////////////////////////////////////////
//////////////////////////////////////////////////////////////////////////////////
if can_draw_intra
intra_limit_right = get_limit_right(DEFAULT_EXTEND_RIGHT)
if displayStyle == 'Right Anchored'
intra_time := get_limit_right(radistance)
intra_time
var intra_line = line.new(x1=intra_time, x2=intra_limit_right, y1=intra_open, y2=intra_open, color=IntraColor, width=DEFAULT_LINE_WIDTH, xloc=xloc.bar_time, style=linestyles)
var intra_label = label.new(x=intra_limit_right, y=intra_open, text=iotext, style=DEFAULT_LABEL_STYLE, textcolor=IntraColor, size=DEFAULT_LABEL_SIZE, xloc=xloc.bar_time)
line.set_x1(intra_line, intra_time)
line.set_x2(intra_line, intra_limit_right)
line.set_y1(intra_line, intra_open)
line.set_y2(intra_line, intra_open)
label.set_x(intra_label, intra_limit_right)
label.set_y(intra_label, intra_open)
label.set_text(intra_label, iotext)
if mergebool
f_LevelMerge(pricearray, labelarray, intra_open, intra_label, IntraColor)
//////////////////////////////////////////////////////////////////////////////////
//HIGH HIGH HIGH HIGH HIGH HIGH HIGH HIGH HIGH HIGH HIGH HIGH HIGH HIGH HIGH HIGH
if can_draw_intrah
intrah_limit_right = get_limit_right(DEFAULT_EXTEND_RIGHT)
if displayStyle == 'Right Anchored'
intrah_time := get_limit_right(radistance)
intrah_time
var intrah_line = line.new(x1=intrah_time, x2=intrah_limit_right, y1=intrah_open, y2=intrah_open, color=IntraColor, width=DEFAULT_LINE_WIDTH, xloc=xloc.bar_time, style=linestyles)
var intrah_label = label.new(x=intrah_limit_right, y=intrah_open, text=pihtext, style=DEFAULT_LABEL_STYLE, textcolor=IntraColor, size=DEFAULT_LABEL_SIZE, xloc=xloc.bar_time)
line.set_x1(intrah_line, intrah_time)
line.set_x2(intrah_line, intrah_limit_right)
line.set_y1(intrah_line, intrah_open)
line.set_y2(intrah_line, intrah_open)
label.set_x(intrah_label, intrah_limit_right)
label.set_y(intrah_label, intrah_open)
label.set_text(intrah_label, pihtext)
if mergebool
f_LevelMerge(pricearray, labelarray, intrah_open, intrah_label, IntraColor)
//////////////////////////////////////////////////////////////////////////////////
//LOW LOW LOW LOW LOW LOW LOW LOW LOW LOW LOW LOW LOW LOW LOW LOW
if can_draw_intral
intral_limit_right = get_limit_right(DEFAULT_EXTEND_RIGHT)
if displayStyle == 'Right Anchored'
intral_time := get_limit_right(radistance)
intral_time
var intral_line = line.new(x1=intral_time, x2=intral_limit_right, y1=intral_open, y2=intral_open, color=IntraColor, width=DEFAULT_LINE_WIDTH, xloc=xloc.bar_time, style=linestyles)
var intral_label = label.new(x=intral_limit_right, y=intral_open, text=piltext, style=DEFAULT_LABEL_STYLE, textcolor=IntraColor, size=DEFAULT_LABEL_SIZE, xloc=xloc.bar_time)
line.set_x1(intral_line, intral_time)
line.set_x2(intral_line, intral_limit_right)
line.set_y1(intral_line, intral_open)
line.set_y2(intral_line, intral_open)
label.set_x(intral_label, intral_limit_right)
label.set_y(intral_label, intral_open)
label.set_text(intral_label, piltext)
if mergebool
f_LevelMerge(pricearray, labelarray, intral_open, intral_label, IntraColor)
///////////////////////////////////////////////////////////////////////////////
if can_draw_intram
intram_limit_right = get_limit_right(DEFAULT_EXTEND_RIGHT)
intram_time = intrah_time
intram_open = (intral_open + intrah_open) / 2
if displayStyle == 'Right Anchored'
intram_time := get_limit_right(radistance)
intram_time
var intram_line = line.new(x1=intram_time, x2=intram_limit_right, y1=intram_open, y2=intram_open, color=IntraColor, width=DEFAULT_LINE_WIDTH, xloc=xloc.bar_time, style=linestyles)
var intram_label = label.new(x=intram_limit_right, y=intram_open, text=pimtext, style=DEFAULT_LABEL_STYLE, textcolor=IntraColor, size=DEFAULT_LABEL_SIZE, xloc=xloc.bar_time)
line.set_x1(intram_line, intram_time)
line.set_x2(intram_line, intram_limit_right)
line.set_y1(intram_line, intram_open)
line.set_y2(intram_line, intram_open)
label.set_x(intram_label, intram_limit_right)
label.set_y(intram_label, intram_open)
label.set_text(intram_label, pimtext)
if mergebool
f_LevelMerge(pricearray, labelarray, intram_open, intram_label, IntraColor)
////////////////////////////////////////// MONDAY
if is_monday_enabled
monday_limit_right = get_limit_right(DEFAULT_EXTEND_RIGHT)
if displayStyle == 'Right Anchored'
monday_time := get_limit_right(radistance)
monday_time
var monday_line = line.new(x1=monday_time, x2=monday_limit_right, y1=monday_high, y2=monday_high, color=MondayColor, width=DEFAULT_LINE_WIDTH, xloc=xloc.bar_time, style=linestyles)
var monday_label = label.new(x=monday_limit_right, y=monday_high, text=pmonhtext, style=DEFAULT_LABEL_STYLE, textcolor=MondayColor, size=DEFAULT_LABEL_SIZE, xloc=xloc.bar_time)
line.set_x1(monday_line, monday_time)
line.set_x2(monday_line, monday_limit_right)
line.set_y1(monday_line, monday_high)
line.set_y2(monday_line, monday_high)
label.set_x(monday_label, monday_limit_right)
label.set_y(monday_label, monday_high)
label.set_text(monday_label, pmonhtext)
if mergebool
f_LevelMerge(pricearray, labelarray, monday_high, monday_label, MondayColor)
if is_monday_enabled
monday_limit_right = get_limit_right(DEFAULT_EXTEND_RIGHT)
if displayStyle == 'Right Anchored'
monday_time := get_limit_right(radistance)
monday_time
var monday_low_line = line.new(x1=monday_time, x2=monday_limit_right, y1=monday_low, y2=monday_low, color=MondayColor, width=DEFAULT_LINE_WIDTH, xloc=xloc.bar_time, style=linestyles)
var monday_low_label = label.new(x=monday_limit_right, y=monday_low, text=pmonltext, style=DEFAULT_LABEL_STYLE, textcolor=MondayColor, size=DEFAULT_LABEL_SIZE, xloc=xloc.bar_time)
line.set_x1(monday_low_line, monday_time)
line.set_x2(monday_low_line, monday_limit_right)
line.set_y1(monday_low_line, monday_low)
line.set_y2(monday_low_line, monday_low)
label.set_x(monday_low_label, monday_limit_right)
label.set_y(monday_low_label, monday_low)
label.set_text(monday_low_label, pmonltext)
if mergebool
f_LevelMerge(pricearray, labelarray, monday_low, monday_low_label, MondayColor)
if is_monday_mid
mondaym_limit_right = get_limit_right(DEFAULT_EXTEND_RIGHT)
mondaym_open = (monday_high + monday_low) / 2
if displayStyle == 'Right Anchored'
monday_time := get_limit_right(radistance)
monday_time
var mondaym_line = line.new(x1=monday_time, x2=mondaym_limit_right, y1=mondaym_open, y2=mondaym_open, color=MondayColor, width=DEFAULT_LINE_WIDTH, xloc=xloc.bar_time, style=linestyles)
var mondaym_label = label.new(x=mondaym_limit_right, y=mondaym_open, text=pmonmtext, style=DEFAULT_LABEL_STYLE, textcolor=MondayColor, size=DEFAULT_LABEL_SIZE, xloc=xloc.bar_time)
line.set_x1(mondaym_line, monday_time)
line.set_x2(mondaym_line, mondaym_limit_right)
line.set_y1(mondaym_line, mondaym_open)
line.set_y2(mondaym_line, mondaym_open)
label.set_x(mondaym_label, mondaym_limit_right)
label.set_y(mondaym_label, mondaym_open)
label.set_text(mondaym_label, pmonmtext)
if mergebool
f_LevelMerge(pricearray, labelarray, mondaym_open, mondaym_label, MondayColor)
//////////////////////////////////////////////////////////////////////////////////
////////////////////////DAILY OPEN DAILY OPEN DAILY OPEN DAILY OPEN DAILY OPEN DAILY OPEN DAILY OPEN
if is_daily_enabled
daily_limit_right = get_limit_right(DEFAULT_EXTEND_RIGHT)
if displayStyle == 'Right Anchored'
daily_time := get_limit_right(radistance)
daily_time
var daily_line = line.new(x1=daily_time, x2=daily_limit_right, y1=daily_open, y2=daily_open, color=DailyColor, width=DEFAULT_LINE_WIDTH, xloc=xloc.bar_time, style=linestyles)
var daily_label = label.new(x=daily_limit_right, y=daily_open, text=dotext, style=DEFAULT_LABEL_STYLE, textcolor=DailyColor, size=DEFAULT_LABEL_SIZE, xloc=xloc.bar_time)
line.set_x1(daily_line, daily_time)
line.set_x2(daily_line, daily_limit_right)
line.set_y1(daily_line, daily_open)
line.set_y2(daily_line, daily_open)
label.set_x(daily_label, daily_limit_right)
label.set_y(daily_label, daily_open)
label.set_text(daily_label, dotext)
if mergebool
f_LevelMerge(pricearray, labelarray, daily_open, daily_label, DailyColor)
//////////////////////////////////////////////////////////////////////////////////
//////////////////DAILY HIGH DAILY HIGH DAILY HIGH DAILY HIGH DAILY HIGH DAILY HIGH DAILY HIGH
if is_dailyrange_enabled
dailyh_limit_right = get_limit_right(DEFAULT_EXTEND_RIGHT)
if displayStyle == 'Right Anchored'
dailyh_time := get_limit_right(radistance)
dailyh_time
// draw tails before lines for better visual
var dailyh_line = line.new(x1=dailyh_time, x2=dailyh_limit_right, y1=dailyh_open, y2=dailyh_open, color=DailyColor, width=DEFAULT_LINE_WIDTH, xloc=xloc.bar_time, style=linestyles)
var dailyh_label = label.new(x=dailyh_limit_right, y=dailyh_open, text=pdhtext, style=DEFAULT_LABEL_STYLE, textcolor=DailyColor, size=DEFAULT_LABEL_SIZE, xloc=xloc.bar_time)
line.set_x1(dailyh_line, dailyh_time)
line.set_x2(dailyh_line, dailyh_limit_right)
line.set_y1(dailyh_line, dailyh_open)
line.set_y2(dailyh_line, dailyh_open)
label.set_x(dailyh_label, dailyh_limit_right)
label.set_y(dailyh_label, dailyh_open)
label.set_text(dailyh_label, pdhtext)
if mergebool
f_LevelMerge(pricearray, labelarray, dailyh_open, dailyh_label, DailyColor)
//////////////////////////////////////////////////////////////////////////////////
//////////////////DAILY LOW DAILY LOW DAILY LOW DAILY LOW DAILY LOW DAILY LOW DAILY LOW DAILY LOW
if is_dailyrange_enabled
dailyl_limit_right = get_limit_right(DEFAULT_EXTEND_RIGHT)
if displayStyle == 'Right Anchored'
dailyl_time := get_limit_right(radistance)
dailyl_time
var dailyl_line = line.new(x1=dailyl_time, x2=dailyl_limit_right, y1=dailyl_open, y2=dailyl_open, color=DailyColor, width=DEFAULT_LINE_WIDTH, xloc=xloc.bar_time, style=linestyles)
var dailyl_label = label.new(x=dailyl_limit_right, y=dailyl_open, text=pdltext, style=DEFAULT_LABEL_STYLE, textcolor=DailyColor, size=DEFAULT_LABEL_SIZE, xloc=xloc.bar_time)
line.set_x1(dailyl_line, dailyl_time)
line.set_x2(dailyl_line, dailyl_limit_right)
line.set_y1(dailyl_line, dailyl_open)
line.set_y2(dailyl_line, dailyl_open)
label.set_x(dailyl_label, dailyl_limit_right)
label.set_y(dailyl_label, dailyl_open)
label.set_text(dailyl_label, pdltext)
if mergebool
f_LevelMerge(pricearray, labelarray, dailyl_open, dailyl_label, DailyColor)
//////////////////////////////////////////////////////////////////////////////// Daily MID
if is_dailym_enabled
dailym_limit_right = get_limit_right(DEFAULT_EXTEND_RIGHT)
dailym_time = dailyh_time
dailym_open = (dailyl_open + dailyh_open) / 2
if displayStyle == 'Right Anchored'
dailym_time := get_limit_right(radistance)
dailym_time
var dailym_line = line.new(x1=dailym_time, x2=dailym_limit_right, y1=dailym_open, y2=dailym_open, color=DailyColor, width=DEFAULT_LINE_WIDTH, xloc=xloc.bar_time, style=linestyles)
var dailym_label = label.new(x=dailym_limit_right, y=dailym_open, text=pdmtext, style=DEFAULT_LABEL_STYLE, textcolor=DailyColor, size=DEFAULT_LABEL_SIZE, xloc=xloc.bar_time)
line.set_x1(dailym_line, dailym_time)
line.set_x2(dailym_line, dailym_limit_right)
line.set_y1(dailym_line, dailym_open)
line.set_y2(dailym_line, dailym_open)
label.set_x(dailym_label, dailym_limit_right)
label.set_y(dailym_label, dailym_open)
label.set_text(dailym_label, pdmtext)
if mergebool
f_LevelMerge(pricearray, labelarray, dailym_open, dailym_label, DailyColor)
//////////////////////////////////////////////////////////////////////////////////
if is_weekly_enabled
weekly_limit_right = get_limit_right(DEFAULT_EXTEND_RIGHT)
cweekly_time = weekly_time
if displayStyle == 'Right Anchored'
cweekly_time := get_limit_right(radistance)
cweekly_time
var weekly_line = line.new(x1=cweekly_time, x2=weekly_limit_right, y1=weekly_open, y2=weekly_open, color=WeeklyColor, width=DEFAULT_LINE_WIDTH, xloc=xloc.bar_time, style=linestyles)
var weekly_label = label.new(x=weekly_limit_right, y=weekly_open, text=wotext, style=DEFAULT_LABEL_STYLE, textcolor=WeeklyColor, size=DEFAULT_LABEL_SIZE, xloc=xloc.bar_time)
line.set_x1(weekly_line, cweekly_time)
line.set_x2(weekly_line, weekly_limit_right)
line.set_y1(weekly_line, weekly_open)
line.set_y2(weekly_line, weekly_open)
label.set_x(weekly_label, weekly_limit_right)
label.set_y(weekly_label, weekly_open)
label.set_text(weekly_label, wotext)
if mergebool
f_LevelMerge(pricearray, labelarray, weekly_open, weekly_label, WeeklyColor)
// the weekly open can be the daily open too (monday)
// only the weekly will be draw, in these case we update its label
// if is_weekly_open and can_show_daily
// label.set_text(weekly_label, "DO / WO ")
//////////////////////////////////////////////////////////////////////////////////
////////////////////////////////////////////////////////////////////////////////// WEEKLY HIGH WEEKLY HIGH WEEKLY HIGH
if is_weeklyrange_enabled
weeklyh_limit_right = get_limit_right(DEFAULT_EXTEND_RIGHT)
if displayStyle == 'Right Anchored'
weeklyh_time := get_limit_right(radistance)
weeklyh_time
var weeklyh_line = line.new(x1=weeklyh_time, x2=weeklyh_limit_right, y1=weeklyh_open, y2=weeklyh_open, color=WeeklyColor, width=DEFAULT_LINE_WIDTH, xloc=xloc.bar_time, style=linestyles)
var weeklyh_label = label.new(x=weeklyh_limit_right, y=weeklyh_open, text=pwhtext, style=DEFAULT_LABEL_STYLE, textcolor=WeeklyColor, size=DEFAULT_LABEL_SIZE, xloc=xloc.bar_time)
line.set_x1(weeklyh_line, weeklyh_time)
line.set_x2(weeklyh_line, weeklyh_limit_right)
line.set_y1(weeklyh_line, weeklyh_open)
line.set_y2(weeklyh_line, weeklyh_open)
label.set_x(weeklyh_label, weeklyh_limit_right)
label.set_y(weeklyh_label, weeklyh_open)
label.set_text(weeklyh_label, pwhtext)
if mergebool
f_LevelMerge(pricearray, labelarray, weeklyh_open, weeklyh_label, WeeklyColor)
//////////////////////////////////////////////////////////////////////////////////
////////////////////////////////////////////////////////////////////////////////// WEEKLY LOW WEEKLY LOW WEEKLY LOW
if is_weeklyrange_enabled
weeklyl_limit_right = get_limit_right(DEFAULT_EXTEND_RIGHT)
if displayStyle == 'Right Anchored'
weeklyl_time := get_limit_right(radistance)
weeklyl_time
var weeklyl_line = line.new(x1=weeklyl_time, x2=weeklyl_limit_right, y1=weekly_open, y2=weekly_open, color=WeeklyColor, width=DEFAULT_LINE_WIDTH, xloc=xloc.bar_time, style=linestyles)
var weeklyl_label = label.new(x=weeklyl_limit_right, y=weeklyl_open, text=pwltext, style=DEFAULT_LABEL_STYLE, textcolor=WeeklyColor, size=DEFAULT_LABEL_SIZE, xloc=xloc.bar_time)
line.set_x1(weeklyl_line, weeklyl_time)
line.set_x2(weeklyl_line, weeklyl_limit_right)
line.set_y1(weeklyl_line, weeklyl_open)
line.set_y2(weeklyl_line, weeklyl_open)
label.set_x(weeklyl_label, weeklyl_limit_right)
label.set_y(weeklyl_label, weeklyl_open)
label.set_text(weeklyl_label, pwltext)
if mergebool
f_LevelMerge(pricearray, labelarray, weeklyl_open, weeklyl_label, WeeklyColor)
//////////////////////////////////////////////////////////////////////////////////
//////////////////////////////////////////////////////////////////////////////// Weekly MID
if is_weekly_mid
weeklym_limit_right = get_limit_right(DEFAULT_EXTEND_RIGHT)
weeklym_time = weeklyh_time
weeklym_open = (weeklyl_open + weeklyh_open) / 2
if displayStyle == 'Right Anchored'
weeklym_time := get_limit_right(radistance)
weeklym_time
var weeklym_line = line.new(x1=weeklym_time, x2=weeklym_limit_right, y1=weeklym_open, y2=weeklym_open, color=WeeklyColor, width=DEFAULT_LINE_WIDTH, xloc=xloc.bar_time, style=linestyles)
var weeklym_label = label.new(x=weeklym_limit_right, y=weeklym_open, text=pwmtext, style=DEFAULT_LABEL_STYLE, textcolor=WeeklyColor, size=DEFAULT_LABEL_SIZE, xloc=xloc.bar_time)
line.set_x1(weeklym_line, weeklym_time)
line.set_x2(weeklym_line, weeklym_limit_right)
line.set_y1(weeklym_line, weeklym_open)
line.set_y2(weeklym_line, weeklym_open)
label.set_x(weeklym_label, weeklym_limit_right)
label.set_y(weeklym_label, weeklym_open)
label.set_text(weeklym_label, pwmtext)
if mergebool
f_LevelMerge(pricearray, labelarray, weeklym_open, weeklym_label, WeeklyColor)
////////////////////////////////////////////////////////////////////////////////// YEEEAARRLLYY LOW LOW LOW
if is_yearlyrange_enabled
yearlyl_limit_right = get_limit_right(DEFAULT_EXTEND_RIGHT)
if displayStyle == 'Right Anchored'
yearlyl_time := get_limit_right(radistance)
yearlyl_time
var yearlyl_line = line.new(x1=yearlyl_time, x2=yearlyl_limit_right, y1=yearlyl_open, y2=yearlyl_open, color=YearlyColor, width=DEFAULT_LINE_WIDTH, xloc=xloc.bar_time, style=linestyles)
var yearlyl_label = label.new(x=yearlyl_limit_right, y=yearlyl_open, text=cyltext, style=DEFAULT_LABEL_STYLE, textcolor=YearlyColor, size=DEFAULT_LABEL_SIZE, xloc=xloc.bar_time)
line.set_x1(yearlyl_line, yearlyl_time)
line.set_x2(yearlyl_line, yearlyl_limit_right)
line.set_y1(yearlyl_line, yearlyl_open)
line.set_y2(yearlyl_line, yearlyl_open)
label.set_x(yearlyl_label, yearlyl_limit_right)
label.set_y(yearlyl_label, yearlyl_open)
label.set_text(yearlyl_label, cyltext)
if mergebool
f_LevelMerge(pricearray, labelarray, yearlyl_open, yearlyl_label, YearlyColor)
//////////////////////////////////////////////////////////////////////////////////
////////////////////////////////////////////////////////////////////////////////// YEEEAARRLLYY HIGH HIGH HIGH
if is_yearlyrange_enabled
yearlyh_limit_right = get_limit_right(DEFAULT_EXTEND_RIGHT)
if displayStyle == 'Right Anchored'
yearlyh_time := get_limit_right(radistance)
yearlyh_time
var yearlyh_line = line.new(x1=yearlyh_time, x2=yearlyh_limit_right, y1=yearlyh_open, y2=yearlyh_open, color=YearlyColor, width=DEFAULT_LINE_WIDTH, xloc=xloc.bar_time, style=linestyles)
var yearlyh_label = label.new(x=yearlyh_limit_right, y=yearlyh_open, text=cyhtext, style=DEFAULT_LABEL_STYLE, textcolor=YearlyColor, size=DEFAULT_LABEL_SIZE, xloc=xloc.bar_time)
line.set_x1(yearlyh_line, yearlyh_time)
line.set_x2(yearlyh_line, yearlyh_limit_right)
line.set_y1(yearlyh_line, yearlyh_open)
line.set_y2(yearlyh_line, yearlyh_open)
label.set_x(yearlyh_label, yearlyh_limit_right)
label.set_y(yearlyh_label, yearlyh_open)
label.set_text(yearlyh_label, cyhtext)
if mergebool
f_LevelMerge(pricearray, labelarray, yearlyh_open, yearlyh_label, YearlyColor)
//////////////////////////////////////////////////////////////////////////////////
////////////////////////////////////////////////////////////////////////////////// YEEEAARRLLYY OPEN
if is_yearly_enabled
yearly_limit_right = get_limit_right(DEFAULT_EXTEND_RIGHT)
if displayStyle == 'Right Anchored'
yearly_time := get_limit_right(radistance)
yearly_time
var yearly_line = line.new(x1=yearly_time, x2=yearly_limit_right, y1=yearly_open, y2=yearly_open, color=YearlyColor, width=DEFAULT_LINE_WIDTH, xloc=xloc.bar_time, style=linestyles)
var yearly_label = label.new(x=yearly_limit_right, y=yearly_open, text=yotext, style=DEFAULT_LABEL_STYLE, textcolor=YearlyColor, size=DEFAULT_LABEL_SIZE, xloc=xloc.bar_time)
line.set_x1(yearly_line, yearly_time)
line.set_x2(yearly_line, yearly_limit_right)
line.set_y1(yearly_line, yearly_open)
line.set_y2(yearly_line, yearly_open)
label.set_x(yearly_label, yearly_limit_right)
label.set_y(yearly_label, yearly_open)
label.set_text(yearly_label, yotext)
if mergebool
f_LevelMerge(pricearray, labelarray, yearly_open, yearly_label, YearlyColor)
//////////////////////////////////////////////////////////////////////////////////
//////////////////////////////////////////////////////////////////////////////// yearly MID
if is_yearly_mid
yearlym_limit_right = get_limit_right(DEFAULT_EXTEND_RIGHT)
yearlym_time = yearlyh_time
yearlym_open = (yearlyl_open + yearlyh_open) / 2
if displayStyle == 'Right Anchored'
yearlym_time := get_limit_right(radistance)
yearlym_time
var yearlym_line = line.new(x1=yearlym_time, x2=yearlym_limit_right, y1=yearlym_open, y2=yearlym_open, color=YearlyColor, width=DEFAULT_LINE_WIDTH, xloc=xloc.bar_time, style=linestyles)
var yearlym_label = label.new(x=yearlym_limit_right, y=yearlym_open, text=cymtext, style=DEFAULT_LABEL_STYLE, textcolor=YearlyColor, size=DEFAULT_LABEL_SIZE, xloc=xloc.bar_time)
line.set_x1(yearlym_line, yearlym_time)
line.set_x2(yearlym_line, yearlym_limit_right)
line.set_y1(yearlym_line, yearlym_open)
line.set_y2(yearlym_line, yearlym_open)
label.set_x(yearlym_label, yearlym_limit_right)
label.set_y(yearlym_label, yearlym_open)
label.set_text(yearlym_label, cymtext)
if mergebool
f_LevelMerge(pricearray, labelarray, yearlym_open, yearlym_label, YearlyColor)
////////////////////////////////////////////////////////////////////////////////// QUATERLLYYYYY OPEN
if is_quarterly_enabled
quarterly_limit_right = get_limit_right(DEFAULT_EXTEND_RIGHT)
if displayStyle == 'Right Anchored'
quarterly_time := get_limit_right(radistance)
quarterly_time
var quarterly_line = line.new(x1=quarterly_time, x2=quarterly_limit_right, y1=quarterly_open, y2=quarterly_open, color=quarterlyColor, width=DEFAULT_LINE_WIDTH, xloc=xloc.bar_time, style=linestyles)
var quarterly_label = label.new(x=quarterly_limit_right, y=quarterly_open, text=qotext, style=DEFAULT_LABEL_STYLE, textcolor=quarterlyColor, size=DEFAULT_LABEL_SIZE, xloc=xloc.bar_time)
line.set_x1(quarterly_line, quarterly_time)
line.set_x2(quarterly_line, quarterly_limit_right)
line.set_y1(quarterly_line, quarterly_open)
line.set_y2(quarterly_line, quarterly_open)
label.set_x(quarterly_label, quarterly_limit_right)
label.set_y(quarterly_label, quarterly_open)
label.set_text(quarterly_label, qotext)
if mergebool
f_LevelMerge(pricearray, labelarray, quarterly_open, quarterly_label, quarterlyColor)
//////////////////////////////////////////////////////////////////////////////////
////////////////////////////////////////////////////////////////////////////////// QUATERLLYYYYY High
if is_quarterlyrange_enabled
quarterlyh_limit_right = get_limit_right(DEFAULT_EXTEND_RIGHT)
if displayStyle == 'Right Anchored'
quarterlyh_time := get_limit_right(radistance)
quarterlyh_time
var quarterlyh_line = line.new(x1=quarterlyh_time, x2=quarterlyh_limit_right, y1=quarterlyh_open, y2=quarterlyh_open, color=quarterlyColor, width=DEFAULT_LINE_WIDTH, xloc=xloc.bar_time, style=linestyles)
var quarterlyh_label = label.new(x=quarterlyh_limit_right, y=quarterlyh_open, text=pqhtext, style=DEFAULT_LABEL_STYLE, textcolor=quarterlyColor, size=DEFAULT_LABEL_SIZE, xloc=xloc.bar_time)
line.set_x1(quarterlyh_line, quarterlyh_time)
line.set_x2(quarterlyh_line, quarterlyh_limit_right)
line.set_y1(quarterlyh_line, quarterlyh_open)
line.set_y2(quarterlyh_line, quarterlyh_open)
label.set_x(quarterlyh_label, quarterlyh_limit_right)
label.set_y(quarterlyh_label, quarterlyh_open)
label.set_text(quarterlyh_label, pqhtext)
if mergebool
f_LevelMerge(pricearray, labelarray, quarterlyh_open, quarterlyh_label, quarterlyColor)
//////////////////////////////////////////////////////////////////////////////////
////////////////////////////////////////////////////////////////////////////////// QUATERLLYYYYY Low
if is_quarterlyrange_enabled
quarterlyl_limit_right = get_limit_right(DEFAULT_EXTEND_RIGHT)
if displayStyle == 'Right Anchored'
quarterlyl_time := get_limit_right(radistance)
quarterlyl_time
var quarterlyl_line = line.new(x1=quarterlyl_time, x2=quarterlyl_limit_right, y1=quarterlyl_open, y2=quarterlyl_open, color=quarterlyColor, width=DEFAULT_LINE_WIDTH, xloc=xloc.bar_time, style=linestyles)
var quarterlyl_label = label.new(x=quarterlyl_limit_right, y=quarterlyl_open, text=pqltext, style=DEFAULT_LABEL_STYLE, textcolor=quarterlyColor, size=DEFAULT_LABEL_SIZE, xloc=xloc.bar_time)
line.set_x1(quarterlyl_line, quarterlyl_time)
line.set_x2(quarterlyl_line, quarterlyl_limit_right)
line.set_y1(quarterlyl_line, quarterlyl_open)
line.set_y2(quarterlyl_line, quarterlyl_open)
label.set_x(quarterlyl_label, quarterlyl_limit_right)
label.set_y(quarterlyl_label, quarterlyl_open)
label.set_text(quarterlyl_label, pqltext)
if mergebool
f_LevelMerge(pricearray, labelarray, quarterlyl_open, quarterlyl_label, quarterlyColor)
//////////////////////////////////////////////////////////////////////////////////
//////////////////////////////////////////////////////////////////////////////// QUATERLLYYYYY MID
if is_quarterly_mid
quarterlym_limit_right = get_limit_right(DEFAULT_EXTEND_RIGHT)
quarterlym_time = quarterlyh_time
quarterlym_open = (quarterlyl_open + quarterlyh_open) / 2
if displayStyle == 'Right Anchored'
quarterlym_time := get_limit_right(radistance)
quarterlym_time
var quarterlym_line = line.new(x1=quarterlym_time, x2=quarterlym_limit_right, y1=quarterlym_open, y2=quarterlym_open, color=quarterlyColor, width=DEFAULT_LINE_WIDTH, xloc=xloc.bar_time, style=linestyles)
var quarterlym_label = label.new(x=quarterlym_limit_right, y=quarterlym_open, text=pqmtext, style=DEFAULT_LABEL_STYLE, textcolor=quarterlyColor, size=DEFAULT_LABEL_SIZE, xloc=xloc.bar_time)
line.set_x1(quarterlym_line, quarterlym_time)
line.set_x2(quarterlym_line, quarterlym_limit_right)
line.set_y1(quarterlym_line, quarterlym_open)
line.set_y2(quarterlym_line, quarterlym_open)
label.set_x(quarterlym_label, quarterlym_limit_right)
label.set_y(quarterlym_label, quarterlym_open)
label.set_text(quarterlym_label, pqmtext)
if mergebool
f_LevelMerge(pricearray, labelarray, quarterlym_open, quarterlym_label, quarterlyColor)
////////////////////////////////////////////////////////////////////////////////// Monthly LOW LOW LOW
if is_monthlyrange_enabled
monthlyl_limit_right = get_limit_right(DEFAULT_EXTEND_RIGHT)
if displayStyle == 'Right Anchored'
monthlyl_time := get_limit_right(radistance)
monthlyl_time
var monthlyl_line = line.new(x1=monthlyl_time, x2=monthlyl_limit_right, y1=monthlyl_open, y2=monthlyl_open, color=MonthlyColor, width=DEFAULT_LINE_WIDTH, xloc=xloc.bar_time, style=linestyles)
var monthlyl_label = label.new(x=monthlyl_limit_right, y=monthlyl_open, text=pmltext, style=DEFAULT_LABEL_STYLE, textcolor=MonthlyColor, size=DEFAULT_LABEL_SIZE, xloc=xloc.bar_time)
line.set_x1(monthlyl_line, monthlyl_time)
line.set_x2(monthlyl_line, monthlyl_limit_right)
line.set_y1(monthlyl_line, monthlyl_open)
line.set_y2(monthlyl_line, monthlyl_open)
label.set_x(monthlyl_label, monthlyl_limit_right)
label.set_y(monthlyl_label, monthlyl_open)
label.set_text(monthlyl_label, pmltext)
if mergebool
f_LevelMerge(pricearray, labelarray, monthlyl_open, monthlyl_label, MonthlyColor)
// the weekly open can be the daily open too (monday)
// only the weekly will be draw, in these case we update its label
//////////////////////////////////////////////////////////////////////////////////
////////////////////////////////////////////////////////////////////////////////// MONTHLY HIGH HIGH HIGH
if is_monthlyrange_enabled
monthlyh_limit_right = get_limit_right(DEFAULT_EXTEND_RIGHT)
if displayStyle == 'Right Anchored'
monthlyh_time := get_limit_right(radistance)
monthlyh_time
var monthlyh_line = line.new(x1=monthlyh_time, x2=monthlyh_limit_right, y1=monthlyh_open, y2=monthlyh_open, color=MonthlyColor, width=DEFAULT_LINE_WIDTH, xloc=xloc.bar_time, style=linestyles)
var monthlyh_label = label.new(x=monthlyh_limit_right, y=monthlyh_open, text=pmhtext, style=DEFAULT_LABEL_STYLE, textcolor=MonthlyColor, size=DEFAULT_LABEL_SIZE, xloc=xloc.bar_time)
line.set_x1(monthlyh_line, monthlyl_time)
line.set_x2(monthlyh_line, monthlyh_limit_right)
line.set_y1(monthlyh_line, monthlyh_open)
line.set_y2(monthlyh_line, monthlyh_open)
label.set_x(monthlyh_label, monthlyh_limit_right)
label.set_y(monthlyh_label, monthlyh_open)
label.set_text(monthlyh_label, pmhtext)
if mergebool
f_LevelMerge(pricearray, labelarray, monthlyh_open, monthlyh_label, MonthlyColor)
// the weekly open can be the daily open too (monday)
// only the weekly will be draw, in these case we update its label
//////////////////////////////////////////////////////////////////////////////// MONTHLY MID
if is_monthly_mid
monthlym_limit_right = get_limit_right(DEFAULT_EXTEND_RIGHT)
monthlym_time = monthlyh_time
monthlym_open = (monthlyl_open + monthlyh_open) / 2
if displayStyle == 'Right Anchored'
monthlym_time := get_limit_right(radistance)
monthlym_time
var monthlym_line = line.new(x1=monthlym_time, x2=monthlym_limit_right, y1=monthlym_open, y2=monthlym_open, color=MonthlyColor, width=DEFAULT_LINE_WIDTH, xloc=xloc.bar_time, style=linestyles)
var monthlym_label = label.new(x=monthlym_limit_right, y=monthlym_open, text=pmmtext, style=DEFAULT_LABEL_STYLE, textcolor=MonthlyColor, size=DEFAULT_LABEL_SIZE, xloc=xloc.bar_time)
line.set_x1(monthlym_line, monthlym_time)
line.set_x2(monthlym_line, monthlym_limit_right)
line.set_y1(monthlym_line, monthlym_open)
line.set_y2(monthlym_line, monthlym_open)
label.set_x(monthlym_label, monthlym_limit_right)
label.set_y(monthlym_label, monthlym_open)
label.set_text(monthlym_label, pmmtext)
if mergebool
f_LevelMerge(pricearray, labelarray, monthlym_open, monthlym_label, MonthlyColor)
//////////////////////////////////////////////////////////////////////////////////
if is_monthly_enabled
monthly_limit_right = get_limit_right(DEFAULT_EXTEND_RIGHT)
if displayStyle == 'Right Anchored'
monthly_time := get_limit_right(radistance)
monthly_time
var monthlyLine = line.new(x1=monthly_time, x2=monthly_limit_right, y1=monthly_open, y2=monthly_open, color=MonthlyColor, width=DEFAULT_LINE_WIDTH, xloc=xloc.bar_time, style=linestyles)
var monthlyLabel = label.new(x=monthly_limit_right, y=monthly_open, text=motext, style=DEFAULT_LABEL_STYLE, textcolor=MonthlyColor, size=DEFAULT_LABEL_SIZE, xloc=xloc.bar_time)
line.set_x1(monthlyLine, monthly_time)
line.set_x2(monthlyLine, monthly_limit_right)
line.set_y1(monthlyLine, monthly_open)
line.set_y2(monthlyLine, monthly_open)
label.set_x(monthlyLabel, monthly_limit_right)
label.set_y(monthlyLabel, monthly_open)
label.set_text(monthlyLabel, motext)
if mergebool
f_LevelMerge(pricearray, labelarray, monthly_open, monthlyLabel, MonthlyColor)
/////////////////////////////////////////////////////////////////////////////
// the monthly open can be the weekly open (monday 1st) and/or daily open too
// only the monthly will be draw, in these case we update its label
// if is_monthly_open
// if can_show_daily
// label.set_text(monthlyLabel, "DO / MO ")
// if is_weekly_open
// if can_show_weekly
// label.set_text(monthlyLabel, "WO / MO ")
// if can_show_daily and can_show_weekly
// label.set_text(monthlyLabel, "DO / WO / MO ")
// the start of the line is drew from the first week of the month
// if the first day of the weekly candle (monday) is the 2nd of the month
// we fix the start of the line position on the Prev weekly candle
if timeframe.isweekly and dayofweek(monthly_time) != dayofweek.monday
line.set_x1(monthlyLine, monthly_time - (weekly_time - weekly_time ))

Key Levels//@version=5
//@sbtnc thank you for doing the base code
//Added additional levels for convienience sake.
indicator('Key Levels SpacemanBTC IDWM', shorttitle='SpacemanBTC Key Level V13.1', overlay=true, max_lines_count=100)
//35 works
displayStyle = input.string(defval='Standard', title='Display Style', options= , inline='Display')
mergebool = input.bool(defval=true, title='Merge Levels?', inline='Display')
distanceright = input.int(defval=30, title='Distance', minval=5, maxval=500, inline='Dist')
radistance = input.int(defval=250, title='Anchor Distance', minval=5, maxval=500, inline='Dist')
labelsize = input.string(defval='Medium', title='Text Size', options= )
linesize = input.string(defval='Small', title='Line Width', options= , inline='Line')
linestyle = input.string(defval='Solid', title='Line Style', options= , inline='Line')
GlobalTextType = input.bool(defval=false, title='Global Text ShortHand', tooltip='Enable for shorthand text on all text')
var globalcoloring = input.bool(defval=false, title='Global Coloring', tooltip='Enable for all color controls via one color', inline='GC')
GlobalColor = input.color(title='', defval=color.white, inline='GC')
//var show_tails = input(defval = false, title = "Always Show", type = input.bool)
= request.security(syminfo.tickerid, 'D', , lookahead=barmerge.lookahead_on)
= request.security(syminfo.tickerid, 'D', [time , high ], lookahead=barmerge.lookahead_on)
= request.security(syminfo.tickerid, 'D', [time , low ], lookahead=barmerge.lookahead_on)
cdailyh_open = request.security(syminfo.tickerid, 'D', high, lookahead=barmerge.lookahead_on)
cdailyl_open = request.security(syminfo.tickerid, 'D', low, lookahead=barmerge.lookahead_on)
var monday_time = time
var monday_high = high
var monday_low = low
= request.security(syminfo.tickerid, 'W', , lookahead=barmerge.lookahead_on)
= request.security(syminfo.tickerid, 'W', [time , high ], lookahead=barmerge.lookahead_on)
= request.security(syminfo.tickerid, 'W', [time , low ], lookahead=barmerge.lookahead_on)
= request.security(syminfo.tickerid, 'M', , lookahead=barmerge.lookahead_on)
= request.security(syminfo.tickerid, 'M', [time , high ], lookahead=barmerge.lookahead_on)
= request.security(syminfo.tickerid, 'M', [time , low ], lookahead=barmerge.lookahead_on)
= request.security(syminfo.tickerid, '3M', , lookahead=barmerge.lookahead_on)
= request.security(syminfo.tickerid, '3M', [time , high ], lookahead=barmerge.lookahead_on)
= request.security(syminfo.tickerid, '3M', [time , low ], lookahead=barmerge.lookahead_on)
= request.security(syminfo.tickerid, '12M', , lookahead=barmerge.lookahead_on)
= request.security(syminfo.tickerid, '12M', , lookahead=barmerge.lookahead_on)
= request.security(syminfo.tickerid, '12M', , lookahead=barmerge.lookahead_on)
= request.security(syminfo.tickerid, '240', , lookahead=barmerge.lookahead_on)
= request.security(syminfo.tickerid, '240', [time , high ], lookahead=barmerge.lookahead_on)
= request.security(syminfo.tickerid, '240', [time , low ], lookahead=barmerge.lookahead_on)
//------------------------------ Inputs -------------------------------
var is_intra_enabled = input.bool(defval=false, title='Open', group='4H', inline='4H')
var is_intrarange_enabled = input.bool(defval=false, title='Prev H/L', group='4H', inline='4H')
var is_intram_enabled = input.bool(defval=false, title='Prev Mid', group='4H', inline='4H')
IntraTextType = input.bool(defval=false, title='ShortHand', group='4H', inline='4Hsh')
var is_daily_enabled = input.bool(defval=true, title='Open', group='Daily', inline='Daily')
var is_dailyrange_enabled = input.bool(defval=false, title='Prev H/L', group='Daily', inline='Daily')
var is_dailym_enabled = input.bool(defval=false, title='Prev Mid', group='Daily', inline='Daily')
DailyTextType = input.bool(defval=false, title='ShortHand', group='Daily', inline='Dailysh')
var is_monday_enabled = input.bool(defval=true, title='Range', group='Monday Range', inline='Monday')
var is_monday_mid = input.bool(defval=true, title='Mid', group='Monday Range', inline='Monday')
var untested_monday = false
MondayTextType = input.bool(defval=false, title='ShortHand', group='Monday Range', inline='Mondaysh')
var is_weekly_enabled = input.bool(defval=true, title='Open', group='Weekly', inline='Weekly')
var is_weeklyrange_enabled = input.bool(defval=true, title='Prev H/L', group='Weekly', inline='Weekly')
var is_weekly_mid = input.bool(defval=true, title='Prev Mid', group='Weekly', inline='Weekly')
WeeklyTextType = input.bool(defval=false, title='ShortHand', group='Weekly', inline='Weeklysh')
var is_monthly_enabled = input.bool(defval=true, title='Open', group='Monthly', inline='Monthly')
var is_monthlyrange_enabled = input.bool(defval=true, title='Prev H/L', group='Monthly', inline='Monthly')
var is_monthly_mid = input.bool(defval=true, title='Prev Mid', group='Monthly', inline='Monthly')
MonthlyTextType = input.bool(defval=false, title='ShortHand', group='Monthly', inline='Monthlysh')
var is_quarterly_enabled = input.bool(defval=true, title='Open', group='Quarterly', inline='Quarterly')
var is_quarterlyrange_enabled = input.bool(defval=false, title='Prev H/L', group='Quarterly', inline='Quarterly')
var is_quarterly_mid = input.bool(defval=true, title='Prev Mid', group='Quarterly', inline='Quarterly')
QuarterlyTextType = input.bool(defval=false, title='ShortHand', group='Quarterly', inline='Quarterlysh')
var is_yearly_enabled = input.bool(defval=true, title='Open', group='Yearly', inline='Yearly')
var is_yearlyrange_enabled = input.bool(defval=false, title='Current H/L', group='Yearly', inline='Yearly')
var is_yearly_mid = input.bool(defval=true, title='Mid', group='Yearly', inline='Yearly')
YearlyTextType = input.bool(defval=false, title='ShortHand', group='Yearly', inline='Yearlysh')
var is_londonrange_enabled = input.bool(defval=false, title='London Range', group='FX Sessions', inline='FX')
var is_usrange_enabled = input.bool(defval=false, title='New York Range', group='FX Sessions', inline='FX')
var is_asiarange_enabled = input.bool(defval=false, title='Asia Range', group='FX Sessions', inline='FX')
SessionTextType = input.bool(defval=false, title='ShortHand', group='FX Sessions', inline='FXColor')
Londont = input.session("0800-1600", "London Session")
USt = input.session("1400-2100", "New York Session")
Asiat = input.session("0000-0900", "Tokyo Session")
DailyColor = input.color(title='', defval=#08bcd4, group='Daily', inline='Dailysh')
MondayColor = input.color(title='', defval=color.white, group='Monday Range', inline='Mondaysh')
WeeklyColor = input.color(title='', defval=#fffcbc, group='Weekly', inline='Weeklysh')
MonthlyColor = input.color(title='', defval=#08d48c, group='Monthly', inline='Monthlysh')
YearlyColor = input.color(title='', defval=color.red, group='Yearly', inline='Yearlysh')
quarterlyColor = input.color(title='', defval=color.red, group='Quarterly', inline='Quarterlysh')
IntraColor = input.color(title='', defval=color.orange, group='4H', inline='4Hsh')
LondonColor = input.color(title='', defval=color.white, group='FX Sessions', inline='FXColor')
USColor = input.color(title='', defval=color.white, group='FX Sessions', inline='FXColor')
AsiaColor = input.color(title='', defval=color.white, group='FX Sessions', inline='FXColor')
var pdhtext = GlobalTextType or DailyTextType ? 'PDH' : 'Prev Day High'
var pdltext = GlobalTextType or DailyTextType ? 'PDL' : 'Prev Day Low'
var dotext = GlobalTextType or DailyTextType ? 'DO' : 'Daily Open'
var pdmtext = GlobalTextType or DailyTextType ? 'PDM' : 'Prev Day Mid'
var pwhtext = GlobalTextType or WeeklyTextType ? 'PWH' : 'Prev Week High'
var pwltext = GlobalTextType or WeeklyTextType ? 'PWL' : 'Prev Week Low'
var wotext = GlobalTextType or WeeklyTextType ? 'WO' : 'Weekly Open'
var pwmtext = GlobalTextType or WeeklyTextType ? 'PWM' : 'Prev Week Mid'
var pmhtext = GlobalTextType or MonthlyTextType ? 'PMH' : 'Prev Month High'
var pmltext = GlobalTextType or MonthlyTextType ? 'PML' : 'Prev Month Low'
var motext = GlobalTextType or MonthlyTextType ? 'MO' : 'Monthly Open'
var pmmtext = GlobalTextType or MonthlyTextType ? 'PMM' : 'Prev Month Mid'
var pqhtext = GlobalTextType or QuarterlyTextType ? 'PQH' : 'Prev Quarter High'
var pqltext = GlobalTextType or QuarterlyTextType ? 'PQL' : 'Prev Quarter Low'
var qotext = GlobalTextType or QuarterlyTextType ? 'QO' : 'Quarterly Open'
var pqmtext = GlobalTextType or QuarterlyTextType ? 'PQM' : 'Prev Quarter Mid'
var cyhtext = GlobalTextType or YearlyTextType ? 'CYH' : 'Current Year High'
var cyltext = GlobalTextType or YearlyTextType ? 'CYL' : 'Current Year Low'
var yotext = GlobalTextType or YearlyTextType ? 'YO' : 'Yearly Open'
var cymtext = GlobalTextType or YearlyTextType ? 'CYM' : 'Current Year Mid'
var pihtext = GlobalTextType or IntraTextType ? 'P-4H-H' : 'Prev 4H High'
var piltext = GlobalTextType or IntraTextType ? 'P-4H-L' : 'Prev 4H Low'
var iotext = GlobalTextType or IntraTextType ? '4H-O' : '4H Open'
var pimtext = GlobalTextType or IntraTextType ? 'P-4H-M' : 'Prev 4H Mid'
var pmonhtext = GlobalTextType or MondayTextType ? 'MDAY-H' : 'Monday High'
var pmonltext = GlobalTextType or MondayTextType ? 'MDAY-L' : 'Monday Low'
var pmonmtext = GlobalTextType or MondayTextType ? 'MDAY-M' : 'Monday Mid'
var lhtext = GlobalTextType or SessionTextType ? 'Lon-H' : 'London High'
var lltext = GlobalTextType or SessionTextType ? 'Lon-L' : 'London Low'
var lotext = GlobalTextType or SessionTextType ? 'Lon-O' : 'London Open'
var ushtext = GlobalTextType or SessionTextType ? 'NY-H' : 'New York High'
var usltext = GlobalTextType or SessionTextType ? 'NY-L' : 'New York Low'
var usotext = GlobalTextType or SessionTextType ? 'NY-O' : 'New York Open'
var asiahtext = GlobalTextType or SessionTextType ? 'AS-H' : 'Asia High'
var asialtext = GlobalTextType or SessionTextType ? 'AS-L' : 'Asia Low'
var asiaotext = GlobalTextType or SessionTextType ? 'AS-O' : 'Asia Open'
if globalcoloring == true
DailyColor := GlobalColor
MondayColor := GlobalColor
WeeklyColor := GlobalColor
MonthlyColor := GlobalColor
YearlyColor := GlobalColor
quarterlyColor := GlobalColor
IntraColor := GlobalColor
IntraColor
if weekly_time != weekly_time
untested_monday := false
untested_monday
if is_monday_enabled == true and untested_monday == false
untested_monday := true
monday_time := daily_time
monday_high := cdailyh_open
monday_low := cdailyl_open
monday_low
linewidthint = 1
if linesize == 'Small'
linewidthint := 1
linewidthint
if linesize == 'Medium'
linewidthint := 2
linewidthint
if linesize == 'Large'
linewidthint := 3
linewidthint
var DEFAULT_LINE_WIDTH = linewidthint
var DEFAULT_TAIL_WIDTH = linewidthint
fontsize = size.small
if labelsize == 'Small'
fontsize := size.small
fontsize
if labelsize == 'Medium'
fontsize := size.normal
fontsize
if labelsize == 'Large'
fontsize := size.large
fontsize
linestyles = line.style_solid
if linestyle == 'Dashed'
linestyles := line.style_dashed
linestyles
if linestyle == 'Dotted'
linestyles := line.style_dotted
linestyles
var DEFAULT_LABEL_SIZE = fontsize
var DEFAULT_LABEL_STYLE = label.style_none
var DEFAULT_EXTEND_RIGHT = distanceright
London = time(timeframe.period, Londont)
US = time(timeframe.period, USt)
Asia = time(timeframe.period, Asiat)
var clondonhigh = 0.0
var clondonlow = close
var londontime = time
var flondonhigh = 0.0
var flondonlow = 0.0
var flondonopen = 0.0
var onelondonfalse = false
if London
if high > clondonhigh
clondonhigh := high
clondonhigh
if low < clondonlow
clondonlow := low
clondonlow
if onelondonfalse
londontime := time
flondonopen := open
flondonopen
flondonhigh := clondonhigh
flondonlow := clondonlow
onelondonfalse := false
onelondonfalse
else
if onelondonfalse == false
flondonhigh := clondonhigh
flondonlow := clondonlow
flondonlow
onelondonfalse := true
clondonhigh := 0.0
clondonlow := close
clondonlow
//////////////////////////////////
var cushigh = 0.0
var cuslow = close
var ustime = time
var fushigh = 0.0
var fuslow = 0.0
var fusopen = 0.0
var oneusfalse = false
if US
if high > cushigh
cushigh := high
cushigh
if low < cuslow
cuslow := low
cuslow
if oneusfalse
ustime := time
fusopen := open
fusopen
fushigh := cushigh
fuslow := cuslow
oneusfalse := false
oneusfalse
else
if oneusfalse == false
fushigh := cushigh
fuslow := cuslow
fuslow
oneusfalse := true
cushigh := 0.0
cuslow := close
cuslow
//////////////////////////////////
var casiahigh = 0.0
var casialow = close
var asiatime = time
var fasiahigh = 0.0
var fasialow = 0.0
var fasiaopen = 0.0
var oneasiafalse = false
if Asia
if high > casiahigh
casiahigh := high
casiahigh
if low < casialow
casialow := low
casialow
if oneasiafalse
asiatime := time
fasiaopen := open
fasiaopen
fasiahigh := casiahigh
fasialow := casialow
oneasiafalse := false
oneasiafalse
else
if oneasiafalse == false
fasiahigh := casiahigh
fasialow := casialow
fasialow
oneasiafalse := true
casiahigh := 0.0
casialow := close
casialow
//------------------------------ Plotting ------------------------------
var pricearray = array.new_float(0)
var labelarray = array.new_label(0)
f_LevelMerge(pricearray, labelarray, currentprice, currentlabel, currentcolor) =>
if array.includes(pricearray, currentprice)
whichindex = array.indexof(pricearray, currentprice)
labelhold = array.get(labelarray, whichindex)
whichtext = label.get_text(labelhold)
label.set_text(labelhold, label.get_text(currentlabel) + ' / ' + whichtext)
label.set_text(currentlabel, '')
label.set_textcolor(labelhold, currentcolor)
else
array.push(pricearray, currentprice)
array.push(labelarray, currentlabel)
var can_show_daily = is_daily_enabled and timeframe.isintraday
var can_show_weekly = is_weekly_enabled and not timeframe.isweekly and not timeframe.ismonthly
var can_show_monthly = is_monthly_enabled and not timeframe.ismonthly
get_limit_right(bars) =>
timenow + (time - time ) * bars
// the following code doesn't need to be processed on every candle
if barstate.islast
is_weekly_open = dayofweek == dayofweek.monday
is_monthly_open = dayofmonth == 1
can_draw_daily = (is_weekly_enabled ? not is_weekly_open : true) and (is_monthly_enabled ? not is_monthly_open : true)
can_draw_weekly = is_monthly_enabled ? not(is_monthly_open and is_weekly_open) : true
can_draw_intra = is_intra_enabled
can_draw_intrah = is_intrarange_enabled
can_draw_intral = is_intrarange_enabled
can_draw_intram = is_intram_enabled
pricearray := array.new_float(0)
labelarray := array.new_label(0)
/////////////////////////////////
if is_londonrange_enabled
//label.new(bar_index,high)
london_limit_right = get_limit_right(DEFAULT_EXTEND_RIGHT)
if displayStyle == 'Right Anchored'
londontime := get_limit_right(radistance)
londontime
var londonh_line = line.new(x1=londontime, x2=london_limit_right, y1=flondonhigh, y2=flondonhigh, color=LondonColor, width=DEFAULT_LINE_WIDTH, xloc=xloc.bar_time, style=linestyles)
var londonl_line = line.new(x1=londontime, x2=london_limit_right, y1=flondonlow, y2=flondonlow, color=LondonColor, width=DEFAULT_LINE_WIDTH, xloc=xloc.bar_time, style=linestyles)
var londono_line = line.new(x1=londontime, x2=london_limit_right, y1=flondonopen, y2=flondonopen, color=LondonColor, width=DEFAULT_LINE_WIDTH, xloc=xloc.bar_time, style=linestyles)
var londonh_label = label.new(x=london_limit_right, y=flondonhigh, text=lhtext, style=DEFAULT_LABEL_STYLE, textcolor=LondonColor, size=DEFAULT_LABEL_SIZE, xloc=xloc.bar_time)
var londonl_label = label.new(x=london_limit_right, y=flondonlow, text=lltext, style=DEFAULT_LABEL_STYLE, textcolor=LondonColor, size=DEFAULT_LABEL_SIZE, xloc=xloc.bar_time)
var londono_label = label.new(x=london_limit_right, y=flondonopen, text=lotext, style=DEFAULT_LABEL_STYLE, textcolor=LondonColor, size=DEFAULT_LABEL_SIZE, xloc=xloc.bar_time)
line.set_x1(londonh_line, londontime)
line.set_x2(londonh_line, london_limit_right)
line.set_y1(londonh_line, flondonhigh)
line.set_y2(londonh_line, flondonhigh)
line.set_x1(londonl_line, londontime)
line.set_x2(londonl_line, london_limit_right)
line.set_y1(londonl_line, flondonlow)
line.set_y2(londonl_line, flondonlow)
line.set_x1(londono_line, londontime)
line.set_x2(londono_line, london_limit_right)
line.set_y1(londono_line, flondonopen)
line.set_y2(londono_line, flondonopen)
label.set_x(londonh_label, london_limit_right)
label.set_y(londonh_label, flondonhigh)
label.set_text(londonh_label, lhtext)
label.set_x(londonl_label, london_limit_right)
label.set_y(londonl_label, flondonlow)
label.set_text(londonl_label, lltext)
label.set_x(londono_label, london_limit_right)
label.set_y(londono_label, flondonopen)
label.set_text(londono_label, lotext)
if mergebool
f_LevelMerge(pricearray, labelarray, flondonhigh, londonh_label, LondonColor)
f_LevelMerge(pricearray, labelarray, flondonlow, londonl_label, LondonColor)
f_LevelMerge(pricearray, labelarray, flondonopen, londono_label, LondonColor)
//////////////////////////////////////////////////////////////////////////////////
/////////////////////////////////
if is_usrange_enabled
//label.new(bar_index,high)
us_limit_right = get_limit_right(DEFAULT_EXTEND_RIGHT)
if displayStyle == 'Right Anchored'
ustime := get_limit_right(radistance)
ustime
var ush_line = line.new(x1=ustime, x2=us_limit_right, y1=fushigh, y2=fushigh, color=USColor, width=DEFAULT_LINE_WIDTH, xloc=xloc.bar_time, style=linestyles)
var usl_line = line.new(x1=ustime, x2=us_limit_right, y1=fuslow, y2=fuslow, color=USColor, width=DEFAULT_LINE_WIDTH, xloc=xloc.bar_time, style=linestyles)
var uso_line = line.new(x1=ustime, x2=us_limit_right, y1=fusopen, y2=fusopen, color=USColor, width=DEFAULT_LINE_WIDTH, xloc=xloc.bar_time, style=linestyles)
var ush_label = label.new(x=us_limit_right, y=fushigh, text=lhtext, style=DEFAULT_LABEL_STYLE, textcolor=USColor, size=DEFAULT_LABEL_SIZE, xloc=xloc.bar_time)
var usl_label = label.new(x=us_limit_right, y=fuslow, text=lltext, style=DEFAULT_LABEL_STYLE, textcolor=USColor, size=DEFAULT_LABEL_SIZE, xloc=xloc.bar_time)
var uso_label = label.new(x=us_limit_right, y=fusopen, text=lotext, style=DEFAULT_LABEL_STYLE, textcolor=USColor, size=DEFAULT_LABEL_SIZE, xloc=xloc.bar_time)
line.set_x1(ush_line, ustime)
line.set_x2(ush_line, us_limit_right)
line.set_y1(ush_line, fushigh)
line.set_y2(ush_line, fushigh)
line.set_x1(usl_line, ustime)
line.set_x2(usl_line, us_limit_right)
line.set_y1(usl_line, fuslow)
line.set_y2(usl_line, fuslow)
line.set_x1(uso_line, ustime)
line.set_x2(uso_line, us_limit_right)
line.set_y1(uso_line, fusopen)
line.set_y2(uso_line, fusopen)
label.set_x(ush_label, us_limit_right)
label.set_y(ush_label, fushigh)
label.set_text(ush_label, ushtext)
label.set_x(usl_label, us_limit_right)
label.set_y(usl_label, fuslow)
label.set_text(usl_label, usltext)
label.set_x(uso_label, us_limit_right)
label.set_y(uso_label, fusopen)
label.set_text(uso_label, usotext)
if mergebool
f_LevelMerge(pricearray, labelarray, fushigh, ush_label, USColor)
f_LevelMerge(pricearray, labelarray, fuslow, usl_label, USColor)
f_LevelMerge(pricearray, labelarray, fusopen, uso_label, USColor)
/////////////////////////////////
if is_asiarange_enabled
//label.new(bar_index,high)
asia_limit_right = get_limit_right(DEFAULT_EXTEND_RIGHT)
if displayStyle == 'Right Anchored'
asiatime := get_limit_right(radistance)
asiatime
var asiah_line = line.new(x1=asiatime, x2=asia_limit_right, y1=fasiahigh, y2=fasiahigh, color=AsiaColor, width=DEFAULT_LINE_WIDTH, xloc=xloc.bar_time, style=linestyles)
var asial_line = line.new(x1=asiatime, x2=asia_limit_right, y1=fasialow, y2=fasialow, color=AsiaColor, width=DEFAULT_LINE_WIDTH, xloc=xloc.bar_time, style=linestyles)
var asiao_line = line.new(x1=asiatime, x2=asia_limit_right, y1=fasiaopen, y2=fasiaopen, color=AsiaColor, width=DEFAULT_LINE_WIDTH, xloc=xloc.bar_time, style=linestyles)
var asiah_label = label.new(x=asia_limit_right, y=fasiahigh, text=asiahtext, style=DEFAULT_LABEL_STYLE, textcolor=AsiaColor, size=DEFAULT_LABEL_SIZE, xloc=xloc.bar_time)
var asial_label = label.new(x=asia_limit_right, y=fasialow, text=asialtext, style=DEFAULT_LABEL_STYLE, textcolor=AsiaColor, size=DEFAULT_LABEL_SIZE, xloc=xloc.bar_time)
var asiao_label = label.new(x=asia_limit_right, y=fasiaopen, text=asiaotext, style=DEFAULT_LABEL_STYLE, textcolor=AsiaColor, size=DEFAULT_LABEL_SIZE, xloc=xloc.bar_time)
line.set_x1(asiah_line, asiatime)
line.set_x2(asiah_line, asia_limit_right)
line.set_y1(asiah_line, fasiahigh)
line.set_y2(asiah_line, fasiahigh)
line.set_x1(asial_line, asiatime)
line.set_x2(asial_line, asia_limit_right)
line.set_y1(asial_line, fasialow)
line.set_y2(asial_line, fasialow)
line.set_x1(asiao_line, asiatime)
line.set_x2(asiao_line, asia_limit_right)
line.set_y1(asiao_line, fasiaopen)
line.set_y2(asiao_line, fasiaopen)
label.set_x(asiah_label, asia_limit_right)
label.set_y(asiah_label, fasiahigh)
label.set_text(asiah_label, asiahtext)
label.set_x(asial_label, asia_limit_right)
label.set_y(asial_label, fasialow)
label.set_text(asial_label, asialtext)
label.set_x(asiao_label, asia_limit_right)
label.set_y(asiao_label, fasiaopen)
label.set_text(asiao_label, asiaotext)
if mergebool
f_LevelMerge(pricearray, labelarray, fasiahigh, asiah_label, AsiaColor)
f_LevelMerge(pricearray, labelarray, fasialow, asial_label, AsiaColor)
f_LevelMerge(pricearray, labelarray, fasiaopen, asiao_label, AsiaColor)
//////////////////////////////////////////////////////////////////////////////////
//////////////////////////////////////////////////////////////////////////////////
if can_draw_intra
intra_limit_right = get_limit_right(DEFAULT_EXTEND_RIGHT)
if displayStyle == 'Right Anchored'
intra_time := get_limit_right(radistance)
intra_time
var intra_line = line.new(x1=intra_time, x2=intra_limit_right, y1=intra_open, y2=intra_open, color=IntraColor, width=DEFAULT_LINE_WIDTH, xloc=xloc.bar_time, style=linestyles)
var intra_label = label.new(x=intra_limit_right, y=intra_open, text=iotext, style=DEFAULT_LABEL_STYLE, textcolor=IntraColor, size=DEFAULT_LABEL_SIZE, xloc=xloc.bar_time)
line.set_x1(intra_line, intra_time)
line.set_x2(intra_line, intra_limit_right)
line.set_y1(intra_line, intra_open)
line.set_y2(intra_line, intra_open)
label.set_x(intra_label, intra_limit_right)
label.set_y(intra_label, intra_open)
label.set_text(intra_label, iotext)
if mergebool
f_LevelMerge(pricearray, labelarray, intra_open, intra_label, IntraColor)
//////////////////////////////////////////////////////////////////////////////////
//HIGH HIGH HIGH HIGH HIGH HIGH HIGH HIGH HIGH HIGH HIGH HIGH HIGH HIGH HIGH HIGH
if can_draw_intrah
intrah_limit_right = get_limit_right(DEFAULT_EXTEND_RIGHT)
if displayStyle == 'Right Anchored'
intrah_time := get_limit_right(radistance)
intrah_time
var intrah_line = line.new(x1=intrah_time, x2=intrah_limit_right, y1=intrah_open, y2=intrah_open, color=IntraColor, width=DEFAULT_LINE_WIDTH, xloc=xloc.bar_time, style=linestyles)
var intrah_label = label.new(x=intrah_limit_right, y=intrah_open, text=pihtext, style=DEFAULT_LABEL_STYLE, textcolor=IntraColor, size=DEFAULT_LABEL_SIZE, xloc=xloc.bar_time)
line.set_x1(intrah_line, intrah_time)
line.set_x2(intrah_line, intrah_limit_right)
line.set_y1(intrah_line, intrah_open)
line.set_y2(intrah_line, intrah_open)
label.set_x(intrah_label, intrah_limit_right)
label.set_y(intrah_label, intrah_open)
label.set_text(intrah_label, pihtext)
if mergebool
f_LevelMerge(pricearray, labelarray, intrah_open, intrah_label, IntraColor)
//////////////////////////////////////////////////////////////////////////////////
//LOW LOW LOW LOW LOW LOW LOW LOW LOW LOW LOW LOW LOW LOW LOW LOW
if can_draw_intral
intral_limit_right = get_limit_right(DEFAULT_EXTEND_RIGHT)
if displayStyle == 'Right Anchored'
intral_time := get_limit_right(radistance)
intral_time
var intral_line = line.new(x1=intral_time, x2=intral_limit_right, y1=intral_open, y2=intral_open, color=IntraColor, width=DEFAULT_LINE_WIDTH, xloc=xloc.bar_time, style=linestyles)
var intral_label = label.new(x=intral_limit_right, y=intral_open, text=piltext, style=DEFAULT_LABEL_STYLE, textcolor=IntraColor, size=DEFAULT_LABEL_SIZE, xloc=xloc.bar_time)
line.set_x1(intral_line, intral_time)
line.set_x2(intral_line, intral_limit_right)
line.set_y1(intral_line, intral_open)
line.set_y2(intral_line, intral_open)
label.set_x(intral_label, intral_limit_right)
label.set_y(intral_label, intral_open)
label.set_text(intral_label, piltext)
if mergebool
f_LevelMerge(pricearray, labelarray, intral_open, intral_label, IntraColor)
///////////////////////////////////////////////////////////////////////////////
if can_draw_intram
intram_limit_right = get_limit_right(DEFAULT_EXTEND_RIGHT)
intram_time = intrah_time
intram_open = (intral_open + intrah_open) / 2
if displayStyle == 'Right Anchored'
intram_time := get_limit_right(radistance)
intram_time
var intram_line = line.new(x1=intram_time, x2=intram_limit_right, y1=intram_open, y2=intram_open, color=IntraColor, width=DEFAULT_LINE_WIDTH, xloc=xloc.bar_time, style=linestyles)
var intram_label = label.new(x=intram_limit_right, y=intram_open, text=pimtext, style=DEFAULT_LABEL_STYLE, textcolor=IntraColor, size=DEFAULT_LABEL_SIZE, xloc=xloc.bar_time)
line.set_x1(intram_line, intram_time)
line.set_x2(intram_line, intram_limit_right)
line.set_y1(intram_line, intram_open)
line.set_y2(intram_line, intram_open)
label.set_x(intram_label, intram_limit_right)
label.set_y(intram_label, intram_open)
label.set_text(intram_label, pimtext)
if mergebool
f_LevelMerge(pricearray, labelarray, intram_open, intram_label, IntraColor)
////////////////////////////////////////// MONDAY
if is_monday_enabled
monday_limit_right = get_limit_right(DEFAULT_EXTEND_RIGHT)
if displayStyle == 'Right Anchored'
monday_time := get_limit_right(radistance)
monday_time
var monday_line = line.new(x1=monday_time, x2=monday_limit_right, y1=monday_high, y2=monday_high, color=MondayColor, width=DEFAULT_LINE_WIDTH, xloc=xloc.bar_time, style=linestyles)
var monday_label = label.new(x=monday_limit_right, y=monday_high, text=pmonhtext, style=DEFAULT_LABEL_STYLE, textcolor=MondayColor, size=DEFAULT_LABEL_SIZE, xloc=xloc.bar_time)
line.set_x1(monday_line, monday_time)
line.set_x2(monday_line, monday_limit_right)
line.set_y1(monday_line, monday_high)
line.set_y2(monday_line, monday_high)
label.set_x(monday_label, monday_limit_right)
label.set_y(monday_label, monday_high)
label.set_text(monday_label, pmonhtext)
if mergebool
f_LevelMerge(pricearray, labelarray, monday_high, monday_label, MondayColor)
if is_monday_enabled
monday_limit_right = get_limit_right(DEFAULT_EXTEND_RIGHT)
if displayStyle == 'Right Anchored'
monday_time := get_limit_right(radistance)
monday_time
var monday_low_line = line.new(x1=monday_time, x2=monday_limit_right, y1=monday_low, y2=monday_low, color=MondayColor, width=DEFAULT_LINE_WIDTH, xloc=xloc.bar_time, style=linestyles)
var monday_low_label = label.new(x=monday_limit_right, y=monday_low, text=pmonltext, style=DEFAULT_LABEL_STYLE, textcolor=MondayColor, size=DEFAULT_LABEL_SIZE, xloc=xloc.bar_time)
line.set_x1(monday_low_line, monday_time)
line.set_x2(monday_low_line, monday_limit_right)
line.set_y1(monday_low_line, monday_low)
line.set_y2(monday_low_line, monday_low)
label.set_x(monday_low_label, monday_limit_right)
label.set_y(monday_low_label, monday_low)
label.set_text(monday_low_label, pmonltext)
if mergebool
f_LevelMerge(pricearray, labelarray, monday_low, monday_low_label, MondayColor)
if is_monday_mid
mondaym_limit_right = get_limit_right(DEFAULT_EXTEND_RIGHT)
mondaym_open = (monday_high + monday_low) / 2
if displayStyle == 'Right Anchored'
monday_time := get_limit_right(radistance)
monday_time
var mondaym_line = line.new(x1=monday_time, x2=mondaym_limit_right, y1=mondaym_open, y2=mondaym_open, color=MondayColor, width=DEFAULT_LINE_WIDTH, xloc=xloc.bar_time, style=linestyles)
var mondaym_label = label.new(x=mondaym_limit_right, y=mondaym_open, text=pmonmtext, style=DEFAULT_LABEL_STYLE, textcolor=MondayColor, size=DEFAULT_LABEL_SIZE, xloc=xloc.bar_time)
line.set_x1(mondaym_line, monday_time)
line.set_x2(mondaym_line, mondaym_limit_right)
line.set_y1(mondaym_line, mondaym_open)
line.set_y2(mondaym_line, mondaym_open)
label.set_x(mondaym_label, mondaym_limit_right)
label.set_y(mondaym_label, mondaym_open)
label.set_text(mondaym_label, pmonmtext)
if mergebool
f_LevelMerge(pricearray, labelarray, mondaym_open, mondaym_label, MondayColor)
//////////////////////////////////////////////////////////////////////////////////
////////////////////////DAILY OPEN DAILY OPEN DAILY OPEN DAILY OPEN DAILY OPEN DAILY OPEN DAILY OPEN
if is_daily_enabled
daily_limit_right = get_limit_right(DEFAULT_EXTEND_RIGHT)
if displayStyle == 'Right Anchored'
daily_time := get_limit_right(radistance)
daily_time
var daily_line = line.new(x1=daily_time, x2=daily_limit_right, y1=daily_open, y2=daily_open, color=DailyColor, width=DEFAULT_LINE_WIDTH, xloc=xloc.bar_time, style=linestyles)
var daily_label = label.new(x=daily_limit_right, y=daily_open, text=dotext, style=DEFAULT_LABEL_STYLE, textcolor=DailyColor, size=DEFAULT_LABEL_SIZE, xloc=xloc.bar_time)
line.set_x1(daily_line, daily_time)
line.set_x2(daily_line, daily_limit_right)
line.set_y1(daily_line, daily_open)
line.set_y2(daily_line, daily_open)
label.set_x(daily_label, daily_limit_right)
label.set_y(daily_label, daily_open)
label.set_text(daily_label, dotext)
if mergebool
f_LevelMerge(pricearray, labelarray, daily_open, daily_label, DailyColor)
//////////////////////////////////////////////////////////////////////////////////
//////////////////DAILY HIGH DAILY HIGH DAILY HIGH DAILY HIGH DAILY HIGH DAILY HIGH DAILY HIGH
if is_dailyrange_enabled
dailyh_limit_right = get_limit_right(DEFAULT_EXTEND_RIGHT)
if displayStyle == 'Right Anchored'
dailyh_time := get_limit_right(radistance)
dailyh_time
// draw tails before lines for better visual
var dailyh_line = line.new(x1=dailyh_time, x2=dailyh_limit_right, y1=dailyh_open, y2=dailyh_open, color=DailyColor, width=DEFAULT_LINE_WIDTH, xloc=xloc.bar_time, style=linestyles)
var dailyh_label = label.new(x=dailyh_limit_right, y=dailyh_open, text=pdhtext, style=DEFAULT_LABEL_STYLE, textcolor=DailyColor, size=DEFAULT_LABEL_SIZE, xloc=xloc.bar_time)
line.set_x1(dailyh_line, dailyh_time)
line.set_x2(dailyh_line, dailyh_limit_right)
line.set_y1(dailyh_line, dailyh_open)
line.set_y2(dailyh_line, dailyh_open)
label.set_x(dailyh_label, dailyh_limit_right)
label.set_y(dailyh_label, dailyh_open)
label.set_text(dailyh_label, pdhtext)
if mergebool
f_LevelMerge(pricearray, labelarray, dailyh_open, dailyh_label, DailyColor)
//////////////////////////////////////////////////////////////////////////////////
//////////////////DAILY LOW DAILY LOW DAILY LOW DAILY LOW DAILY LOW DAILY LOW DAILY LOW DAILY LOW
if is_dailyrange_enabled
dailyl_limit_right = get_limit_right(DEFAULT_EXTEND_RIGHT)
if displayStyle == 'Right Anchored'
dailyl_time := get_limit_right(radistance)
dailyl_time
var dailyl_line = line.new(x1=dailyl_time, x2=dailyl_limit_right, y1=dailyl_open, y2=dailyl_open, color=DailyColor, width=DEFAULT_LINE_WIDTH, xloc=xloc.bar_time, style=linestyles)
var dailyl_label = label.new(x=dailyl_limit_right, y=dailyl_open, text=pdltext, style=DEFAULT_LABEL_STYLE, textcolor=DailyColor, size=DEFAULT_LABEL_SIZE, xloc=xloc.bar_time)
line.set_x1(dailyl_line, dailyl_time)
line.set_x2(dailyl_line, dailyl_limit_right)
line.set_y1(dailyl_line, dailyl_open)
line.set_y2(dailyl_line, dailyl_open)
label.set_x(dailyl_label, dailyl_limit_right)
label.set_y(dailyl_label, dailyl_open)
label.set_text(dailyl_label, pdltext)
if mergebool
f_LevelMerge(pricearray, labelarray, dailyl_open, dailyl_label, DailyColor)
//////////////////////////////////////////////////////////////////////////////// Daily MID
if is_dailym_enabled
dailym_limit_right = get_limit_right(DEFAULT_EXTEND_RIGHT)
dailym_time = dailyh_time
dailym_open = (dailyl_open + dailyh_open) / 2
if displayStyle == 'Right Anchored'
dailym_time := get_limit_right(radistance)
dailym_time
var dailym_line = line.new(x1=dailym_time, x2=dailym_limit_right, y1=dailym_open, y2=dailym_open, color=DailyColor, width=DEFAULT_LINE_WIDTH, xloc=xloc.bar_time, style=linestyles)
var dailym_label = label.new(x=dailym_limit_right, y=dailym_open, text=pdmtext, style=DEFAULT_LABEL_STYLE, textcolor=DailyColor, size=DEFAULT_LABEL_SIZE, xloc=xloc.bar_time)
line.set_x1(dailym_line, dailym_time)
line.set_x2(dailym_line, dailym_limit_right)
line.set_y1(dailym_line, dailym_open)
line.set_y2(dailym_line, dailym_open)
label.set_x(dailym_label, dailym_limit_right)
label.set_y(dailym_label, dailym_open)
label.set_text(dailym_label, pdmtext)
if mergebool
f_LevelMerge(pricearray, labelarray, dailym_open, dailym_label, DailyColor)
//////////////////////////////////////////////////////////////////////////////////
if is_weekly_enabled
weekly_limit_right = get_limit_right(DEFAULT_EXTEND_RIGHT)
cweekly_time = weekly_time
if displayStyle == 'Right Anchored'
cweekly_time := get_limit_right(radistance)
cweekly_time
var weekly_line = line.new(x1=cweekly_time, x2=weekly_limit_right, y1=weekly_open, y2=weekly_open, color=WeeklyColor, width=DEFAULT_LINE_WIDTH, xloc=xloc.bar_time, style=linestyles)
var weekly_label = label.new(x=weekly_limit_right, y=weekly_open, text=wotext, style=DEFAULT_LABEL_STYLE, textcolor=WeeklyColor, size=DEFAULT_LABEL_SIZE, xloc=xloc.bar_time)
line.set_x1(weekly_line, cweekly_time)
line.set_x2(weekly_line, weekly_limit_right)
line.set_y1(weekly_line, weekly_open)
line.set_y2(weekly_line, weekly_open)
label.set_x(weekly_label, weekly_limit_right)
label.set_y(weekly_label, weekly_open)
label.set_text(weekly_label, wotext)
if mergebool
f_LevelMerge(pricearray, labelarray, weekly_open, weekly_label, WeeklyColor)
// the weekly open can be the daily open too (monday)
// only the weekly will be draw, in these case we update its label
// if is_weekly_open and can_show_daily
// label.set_text(weekly_label, "DO / WO ")
//////////////////////////////////////////////////////////////////////////////////
////////////////////////////////////////////////////////////////////////////////// WEEKLY HIGH WEEKLY HIGH WEEKLY HIGH
if is_weeklyrange_enabled
weeklyh_limit_right = get_limit_right(DEFAULT_EXTEND_RIGHT)
if displayStyle == 'Right Anchored'
weeklyh_time := get_limit_right(radistance)
weeklyh_time
var weeklyh_line = line.new(x1=weeklyh_time, x2=weeklyh_limit_right, y1=weeklyh_open, y2=weeklyh_open, color=WeeklyColor, width=DEFAULT_LINE_WIDTH, xloc=xloc.bar_time, style=linestyles)
var weeklyh_label = label.new(x=weeklyh_limit_right, y=weeklyh_open, text=pwhtext, style=DEFAULT_LABEL_STYLE, textcolor=WeeklyColor, size=DEFAULT_LABEL_SIZE, xloc=xloc.bar_time)
line.set_x1(weeklyh_line, weeklyh_time)
line.set_x2(weeklyh_line, weeklyh_limit_right)
line.set_y1(weeklyh_line, weeklyh_open)
line.set_y2(weeklyh_line, weeklyh_open)
label.set_x(weeklyh_label, weeklyh_limit_right)
label.set_y(weeklyh_label, weeklyh_open)
label.set_text(weeklyh_label, pwhtext)
if mergebool
f_LevelMerge(pricearray, labelarray, weeklyh_open, weeklyh_label, WeeklyColor)
//////////////////////////////////////////////////////////////////////////////////
////////////////////////////////////////////////////////////////////////////////// WEEKLY LOW WEEKLY LOW WEEKLY LOW
if is_weeklyrange_enabled
weeklyl_limit_right = get_limit_right(DEFAULT_EXTEND_RIGHT)
if displayStyle == 'Right Anchored'
weeklyl_time := get_limit_right(radistance)
weeklyl_time
var weeklyl_line = line.new(x1=weeklyl_time, x2=weeklyl_limit_right, y1=weekly_open, y2=weekly_open, color=WeeklyColor, width=DEFAULT_LINE_WIDTH, xloc=xloc.bar_time, style=linestyles)
var weeklyl_label = label.new(x=weeklyl_limit_right, y=weeklyl_open, text=pwltext, style=DEFAULT_LABEL_STYLE, textcolor=WeeklyColor, size=DEFAULT_LABEL_SIZE, xloc=xloc.bar_time)
line.set_x1(weeklyl_line, weeklyl_time)
line.set_x2(weeklyl_line, weeklyl_limit_right)
line.set_y1(weeklyl_line, weeklyl_open)
line.set_y2(weeklyl_line, weeklyl_open)
label.set_x(weeklyl_label, weeklyl_limit_right)
label.set_y(weeklyl_label, weeklyl_open)
label.set_text(weeklyl_label, pwltext)
if mergebool
f_LevelMerge(pricearray, labelarray, weeklyl_open, weeklyl_label, WeeklyColor)
//////////////////////////////////////////////////////////////////////////////////
//////////////////////////////////////////////////////////////////////////////// Weekly MID
if is_weekly_mid
weeklym_limit_right = get_limit_right(DEFAULT_EXTEND_RIGHT)
weeklym_time = weeklyh_time
weeklym_open = (weeklyl_open + weeklyh_open) / 2
if displayStyle == 'Right Anchored'
weeklym_time := get_limit_right(radistance)
weeklym_time
var weeklym_line = line.new(x1=weeklym_time, x2=weeklym_limit_right, y1=weeklym_open, y2=weeklym_open, color=WeeklyColor, width=DEFAULT_LINE_WIDTH, xloc=xloc.bar_time, style=linestyles)
var weeklym_label = label.new(x=weeklym_limit_right, y=weeklym_open, text=pwmtext, style=DEFAULT_LABEL_STYLE, textcolor=WeeklyColor, size=DEFAULT_LABEL_SIZE, xloc=xloc.bar_time)
line.set_x1(weeklym_line, weeklym_time)
line.set_x2(weeklym_line, weeklym_limit_right)
line.set_y1(weeklym_line, weeklym_open)
line.set_y2(weeklym_line, weeklym_open)
label.set_x(weeklym_label, weeklym_limit_right)
label.set_y(weeklym_label, weeklym_open)
label.set_text(weeklym_label, pwmtext)
if mergebool
f_LevelMerge(pricearray, labelarray, weeklym_open, weeklym_label, WeeklyColor)
////////////////////////////////////////////////////////////////////////////////// YEEEAARRLLYY LOW LOW LOW
if is_yearlyrange_enabled
yearlyl_limit_right = get_limit_right(DEFAULT_EXTEND_RIGHT)
if displayStyle == 'Right Anchored'
yearlyl_time := get_limit_right(radistance)
yearlyl_time
var yearlyl_line = line.new(x1=yearlyl_time, x2=yearlyl_limit_right, y1=yearlyl_open, y2=yearlyl_open, color=YearlyColor, width=DEFAULT_LINE_WIDTH, xloc=xloc.bar_time, style=linestyles)
var yearlyl_label = label.new(x=yearlyl_limit_right, y=yearlyl_open, text=cyltext, style=DEFAULT_LABEL_STYLE, textcolor=YearlyColor, size=DEFAULT_LABEL_SIZE, xloc=xloc.bar_time)
line.set_x1(yearlyl_line, yearlyl_time)
line.set_x2(yearlyl_line, yearlyl_limit_right)
line.set_y1(yearlyl_line, yearlyl_open)
line.set_y2(yearlyl_line, yearlyl_open)
label.set_x(yearlyl_label, yearlyl_limit_right)
label.set_y(yearlyl_label, yearlyl_open)
label.set_text(yearlyl_label, cyltext)
if mergebool
f_LevelMerge(pricearray, labelarray, yearlyl_open, yearlyl_label, YearlyColor)
//////////////////////////////////////////////////////////////////////////////////
////////////////////////////////////////////////////////////////////////////////// YEEEAARRLLYY HIGH HIGH HIGH
if is_yearlyrange_enabled
yearlyh_limit_right = get_limit_right(DEFAULT_EXTEND_RIGHT)
if displayStyle == 'Right Anchored'
yearlyh_time := get_limit_right(radistance)
yearlyh_time
var yearlyh_line = line.new(x1=yearlyh_time, x2=yearlyh_limit_right, y1=yearlyh_open, y2=yearlyh_open, color=YearlyColor, width=DEFAULT_LINE_WIDTH, xloc=xloc.bar_time, style=linestyles)
var yearlyh_label = label.new(x=yearlyh_limit_right, y=yearlyh_open, text=cyhtext, style=DEFAULT_LABEL_STYLE, textcolor=YearlyColor, size=DEFAULT_LABEL_SIZE, xloc=xloc.bar_time)
line.set_x1(yearlyh_line, yearlyh_time)
line.set_x2(yearlyh_line, yearlyh_limit_right)
line.set_y1(yearlyh_line, yearlyh_open)
line.set_y2(yearlyh_line, yearlyh_open)
label.set_x(yearlyh_label, yearlyh_limit_right)
label.set_y(yearlyh_label, yearlyh_open)
label.set_text(yearlyh_label, cyhtext)
if mergebool
f_LevelMerge(pricearray, labelarray, yearlyh_open, yearlyh_label, YearlyColor)
//////////////////////////////////////////////////////////////////////////////////
////////////////////////////////////////////////////////////////////////////////// YEEEAARRLLYY OPEN
if is_yearly_enabled
yearly_limit_right = get_limit_right(DEFAULT_EXTEND_RIGHT)
if displayStyle == 'Right Anchored'
yearly_time := get_limit_right(radistance)
yearly_time
var yearly_line = line.new(x1=yearly_time, x2=yearly_limit_right, y1=yearly_open, y2=yearly_open, color=YearlyColor, width=DEFAULT_LINE_WIDTH, xloc=xloc.bar_time, style=linestyles)
var yearly_label = label.new(x=yearly_limit_right, y=yearly_open, text=yotext, style=DEFAULT_LABEL_STYLE, textcolor=YearlyColor, size=DEFAULT_LABEL_SIZE, xloc=xloc.bar_time)
line.set_x1(yearly_line, yearly_time)
line.set_x2(yearly_line, yearly_limit_right)
line.set_y1(yearly_line, yearly_open)
line.set_y2(yearly_line, yearly_open)
label.set_x(yearly_label, yearly_limit_right)
label.set_y(yearly_label, yearly_open)
label.set_text(yearly_label, yotext)
if mergebool
f_LevelMerge(pricearray, labelarray, yearly_open, yearly_label, YearlyColor)
//////////////////////////////////////////////////////////////////////////////////
//////////////////////////////////////////////////////////////////////////////// yearly MID
if is_yearly_mid
yearlym_limit_right = get_limit_right(DEFAULT_EXTEND_RIGHT)
yearlym_time = yearlyh_time
yearlym_open = (yearlyl_open + yearlyh_open) / 2
if displayStyle == 'Right Anchored'
yearlym_time := get_limit_right(radistance)
yearlym_time
var yearlym_line = line.new(x1=yearlym_time, x2=yearlym_limit_right, y1=yearlym_open, y2=yearlym_open, color=YearlyColor, width=DEFAULT_LINE_WIDTH, xloc=xloc.bar_time, style=linestyles)
var yearlym_label = label.new(x=yearlym_limit_right, y=yearlym_open, text=cymtext, style=DEFAULT_LABEL_STYLE, textcolor=YearlyColor, size=DEFAULT_LABEL_SIZE, xloc=xloc.bar_time)
line.set_x1(yearlym_line, yearlym_time)
line.set_x2(yearlym_line, yearlym_limit_right)
line.set_y1(yearlym_line, yearlym_open)
line.set_y2(yearlym_line, yearlym_open)
label.set_x(yearlym_label, yearlym_limit_right)
label.set_y(yearlym_label, yearlym_open)
label.set_text(yearlym_label, cymtext)
if mergebool
f_LevelMerge(pricearray, labelarray, yearlym_open, yearlym_label, YearlyColor)
////////////////////////////////////////////////////////////////////////////////// QUATERLLYYYYY OPEN
if is_quarterly_enabled
quarterly_limit_right = get_limit_right(DEFAULT_EXTEND_RIGHT)
if displayStyle == 'Right Anchored'
quarterly_time := get_limit_right(radistance)
quarterly_time
var quarterly_line = line.new(x1=quarterly_time, x2=quarterly_limit_right, y1=quarterly_open, y2=quarterly_open, color=quarterlyColor, width=DEFAULT_LINE_WIDTH, xloc=xloc.bar_time, style=linestyles)
var quarterly_label = label.new(x=quarterly_limit_right, y=quarterly_open, text=qotext, style=DEFAULT_LABEL_STYLE, textcolor=quarterlyColor, size=DEFAULT_LABEL_SIZE, xloc=xloc.bar_time)
line.set_x1(quarterly_line, quarterly_time)
line.set_x2(quarterly_line, quarterly_limit_right)
line.set_y1(quarterly_line, quarterly_open)
line.set_y2(quarterly_line, quarterly_open)
label.set_x(quarterly_label, quarterly_limit_right)
label.set_y(quarterly_label, quarterly_open)
label.set_text(quarterly_label, qotext)
if mergebool
f_LevelMerge(pricearray, labelarray, quarterly_open, quarterly_label, quarterlyColor)
//////////////////////////////////////////////////////////////////////////////////
////////////////////////////////////////////////////////////////////////////////// QUATERLLYYYYY High
if is_quarterlyrange_enabled
quarterlyh_limit_right = get_limit_right(DEFAULT_EXTEND_RIGHT)
if displayStyle == 'Right Anchored'
quarterlyh_time := get_limit_right(radistance)
quarterlyh_time
var quarterlyh_line = line.new(x1=quarterlyh_time, x2=quarterlyh_limit_right, y1=quarterlyh_open, y2=quarterlyh_open, color=quarterlyColor, width=DEFAULT_LINE_WIDTH, xloc=xloc.bar_time, style=linestyles)
var quarterlyh_label = label.new(x=quarterlyh_limit_right, y=quarterlyh_open, text=pqhtext, style=DEFAULT_LABEL_STYLE, textcolor=quarterlyColor, size=DEFAULT_LABEL_SIZE, xloc=xloc.bar_time)
line.set_x1(quarterlyh_line, quarterlyh_time)
line.set_x2(quarterlyh_line, quarterlyh_limit_right)
line.set_y1(quarterlyh_line, quarterlyh_open)
line.set_y2(quarterlyh_line, quarterlyh_open)
label.set_x(quarterlyh_label, quarterlyh_limit_right)
label.set_y(quarterlyh_label, quarterlyh_open)
label.set_text(quarterlyh_label, pqhtext)
if mergebool
f_LevelMerge(pricearray, labelarray, quarterlyh_open, quarterlyh_label, quarterlyColor)
//////////////////////////////////////////////////////////////////////////////////
////////////////////////////////////////////////////////////////////////////////// QUATERLLYYYYY Low
if is_quarterlyrange_enabled
quarterlyl_limit_right = get_limit_right(DEFAULT_EXTEND_RIGHT)
if displayStyle == 'Right Anchored'
quarterlyl_time := get_limit_right(radistance)
quarterlyl_time
var quarterlyl_line = line.new(x1=quarterlyl_time, x2=quarterlyl_limit_right, y1=quarterlyl_open, y2=quarterlyl_open, color=quarterlyColor, width=DEFAULT_LINE_WIDTH, xloc=xloc.bar_time, style=linestyles)
var quarterlyl_label = label.new(x=quarterlyl_limit_right, y=quarterlyl_open, text=pqltext, style=DEFAULT_LABEL_STYLE, textcolor=quarterlyColor, size=DEFAULT_LABEL_SIZE, xloc=xloc.bar_time)
line.set_x1(quarterlyl_line, quarterlyl_time)
line.set_x2(quarterlyl_line, quarterlyl_limit_right)
line.set_y1(quarterlyl_line, quarterlyl_open)
line.set_y2(quarterlyl_line, quarterlyl_open)
label.set_x(quarterlyl_label, quarterlyl_limit_right)
label.set_y(quarterlyl_label, quarterlyl_open)
label.set_text(quarterlyl_label, pqltext)
if mergebool
f_LevelMerge(pricearray, labelarray, quarterlyl_open, quarterlyl_label, quarterlyColor)
//////////////////////////////////////////////////////////////////////////////////
//////////////////////////////////////////////////////////////////////////////// QUATERLLYYYYY MID
if is_quarterly_mid
quarterlym_limit_right = get_limit_right(DEFAULT_EXTEND_RIGHT)
quarterlym_time = quarterlyh_time
quarterlym_open = (quarterlyl_open + quarterlyh_open) / 2
if displayStyle == 'Right Anchored'
quarterlym_time := get_limit_right(radistance)
quarterlym_time
var quarterlym_line = line.new(x1=quarterlym_time, x2=quarterlym_limit_right, y1=quarterlym_open, y2=quarterlym_open, color=quarterlyColor, width=DEFAULT_LINE_WIDTH, xloc=xloc.bar_time, style=linestyles)
var quarterlym_label = label.new(x=quarterlym_limit_right, y=quarterlym_open, text=pqmtext, style=DEFAULT_LABEL_STYLE, textcolor=quarterlyColor, size=DEFAULT_LABEL_SIZE, xloc=xloc.bar_time)
line.set_x1(quarterlym_line, quarterlym_time)
line.set_x2(quarterlym_line, quarterlym_limit_right)
line.set_y1(quarterlym_line, quarterlym_open)
line.set_y2(quarterlym_line, quarterlym_open)
label.set_x(quarterlym_label, quarterlym_limit_right)
label.set_y(quarterlym_label, quarterlym_open)
label.set_text(quarterlym_label, pqmtext)
if mergebool
f_LevelMerge(pricearray, labelarray, quarterlym_open, quarterlym_label, quarterlyColor)
////////////////////////////////////////////////////////////////////////////////// Monthly LOW LOW LOW
if is_monthlyrange_enabled
monthlyl_limit_right = get_limit_right(DEFAULT_EXTEND_RIGHT)
if displayStyle == 'Right Anchored'
monthlyl_time := get_limit_right(radistance)
monthlyl_time
var monthlyl_line = line.new(x1=monthlyl_time, x2=monthlyl_limit_right, y1=monthlyl_open, y2=monthlyl_open, color=MonthlyColor, width=DEFAULT_LINE_WIDTH, xloc=xloc.bar_time, style=linestyles)
var monthlyl_label = label.new(x=monthlyl_limit_right, y=monthlyl_open, text=pmltext, style=DEFAULT_LABEL_STYLE, textcolor=MonthlyColor, size=DEFAULT_LABEL_SIZE, xloc=xloc.bar_time)
line.set_x1(monthlyl_line, monthlyl_time)
line.set_x2(monthlyl_line, monthlyl_limit_right)
line.set_y1(monthlyl_line, monthlyl_open)
line.set_y2(monthlyl_line, monthlyl_open)
label.set_x(monthlyl_label, monthlyl_limit_right)
label.set_y(monthlyl_label, monthlyl_open)
label.set_text(monthlyl_label, pmltext)
if mergebool
f_LevelMerge(pricearray, labelarray, monthlyl_open, monthlyl_label, MonthlyColor)
// the weekly open can be the daily open too (monday)
// only the weekly will be draw, in these case we update its label
//////////////////////////////////////////////////////////////////////////////////
////////////////////////////////////////////////////////////////////////////////// MONTHLY HIGH HIGH HIGH
if is_monthlyrange_enabled
monthlyh_limit_right = get_limit_right(DEFAULT_EXTEND_RIGHT)
if displayStyle == 'Right Anchored'
monthlyh_time := get_limit_right(radistance)
monthlyh_time
var monthlyh_line = line.new(x1=monthlyh_time, x2=monthlyh_limit_right, y1=monthlyh_open, y2=monthlyh_open, color=MonthlyColor, width=DEFAULT_LINE_WIDTH, xloc=xloc.bar_time, style=linestyles)
var monthlyh_label = label.new(x=monthlyh_limit_right, y=monthlyh_open, text=pmhtext, style=DEFAULT_LABEL_STYLE, textcolor=MonthlyColor, size=DEFAULT_LABEL_SIZE, xloc=xloc.bar_time)
line.set_x1(monthlyh_line, monthlyl_time)
line.set_x2(monthlyh_line, monthlyh_limit_right)
line.set_y1(monthlyh_line, monthlyh_open)
line.set_y2(monthlyh_line, monthlyh_open)
label.set_x(monthlyh_label, monthlyh_limit_right)
label.set_y(monthlyh_label, monthlyh_open)
label.set_text(monthlyh_label, pmhtext)
if mergebool
f_LevelMerge(pricearray, labelarray, monthlyh_open, monthlyh_label, MonthlyColor)
// the weekly open can be the daily open too (monday)
// only the weekly will be draw, in these case we update its label
//////////////////////////////////////////////////////////////////////////////// MONTHLY MID
if is_monthly_mid
monthlym_limit_right = get_limit_right(DEFAULT_EXTEND_RIGHT)
monthlym_time = monthlyh_time
monthlym_open = (monthlyl_open + monthlyh_open) / 2
if displayStyle == 'Right Anchored'
monthlym_time := get_limit_right(radistance)
monthlym_time
var monthlym_line = line.new(x1=monthlym_time, x2=monthlym_limit_right, y1=monthlym_open, y2=monthlym_open, color=MonthlyColor, width=DEFAULT_LINE_WIDTH, xloc=xloc.bar_time, style=linestyles)
var monthlym_label = label.new(x=monthlym_limit_right, y=monthlym_open, text=pmmtext, style=DEFAULT_LABEL_STYLE, textcolor=MonthlyColor, size=DEFAULT_LABEL_SIZE, xloc=xloc.bar_time)
line.set_x1(monthlym_line, monthlym_time)
line.set_x2(monthlym_line, monthlym_limit_right)
line.set_y1(monthlym_line, monthlym_open)
line.set_y2(monthlym_line, monthlym_open)
label.set_x(monthlym_label, monthlym_limit_right)
label.set_y(monthlym_label, monthlym_open)
label.set_text(monthlym_label, pmmtext)
if mergebool
f_LevelMerge(pricearray, labelarray, monthlym_open, monthlym_label, MonthlyColor)
//////////////////////////////////////////////////////////////////////////////////
if is_monthly_enabled
monthly_limit_right = get_limit_right(DEFAULT_EXTEND_RIGHT)
if displayStyle == 'Right Anchored'
monthly_time := get_limit_right(radistance)
monthly_time
var monthlyLine = line.new(x1=monthly_time, x2=monthly_limit_right, y1=monthly_open, y2=monthly_open, color=MonthlyColor, width=DEFAULT_LINE_WIDTH, xloc=xloc.bar_time, style=linestyles)
var monthlyLabel = label.new(x=monthly_limit_right, y=monthly_open, text=motext, style=DEFAULT_LABEL_STYLE, textcolor=MonthlyColor, size=DEFAULT_LABEL_SIZE, xloc=xloc.bar_time)
line.set_x1(monthlyLine, monthly_time)
line.set_x2(monthlyLine, monthly_limit_right)
line.set_y1(monthlyLine, monthly_open)
line.set_y2(monthlyLine, monthly_open)
label.set_x(monthlyLabel, monthly_limit_right)
label.set_y(monthlyLabel, monthly_open)
label.set_text(monthlyLabel, motext)
if mergebool
f_LevelMerge(pricearray, labelarray, monthly_open, monthlyLabel, MonthlyColor)
/////////////////////////////////////////////////////////////////////////////
// the monthly open can be the weekly open (monday 1st) and/or daily open too
// only the monthly will be draw, in these case we update its label
// if is_monthly_open
// if can_show_daily
// label.set_text(monthlyLabel, "DO / MO ")
// if is_weekly_open
// if can_show_weekly
// label.set_text(monthlyLabel, "WO / MO ")
// if can_show_daily and can_show_weekly
// label.set_text(monthlyLabel, "DO / WO / MO ")
// the start of the line is drew from the first week of the month
// if the first day of the weekly candle (monday) is the 2nd of the month
// we fix the start of the line position on the Prev weekly candle
if timeframe.isweekly and dayofweek(monthly_time) != dayofweek.monday
line.set_x1(monthlyLine, monthly_time - (weekly_time - weekly_time ))

Sessions High/Low with Break LogicSessions High/Low with Break Logic – Indicator Description
Update 27.10.25
Overview
This indicator marks the highs and lows of key trading sessions (Tokyo, London, New York) and highlights when these levels are broken. It is ideal for traders using session-based strategies to monitor breakouts or support/resistance levels in real time.
Key Features
Session-Based Highs/Lows:
Tracks highs and lows for three trading sessions:
Tokyo: 02:00–09:00 (UTC+1)
London: 09:00–17:00 (UTC+1)
New York: 15:30–22:00 (UTC+1)
Break Logic:
Detects when the current price breaks a session high or low.
Labels are updated with a "Break" note when a level is breached.
Visual Display:
Draws horizontal lines for highs and lows of each session.
Adds labels with values (optionally including price).
Colors are customizable for each session:
Tokyo: Purple
London: Teal
New York: Orange
Customizable Settings:
Horizontal Offset: Shifts lines and labels horizontally for clarity.
Time Zone: Adjustable to UTC+1 (default).
Price Display: Option to show the exact price next to the label.
Settings and Translations
Display Settings
Horizontal Offset: Horizontal shift for lines and labels.
Show Price with Text: Displays the price next to the label (e.g., "London High: 123.45").
Time Settings
UTC: Time zone (default: UTC+1).
Session 1 (Tokyo)
Session 1: 02:00–09:00
High Text: "Tokyo High"
Low Text: "Tokyo Low"
High Color: Purple
Low Color: Purple
Session 2 (London)
Session 2: 09:00–17:00
High Text: "London High"
Low Text: "London Low"
High Color: Teal
Low Color: Teal
Session 3 (New York)
Session 3: 15:30–22:00
High Text: "New York High"
Low Text: "New York Low"
High Color: Orange
Low Color: Orange

Trend Gauge [BullByte]Trend Gauge
Summary
A multi-factor trend detection indicator that aggregates EMA alignment, VWMA momentum scaling, volume spikes, ATR breakout strength, higher-timeframe confirmation, ADX-based regime filtering, and RSI pivot-divergence penalty into one normalized trend score. It also provides a confidence meter, a Δ Score momentum histogram, divergence highlights, and a compact, scalable dashboard for at-a-glance status.
________________________________________
## 1. Purpose of the Indicator
Why this was built
Traders often monitor several indicators in parallel - EMAs, volume signals, volatility breakouts, higher-timeframe trends, ADX readings, divergence alerts, etc., which can be cumbersome and sometimes contradictory. The “Trend Gauge” indicator was created to consolidate these complementary checks into a single, normalized score that reflects the prevailing market bias (bullish, bearish, or neutral) and its strength. By combining multiple inputs with an adaptive regime filter, scaling contributions by magnitude, and penalizing weakening signals (divergence), this tool aims to reduce noise, highlight genuine trend opportunities, and warn when momentum fades.
Key Design Goals
Signal Aggregation
Merged trend-following signals (EMA crossover, ATR breakout, higher-timeframe confirmation) and momentum signals (VWMA thrust, volume spikes) into a unified score that reflects directional bias more holistically.
Market Regime Awareness
Implemented an ADX-style filter to distinguish between trending and ranging markets, reducing the influence of trend signals during sideways phases to avoid false breakouts.
Magnitude-Based Scaling
Replaced binary contributions with scaled inputs: VWMA thrust and ATR breakout are weighted relative to recent averages, allowing for more nuanced score adjustments based on signal strength.
Momentum Divergence Penalty
Integrated pivot-based RSI divergence detection to slightly reduce the overall score when early signs of momentum weakening are detected, improving risk-awareness in entries.
Confidence Transparency
Added a live confidence metric that shows what percentage of enabled sub-indicators currently agree with the overall bias, making the scoring system more interpretable.
Momentum Acceleration Visualization
Plotted the change in score (Δ Score) as a histogram bar-to-bar, highlighting whether momentum is increasing, flattening, or reversing, aiding in more timely decision-making.
Compact Informational Dashboard
Presented a clean, scalable dashboard that displays each component’s status, the final score, confidence %, detected regime (Trending/Ranging), and a labeled strength gauge for quick visual assessment.
________________________________________
## 2. Why a Trader Should Use It
Main benefits and use cases
1. Unified View: Rather than juggling multiple windows or panels, this indicator delivers a single score synthesizing diverse signals.
2. Regime Filtering: In ranging markets, trend signals often generate false entries. The ADX-based regime filter automatically down-weights trend-following components, helping you avoid chasing false breakouts.
3. Nuanced Momentum & Volatility: VWMA and ATR breakout contributions are normalized by recent averages, so strong moves register strongly while smaller fluctuations are de-emphasized.
4. Early Warning of Weakening: Pivot-based RSI divergence is detected and used to slightly reduce the score when price/momentum diverges, giving a cautionary signal before a full reversal.
5. Confidence Meter: See at a glance how many sub-indicators align with the aggregated bias (e.g., “80% confidence” means 4 out of 5 components agree ). This transparency avoids black-box decisions.
6. Trend Acceleration/Deceleration View: The Δ Score histogram visualizes whether the aggregated score is rising (accelerating trend) or falling (momentum fading), supplementing the main oscillator.
7. Compact Dashboard: A corner table lists each check’s status (“Bull”, “Bear”, “Flat” or “Disabled”), plus overall Score, Confidence %, Regime, Trend Strength label, and a gauge bar. Users can scale text size (Normal, Small, Tiny) without removing elements, so the full picture remains visible even in compact layouts.
8. Customizable & Transparent: All components can be enabled/disabled and parameterized (lengths, thresholds, weights). The full Pine code is open and well-commented, letting users inspect or adapt the logic.
9. Alert-ready: Built-in alert conditions fire when the score crosses weak thresholds to bullish/bearish or returns to neutral, enabling timely notifications.
________________________________________
## 3. Component Rationale (“Why These Specific Indicators?”)
Each sub-component was chosen because it adds complementary information about trend or momentum:
1. EMA Cross
o Basic trend measure: compares a faster EMA vs. a slower EMA. Quickly reflects trend shifts but by itself can whipsaw in sideways markets.
2. VWMA Momentum
o Volume-weighted moving average change indicates momentum with volume context. By normalizing (dividing by a recent average absolute change), we capture the strength of momentum relative to recent history. This scaling prevents tiny moves from dominating and highlights genuinely strong momentum.
3. Volume Spikes
o Sudden jumps in volume combined with price movement often accompany stronger moves or reversals. A binary detection (+1 for bullish spike, -1 for bearish spike) flags high-conviction bars.
4. ATR Breakout
o Detects price breaking beyond recent highs/lows by a multiple of ATR. Measures breakout strength by how far beyond the threshold price moves relative to ATR, capped to avoid extreme outliers. This gives a volatility-contextual trend signal.
5. Higher-Timeframe EMA Alignment
o Confirms whether the shorter-term trend aligns with a higher timeframe trend. Uses request.security with lookahead_off to avoid future data. When multiple timeframes agree, confidence in direction increases.
6. ADX Regime Filter (Manual Calculation)
o Computes directional movement (+DM/–DM), smoothes via RMA, computes DI+ and DI–, then a DX and ADX-like value. If ADX ≥ threshold, market is “Trending” and trend components carry full weight; if ADX < threshold, “Ranging” mode applies a configurable weight multiplier (e.g., 0.5) to trend-based contributions, reducing false signals in sideways conditions. Volume spikes remain binary (optional behavior; can be adjusted if desired).
7. RSI Pivot-Divergence Penalty
o Uses ta.pivothigh / ta.pivotlow with a lookback to detect pivot highs/lows on price and corresponding RSI values. When price makes a higher high but RSI makes a lower high (bearish divergence), or price makes a lower low but RSI makes a higher low (bullish divergence), a divergence signal is set. Rather than flipping the trend outright, the indicator subtracts (or adds) a small penalty (configurable) from the aggregated score if it would weaken the current bias. This subtle adjustment warns of weakening momentum without overreacting to noise.
8. Confidence Meter
o Counts how many enabled components currently agree in direction with the aggregated score (i.e., component sign × score sign > 0). Displays this as a percentage. A high percentage indicates strong corroboration; a low percentage warns of mixed signals.
9. Δ Score Momentum View
o Plots the bar-to-bar change in the aggregated score (delta_score = score - score ) as a histogram. When positive, bars are drawn in green above zero; when negative, bars are drawn in red below zero. This reveals acceleration (rising Δ) or deceleration (falling Δ), supplementing the main oscillator.
10. Dashboard
• A table in the indicator pane’s top-right with 11 rows:
1. EMA Cross status
2. VWMA Momentum status
3. Volume Spike status
4. ATR Breakout status
5. Higher-Timeframe Trend status
6. Score (numeric)
7. Confidence %
8. Regime (“Trending” or “Ranging”)
9. Trend Strength label (e.g., “Weak Bullish Trend”, “Strong Bearish Trend”)
10. Gauge bar visually representing score magnitude
• All rows always present; size_opt (Normal, Small, Tiny) only changes text size via text_size, not which elements appear. This ensures full transparency.
________________________________________
## 4. What Makes This Indicator Stand Out
• Regime-Weighted Multi-Factor Score: Trend and momentum signals are adaptively weighted by market regime (trending vs. ranging) , reducing false signals.
• Magnitude Scaling: VWMA and ATR breakout contributions are normalized by recent average momentum or ATR, giving finer gradation compared to simple ±1.
• Integrated Divergence Penalty: Divergence directly adjusts the aggregated score rather than appearing as a separate subplot; this influences alerts and trend labeling in real time.
• Confidence Meter: Shows the percentage of sub-signals in agreement, providing transparency and preventing blind trust in a single metric.
• Δ Score Histogram Momentum View: A histogram highlights acceleration or deceleration of the aggregated trend score, helping detect shifts early.
• Flexible Dashboard: Always-visible component statuses and summary metrics in one place; text size scaling keeps the full picture available in cramped layouts.
• Lookahead-Safe HTF Confirmation: Uses lookahead_off so no future data is accessed from higher timeframes, avoiding repaint bias.
• Repaint Transparency: Divergence detection uses pivot functions that inherently confirm only after lookback bars; description documents this lag so users understand how and when divergence labels appear.
• Open-Source & Educational: Full, well-commented Pine v6 code is provided; users can learn from its structure: manual ADX computation, conditional plotting with series = show ? value : na, efficient use of table.new in barstate.islast, and grouped inputs with tooltips.
• Compliance-Conscious: All plots have descriptive titles; inputs use clear names; no unnamed generic “Plot” entries; manual ADX uses RMA; all request.security calls use lookahead_off. Code comments mention repaint behavior and limitations.
________________________________________
## 5. Recommended Timeframes & Tuning
• Any Timeframe: The indicator works on small (e.g., 1m) to large (daily, weekly) timeframes. However:
o On very low timeframes (<1m or tick charts), noise may produce frequent whipsaws. Consider increasing smoothing lengths, disabling certain components (e.g., volume spike if volume data noisy), or using a larger pivot lookback for divergence.
o On higher timeframes (daily, weekly), consider longer lookbacks for ATR breakout or divergence, and set Higher-Timeframe trend appropriately (e.g., 4H HTF when on 5 Min chart).
• Defaults & Experimentation: Default input values are chosen to be balanced for many liquid markets. Users should test with replay or historical analysis on their symbol/timeframe and adjust:
o ADX threshold (e.g., 20–30) based on instrument volatility.
o VWMA and ATR scaling lengths to match average volatility cycles.
o Pivot lookback for divergence: shorter for faster markets, longer for slower ones.
• Combining with Other Analysis: Use in conjunction with price action, support/resistance, candlestick patterns, order flow, or other tools as desired. The aggregated score and alerts can guide attention but should not be the sole decision-factor.
________________________________________
## 6. How Scoring and Logic Works (Step-by-Step)
1. Compute Sub-Scores
o EMA Cross: Evaluate fast EMA > slow EMA ? +1 : fast EMA < slow EMA ? -1 : 0.
o VWMA Momentum: Calculate vwma = ta.vwma(close, length), then vwma_mom = vwma - vwma . Normalize: divide by recent average absolute momentum (e.g., ta.sma(abs(vwma_mom), lookback)), clip to .
o Volume Spike: Compute vol_SMA = ta.sma(volume, len). If volume > vol_SMA * multiplier AND price moved up ≥ threshold%, assign +1; if moved down ≥ threshold%, assign -1; else 0.
o ATR Breakout: Determine recent high/low over lookback. If close > high + ATR*mult, compute distance = close - (high + ATR*mult), normalize by ATR, cap at a configured maximum. Assign positive contribution. Similarly for bearish breakout below low.
o Higher-Timeframe Trend: Use request.security(..., lookahead=barmerge.lookahead_off) to fetch HTF EMAs; assign +1 or -1 based on alignment.
2. ADX Regime Weighting
o Compute manual ADX: directional movements (+DM, –DM), smoothed via RMA, DI+ and DI–, then DX and ADX via RMA. If ADX ≥ threshold, market is considered “Trending”; otherwise “Ranging.”
o If trending, trend-based contributions (EMA, VWMA, ATR, HTF) use full weight = 1.0. If ranging, use weight = ranging_weight (e.g., 0.5) to down-weight them. Volume spike stays binary ±1 (optional to change if desired).
3. Aggregate Raw Score
o Sum weighted contributions of all enabled components. Count the number of enabled components; if zero, default count = 1 to avoid division by zero.
4. Divergence Penalty
o Detect pivot highs/lows on price and corresponding RSI values, using a lookback. When price and RSI diverge (bearish or bullish divergence), check if current raw score is in the opposing direction:
If bearish divergence (price higher high, RSI lower high) and raw score currently positive, subtract a penalty (e.g., 0.5).
If bullish divergence (price lower low, RSI higher low) and raw score currently negative, add a penalty.
o This reduces score magnitude to reflect weakening momentum, without flipping the trend outright.
5. Normalize and Smooth
o Normalized score = (raw_score / number_of_enabled_components) * 100. This yields a roughly range.
o Optional EMA smoothing of this normalized score to reduce noise.
6. Interpretation
o Sign: >0 = net bullish bias; <0 = net bearish bias; near zero = neutral.
o Magnitude Zones: Compare |score| to thresholds (Weak, Medium, Strong) to label trend strength (e.g., “Weak Bullish Trend”, “Medium Bearish Trend”, “Strong Bullish Trend”).
o Δ Score Histogram: The histogram bars from zero show change from previous bar’s score; positive bars indicate acceleration, negative bars indicate deceleration.
o Confidence: Percentage of sub-indicators aligned with the score’s sign.
o Regime: Indicates whether trend-based signals are fully weighted or down-weighted.
________________________________________
## 7. Oscillator Plot & Visualization: How to Read It
Main Score Line & Area
The oscillator plots the aggregated score as a line, with colored fill: green above zero for bullish area, red below zero for bearish area. Horizontal reference lines at ±Weak, ±Medium, and ±Strong thresholds mark zones: crossing above +Weak suggests beginning of bullish bias, above +Medium for moderate strength, above +Strong for strong trend; similarly for bearish below negative thresholds.
Δ Score Histogram
If enabled, a histogram shows score - score . When positive, bars appear in green above zero, indicating accelerating bullish momentum; when negative, bars appear in red below zero, indicating decelerating or reversing momentum. The height of each bar reflects the magnitude of change in the aggregated score from the prior bar.
Divergence Highlight Fill
If enabled, when a pivot-based divergence is confirmed:
• Bullish Divergence : fill the area below zero down to –Weak threshold in green, signaling potential reversal from bearish to bullish.
• Bearish Divergence : fill the area above zero up to +Weak threshold in red, signaling potential reversal from bullish to bearish.
These fills appear with a lag equal to pivot lookback (the number of bars needed to confirm the pivot). They do not repaint after confirmation, but users must understand this lag.
Trend Direction Label
When score crosses above or below the Weak threshold, a small label appears near the score line reading “Bullish” or “Bearish.” If the score returns within ±Weak, the label “Neutral” appears. This helps quickly identify shifts at the moment they occur.
Dashboard Panel
In the indicator pane’s top-right, a table shows:
1. EMA Cross status: “Bull”, “Bear”, “Flat”, or “Disabled”
2. VWMA Momentum status: similarly
3. Volume Spike status: “Bull”, “Bear”, “No”, or “Disabled”
4. ATR Breakout status: “Bull”, “Bear”, “No”, or “Disabled”
5. Higher-Timeframe Trend status: “Bull”, “Bear”, “Flat”, or “Disabled”
6. Score: numeric value (rounded)
7. Confidence: e.g., “80%” (colored: green for high, amber for medium, red for low)
8. Regime: “Trending” or “Ranging” (colored accordingly)
9. Trend Strength: textual label based on magnitude (e.g., “Medium Bullish Trend”)
10. Gauge: a bar of blocks representing |score|/100
All rows remain visible at all times; changing Dashboard Size only scales text size (Normal, Small, Tiny).
________________________________________
## 8. Example Usage (Illustrative Scenario)
Example: BTCUSD 5 Min
1. Setup: Add “Trend Gauge ” to your BTCUSD 5 Min chart. Defaults: EMAs (8/21), VWMA 14 with lookback 3, volume spike settings, ATR breakout 14/5, HTF = 5m (or adjust to 4H if preferred), ADX threshold 25, ranging weight 0.5, divergence RSI length 14 pivot lookback 5, penalty 0.5, smoothing length 3, thresholds Weak=20, Medium=50, Strong=80. Dashboard Size = Small.
2. Trend Onset: At some point, price breaks above recent high by ATR multiple, volume spikes upward, faster EMA crosses above slower EMA, HTF EMA also bullish, and ADX (manual) ≥ threshold → aggregated score rises above +20 (Weak threshold) into +Medium zone. Dashboard shows “Bull” for EMA, VWMA, Vol Spike, ATR, HTF; Score ~+60–+70; Confidence ~100%; Regime “Trending”; Trend Strength “Medium Bullish Trend”; Gauge ~6–7 blocks. Δ Score histogram bars are green and rising, indicating accelerating bullish momentum. Trader notes the alignment.
3. Divergence Warning: Later, price makes a slightly higher high but RSI fails to confirm (lower RSI high). Pivot lookback completes; the indicator highlights a bearish divergence fill above zero and subtracts a small penalty from the score, causing score to stall or retrace slightly. Dashboard still bullish but score dips toward +Weak. This warns the trader to tighten stops or take partial profits.
4. Trend Weakens: Score eventually crosses below +Weak back into neutral; a “Neutral” label appears, and a “Neutral Trend” alert fires if enabled. Trader exits or avoids new long entries. If score subsequently crosses below –Weak, a “Bearish” label and alert occur.
5. Customization: If the trader finds VWMA noise too frequent on this instrument, they may disable VWMA or increase lookback. If ATR breakouts are too rare, adjust ATR length or multiplier. If ADX threshold seems off, tune threshold. All these adjustments are explained in Inputs section.
6. Visualization: The screenshot shows the main score oscillator with colored areas, reference lines at ±20/50/80, Δ Score histogram bars below/above zero, divergence fill highlighting potential reversal, and the dashboard table in the top-right.
________________________________________
## 9. Inputs Explanation
A concise yet clear summary of inputs helps users understand and adjust:
1. General Settings
• Theme (Dark/Light): Choose background-appropriate colors for the indicator pane.
• Dashboard Size (Normal/Small/Tiny): Scales text size only; all dashboard elements remain visible.
2. Indicator Settings
• Enable EMA Cross: Toggle on/off basic EMA alignment check.
o Fast EMA Length and Slow EMA Length: Periods for EMAs.
• Enable VWMA Momentum: Toggle VWMA momentum check.
o VWMA Length: Period for VWMA.
o VWMA Momentum Lookback: Bars to compare VWMA to measure momentum.
• Enable Volume Spike: Toggle volume spike detection.
o Volume SMA Length: Period to compute average volume.
o Volume Spike Multiplier: How many times above average volume qualifies as spike.
o Min Price Move (%): Minimum percent change in price during spike to qualify as bullish or bearish.
• Enable ATR Breakout: Toggle ATR breakout detection.
o ATR Length: Period for ATR.
o Breakout Lookback: Bars to look back for recent highs/lows.
o ATR Multiplier: Multiplier for breakout threshold.
• Enable Higher Timeframe Trend: Toggle HTF EMA alignment.
o Higher Timeframe: E.g., “5” for 5-minute when on 1-minute chart, or “60” for 5 Min when on 15m, etc. Uses lookahead_off.
• Enable ADX Regime Filter: Toggles regime-based weighting.
o ADX Length: Period for manual ADX calculation.
o ADX Threshold: Value above which market considered trending.
o Ranging Weight Multiplier: Weight applied to trend components when ADX < threshold (e.g., 0.5).
• Scale VWMA Momentum: Toggle normalization of VWMA momentum magnitude.
o VWMA Mom Scale Lookback: Period for average absolute VWMA momentum.
• Scale ATR Breakout Strength: Toggle normalization of breakout distance by ATR.
o ATR Scale Cap: Maximum multiple of ATR used for breakout strength.
• Enable Price-RSI Divergence: Toggle divergence detection.
o RSI Length for Divergence: Period for RSI.
o Pivot Lookback for Divergence: Bars on each side to identify pivot high/low.
o Divergence Penalty: Amount to subtract/add to score when divergence detected (e.g., 0.5).
3. Score Settings
• Smooth Score: Toggle EMA smoothing of normalized score.
• Score Smoothing Length: Period for smoothing EMA.
• Weak Threshold: Absolute score value under which trend is considered weak or neutral.
• Medium Threshold: Score above Weak but below Medium is moderate.
• Strong Threshold: Score above this indicates strong trend.
4. Visualization Settings
• Show Δ Score Histogram: Toggle display of the bar-to-bar change in score as a histogram. Default true.
• Show Divergence Fill: Toggle background fill highlighting confirmed divergences. Default true.
Each input has a tooltip in the code.
________________________________________
## 10. Limitations, Repaint Notes, and Disclaimers
10.1. Repaint & Lag Considerations
• Pivot-Based Divergence Lag: The divergence detection uses ta.pivothigh / ta.pivotlow with a specified lookback. By design, a pivot is only confirmed after the lookback number of bars. As a result:
o Divergence labels or fills appear with a delay equal to the pivot lookback.
o Once the pivot is confirmed and the divergence is detected, the fill/label does not repaint thereafter, but you must understand and accept this lag.
o Users should not treat divergence highlights as predictive signals without additional confirmation, because they appear after the pivot has fully formed.
• Higher-Timeframe EMA Alignment: Uses request.security(..., lookahead=barmerge.lookahead_off), so no future data from the higher timeframe is used. This avoids lookahead bias and ensures signals are based only on completed higher-timeframe bars.
• No Future Data: All calculations are designed to avoid using future information. For example, manual ADX uses RMA on past data; security calls use lookahead_off.
10.2. Market & Noise Considerations
• In very choppy or low-liquidity markets, some components (e.g., volume spikes or VWMA momentum) may be noisy. Users can disable or adjust those components’ parameters.
• On extremely low timeframes, noise may dominate; consider smoothing lengths or disabling certain features.
• On very high timeframes, pivots and breakouts occur less frequently; adjust lookbacks accordingly to avoid sparse signals.
10.3. Not a Standalone Trading System
• This is an indicator, not a complete trading strategy. It provides signals and context but does not manage entries, exits, position sizing, or risk management.
• Users must combine it with their own analysis, money management, and confirmations (e.g., price patterns, support/resistance, fundamental context).
• No guarantees: past behavior does not guarantee future performance.
10.4. Disclaimers
• Educational Purposes Only: The script is provided as-is for educational and informational purposes. It does not constitute financial, investment, or trading advice.
• Use at Your Own Risk: Trading involves risk of loss. Users should thoroughly test and use proper risk management.
• No Guarantees: The author is not responsible for trading outcomes based on this indicator.
• License: Published under Mozilla Public License 2.0; code is open for viewing and modification under MPL terms.
________________________________________
## 11. Alerts
• The indicator defines three alert conditions:
1. Bullish Trend: when the aggregated score crosses above the Weak threshold.
2. Bearish Trend: when the score crosses below the negative Weak threshold.
3. Neutral Trend: when the score returns within ±Weak after being outside.
Good luck
– BullByte

Daily Percent Change LabelDaily Percent Change Label
Overview
This Pine Script displays the percentage change from the previous day's closing price as a text label near the current price level on the chart. It works seamlessly across any timeframe (daily, hourly, minute charts) by referencing the daily chart's previous close, making it perfect for traders tracking daily performance.
The label is displayed with a semi-transparent background (green for positive changes, red for negative changes) and white text, ensuring a clean and readable appearance.
Features
Accurate Daily Percent Change: Calculates the percentage change based on the previous day's closing price, even on intraday timeframes (e.g., 1-hour, 5-minute).
Dynamic Label: Shows the percentage change as a label aligned with the current price, updating in real-time.
Color-Coded Background: Semi-transparent green background for positive changes and red for negative changes.
Customizable: Adjust label position, size, color, and style to fit your preferences.
Minimal Impact: No additional plots or graphs, keeping the chart uncluttered.
How to Use
Add the Script:
Copy and paste the script into the Pine Editor in TradingView.
Click "Add to Chart" to apply it.
Check the Output:
A text label (e.g., "+2.34%" or "-1.56%") appears near the current price with a semi-transparent background.
The label is colored green (positive) or red (negative) and updates in real-time.
Switch Timeframes:
Works on any timeframe. The percentage change is always calculated relative to the previous day's close.
Customization Options
Modify the label.new function to customize the label:
Label Position:
Change style=label.style_label_left to label.style_label_right or label.style_label_down to adjust label placement.
Adjust bar_index with an offset (e.g., bar_index + 1) to move the label horizontally.
Text Color:
Modify textcolor=color.white to another color (e.g., color.rgb(255, 255, 0) for yellow).
Background Color:
Adjust color=percent_change >= 0 ? color.new(color.green, 50) : color.new(color.red, 50) to change transparency (e.g., color.new(color.green, 0) for no transparency).
Text Size:
Change size=size.normal to size.small or size.large for smaller or larger text.
Code Details
Timeframe Handling: Uses request.security with the "D" timeframe to fetch the previous day's closing price, ensuring accuracy on intraday charts.
Performance: Updates only on the last bar (barstate.islast) for optimal performance.
Dynamic Styling: Background color changes based on the direction of the price change.
Notes
The label is positioned near the current price for easy reference. To move it closer to the Y-axis, adjust the bar_index offset.
For different reference points (e.g., weekly close), modify the request.security timeframe (e.g., "W" for weekly).
Ensure the script is copied correctly without extra spaces or characters. Use a plain text editor (e.g., Notepad) for copying.
Feedback
Please share your feedback or customizations in the comments! If you find this script helpful, give it a thumbs-up or let others know how you're using it. Happy trading!
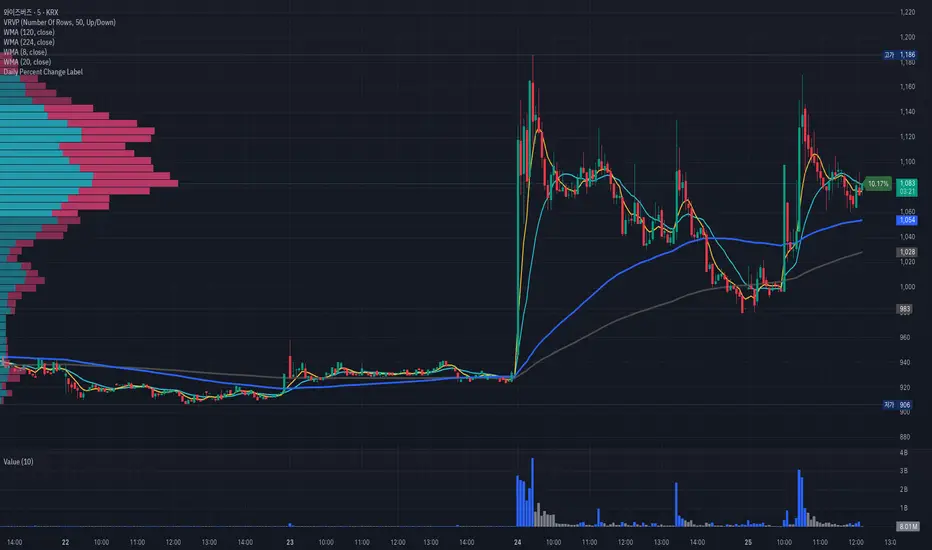
Ribbit RangesBounce Around Multiple
(Open, High, Low, Close) Ranges
On Pre/Post Market & (Daily, Weekly,
Monthly, Yearly) Sessions With
Meticulous Lines, Labels, Tooltips,
Colors, Custom Ideas, and Alerts.
Sessions Use Two Step Incremental Values
Default Value: (1) Shows Two Previous
(O, H, L, C); Increasing Value Swaps
Sessions With Next Two Ranges.
⬛️ KEY WORDS:
🟢 Crossover | 🔴 Crossunder
📗 High | 📕 Low
📔 Open | 📓 Close
🥇 First Idea | 🥈 Second Idea
🥉 Third Idea | 🎖️ Fourth Idea
🟥 ALERTS:
Default Option: (Per Bar)
Alerts Once Conditions Are Met
(Bar Close) Alerts When Bar Closes
Default Option: (Reg)
Alerts During Regular Market
Trading Hours, (0930-1600)
(Ext) Alerts During Extended
Market Hours, (1600-0930)
(24/7) Alerts All Day
Optional Preferences:
Regular Alerts - Stocks
Extended Alerts - Futures
24/7 Alerts - Crypto
🟧 RANGES:
Default Value: (1)
Incremental Range Value, Increasing Value
Swaps Sessions With the Next Two Ranges
(✓) Swap Ranges?
Pre/Post Market High/Lows,
1-2 Day High/Lows, 1-2 Week High/Lows,
1-2 Month High/Lows, 1-2 Year High/Lows
( ) Swap Ranges?
Pre/Post Market Open/Close,
1-2 Day Open/Close, 1-2 Week Open/Close,
1-2 Month Open/Close, 1-2 Year Open/Close
🟨 EXAMPLES:
Default Range:
🟢 | 📗 Pre Market High (PRE) | 4600.00
🔴 | 📕 Post Market Low (POST) | 420.00
Optional: (Open)
🟢 | 📔 Post Market Open (POST) | 4400.00
Optional: (Close)
🔴 | 📓 Pre Market Close (PRE) | 430.00
Default Range Value: (1)
🔴 | 📗 1 Day High (1DH) | 460.00
Next Range Value: (3)
🟢 | 📕 4 Day Low (4DL) | 420.00
Optional: (Open)
🔴 | 📔 2 Day Open (2DO) | 440.00
Optional: (Close)
🟢 | 📓 3 Day Close (3DC) | 430.00
Default Range Value: (5)
🟢 | 📗 5 Week High (5WH) | 460.00
Next Range Value: (7)
🔴 | 📕 8 Week Low (8WL) | 420.00
Optional: (Open)
🔴 | 📔 7 Week Open (7WO) | 4400.00
Optional: (Close)
🟢 | 📓 6 Week Close (6WC) | 430.00
Default Range Value: (9)
🔴 | 📗 9 Month High (9MH) | 460.00
Next Range Value: (11)
🟢 | 📕 12 Month Low (12ML) | 420.00
Optional: (Open)
🟢 | 📔 11 Month Open (11MO) | 4400.00
Optional: (Close)
🔴 | 📓 10 Month Close (10MC) | 430.00
Default Range Value: (13)
🟢 | 📗 13 Year High (13YH) | 460.00
Next Range Value: (15)
🟢 | 📕 16 Year Low (16YL) | 420.00
Optional: (Open)
🔴 | 📔 15 Year Open (15YO) | 4400.00
Optional: (Close)
🔴 | 📓 14 Year Close (14YC) | 430.00
🟩 COLORS:
(✓) Swap Colors?
Text Color Is Shown Using
Background Color
( ) Swap Colors?
Background Color Is Shown
Using Text Color
🟦 IDEAS:
(✓) Show Ideas?
Plots Four Ideas With Custom Lines
and Labels; Ideas Are Based Around
Post-It Note Reminders with Alerts
Suggestions For Text Ideas:
Take Profit, Stop Loss, Trim, Hold,
Long, Short, Bounce Spot, Retest,
Chop, Support, Resistance, Buy, Sell
🟪 EXAMPLES:
Default Value: (5)
Shows the Custom Value For
Lines, Labels, and Alerts
Default Text: (🥇)
Shown On First Label and
Message Appearing On Alerts
Alert Shows: 🟢 | 🥇 | 5.00
Default Value: (10)
Shows the Custom Value For
Lines, Labels, and Alerts
Default Text: (🥈)
Shown On Second Label and
Message Appearing On Alerts
Alert Shows: 🔴 | 🥈 | 10.00
Default Value: (50)
Shows the Custom Value For
Lines, Labels, and Alerts
Default Text: (🥉)
Shown On Third Label and
Message Appearing On Alerts
Alert Shows: 🟢 | 🥉 | 50.00
Default Value: (100)
Shows the Custom Value For
Lines, Labels, and Alerts
Default Text: (🎖️)
Shown On Fourth Label and
Message Appearing On Alerts
Alert Shows: 🔴 | 🎖️ | 100.00
⬛️ REFERENCES:
Pre-market Highs & Lows on regular
trading hours (RTH) chart
By Twingall
Previous Day Week Highs & Lows
By Sbtnc
Screener for 40+ instruments
By QuantNomad
Daily Weekly Monthly Yearly Opens
By Meliksah55

libhs.log.DEMO◼ Overview
This is a demonstration of dual logging library I have ported from my personal use for public use. Please start bar replay from Bar#4, and progress automatically slowly or manually.You would need to go through 450+ bars to see the full capability.
Logger=A dual logging library for developers. Tradingview lacks logging capability. This library provided logging while developing your scripts and is to be used by developers when developing and debugging their scripts.
Using this library would potentially slow down you scripts. Hence, use this for debugging only. Once your code is as you would like it to be, remove the logging code.
◼︎ Usage (Console):
Console = A sleek single cell logging with a limit of 4096 characters. When you dont need a large logging capability.
//@version=5
indicator("demo.Console", overlay=true)
plot(na)
import GETpacman/log/2 as logger
var console = logger.log.new()
console.init() // init() should be called as first line after variable declaration
console.FrameColor:=color.green
console.log('\n')
console.log('\n')
console.log('Hello World')
console.log('\n')
console.log('\n')
console.ShowStatusBar:=true
console.StatusBarAtBottom:=true
console.FrameColor:=color.blue //settings can be changed anytime before show method is called. Even twice. The last call will set the final value
console.ShowHeader:=false //this wont throw error but is not used for console
console.show(position=position.bottom_right) //this should be the last line of your code, after all methods and settings have been dealt with.
◼︎ Usage (Logx):
Logx = Multiple columns logging with a limit of 4096 characters each message. When you need to log large number of messages.
//@version=5
indicator("demo.Logx", overlay=true)
plot(na)
import GETpacman/log/2 as logger
var logx = logger.log.new()
logx.init() // init() should be called as first line after variable declaration
logx.FrameColor:=color.green
logx.log('\n')
logx.log('\n')
logx.log('Hello World')
logx.log('\n')
logx.log('\n')
logx.ShowStatusBar:=true
logx.StatusBarAtBottom:=true
logx.ShowQ3:=false
logx.ShowQ4:=false
logx.ShowQ5:=false
logx.ShowQ6:=false
logx.FrameColor:=color.olive //settings can be changed anytime before show method is called. Even twice. The last call will set the final value
logx.show(position=position.top_right) //this should be the last line of your code, after all methods and settings have been dealt with.
◼︎ Fields (with default settings)
▶︎ IsConsole = True Log will act as Console if true, otherwise it will act as Logx
▶︎ ShowHeader = True (Log only) Will show a header at top or bottom of logx.
▶︎ HeaderAtTop = True (Log only) Will show the header at the top, or bottom if false, if ShowHeader is true.
▶︎ ShowStatusBar = True Will show a status bar at the bottom
▶︎ StatusBarAtBottom = True Will show the status bar at the bottom, or top if false, if ShowHeader is true.
▶︎ ShowMetaStatus = True Will show the meta info within status bar (Current Bar, characters left in console, Paging On Every Bar, Console dumped data etc)
▶︎ ShowBarIndex = True Logx will show column for Bar Index when the message was logged. Console will add Bar index at the front of logged messages
▶︎ ShowDateTime = True Logx will show column for Date/Time passed with the logged message logged. Console will add Date/Time at the front of logged messages
▶︎ ShowLogLevels = True Logx will show column for Log levels corresponding to error codes. Console will log levels in the status bar
▶︎ ReplaceWithErrorCodes = True (Log only) Logx will show error codes instead of log levels, if ShowLogLevels is switched on
▶︎ RestrictLevelsToKey7 = True Log levels will be restricted to Ley 7 codes - TRACE, DEBUG, INFO, WARNING, ERROR, CRITICAL, FATAL
▶︎ ShowQ1 = True (Log only) Show the column for Q1
▶︎ ShowQ2 = True (Log only) Show the column for Q2
▶︎ ShowQ3 = True (Log only) Show the column for Q3
▶︎ ShowQ4 = True (Log only) Show the column for Q4
▶︎ ShowQ5 = True (Log only) Show the column for Q5
▶︎ ShowQ6 = True (Log only) Show the column for Q6
▶︎ ColorText = True Log/Console will color text as per error codes
▶︎ HighlightText = True Log/Console will highlight text (like denoting) as per error codes
▶︎ AutoMerge = True (Log only) Merge the queues towards the right if there is no data in those queues.
▶︎ PageOnEveryBar = True Clear data from previous bars on each new bar, in conjuction with PageHistory setting.
▶︎ MoveLogUp = True Move log in up direction. Setting to false will push logs down.
▶︎ MarkNewBar = True On each change of bar, add a marker to show the bar has changed
▶︎ PrefixLogLevel = True (Console only) Prefix all messages with the log level corresponding to error code.
▶︎ MinWidth = 40 Set the minimum width needed to be seen. Prevents logx/console shrinking below these number of characters.
▶︎ TabSizeQ1 = 0 If set to more than one, the messages on Q1 or Console messages will indent by this size based on error code (Max 4 used)
▶︎ TabSizeQ2 = 0 If set to more than one, the messages on Q2 will indent by this size based on error code (Max 4 used)
▶︎ TabSizeQ3 = 0 If set to more than one, the messages on Q2 will indent by this size based on error code (Max 4 used)
▶︎ TabSizeQ4 = 0 If set to more than one, the messages on Q2 will indent by this size based on error code (Max 4 used)
▶︎ TabSizeQ5 = 0 If set to more than one, the messages on Q2 will indent by this size based on error code (Max 4 used)
▶︎ TabSizeQ6 = 0 If set to more than one, the messages on Q2 will indent by this size based on error code (Max 4 used)
▶︎ PageHistory = 0 Used with PageOnEveryBar. Determines how many historial pages to keep.
▶︎ HeaderQbarIndex = 'Bar#' (Logx only) The header to show for Bar Index
▶︎ HeaderQdateTime = 'Date' (Logx only) The header to show for Date/Time
▶︎ HeaderQerrorCode = 'eCode' (Logx only) The header to show for Error Codes
▶︎ HeaderQlogLevel = 'State' (Logx only) The header to show for Log Level
▶︎ HeaderQ1 = 'h.Q1' (Logx only) The header to show for Q1
▶︎ HeaderQ2 = 'h.Q2' (Logx only) The header to show for Q2
▶︎ HeaderQ3 = 'h.Q3' (Logx only) The header to show for Q3
▶︎ HeaderQ4 = 'h.Q4' (Logx only) The header to show for Q4
▶︎ HeaderQ5 = 'h.Q5' (Logx only) The header to show for Q5
▶︎ HeaderQ6 = 'h.Q6' (Logx only) The header to show for Q6
▶︎ Status = '' Set the status to this text.
▶︎ HeaderColor Set the color for the header
▶︎ HeaderColorBG Set the background color for the header
▶︎ StatusColor Set the color for the status bar
▶︎ StatusColorBG Set the background color for the status bar
▶︎ TextColor Set the color for the text used without error code or code 0.
▶︎ TextColorBG Set the background color for the text used without error code or code 0.
▶︎ FrameColor Set the color for the frame around Logx/Console
▶︎ FrameSize = 1 Set the size of the frame around Logx/Console
▶︎ CellBorderSize = 0 Set the size of the border around cells.
▶︎ CellBorderColor Set the color for the border around cells within Logx/Console
▶︎ SeparatorColor = gray Set the color of separate in between Console/Logx Attachment
◼︎ Methods (summary)
● init ▶︎ Initialise the log
● log ▶︎ Log the messages. Use method show to display the messages
● page ▶︎ Clear messages from previous bar while logging messages on this bar.
● show ▶︎ Shows a table displaying the logged messages
● clear ▶︎ Clears the log of all messages
● resize ▶︎ Resizes the log. If size is for reduction then oldest messages are lost first.
● turnPage ▶︎ When called, all messages marked with previous page, or from start are cleared
● dateTimeFormat ▶︎ Sets the date time format to be used when displaying date/time info.
● resetTextColor ▶︎ Reset Text Color to library default
● resetTextBGcolor ▶︎ Reset Text BG Color to library default
● resetHeaderColor ▶︎ Reset Header Color to library default
● resetHeaderBGcolor ▶︎ Reset Header BG Color to library default
● resetStatusColor ▶︎ Reset Status Color to library default
● resetStatusBGcolor ▶︎ Reset Status BG Color to library default
● setColors ▶︎ Sets the colors to be used for corresponding error codes
● setColorsBG ▶︎ Sets the background colors to be used for corresponding error codes. If not match of error code, then text color used.
● setColorsHC ▶︎ Sets the highlight colors to be used for corresponding error codes.If not match of error code, then text bg color used.
● resetColors ▶︎ Reset the colors to library default (Total 36, not including error code 0)
● resetColorsBG ▶︎ Reset the background colors to library default
● resetColorsHC ▶︎ Reset the highlight colors to library default
● setLevelNames ▶︎ Set the log level names to be used for corresponding error codes. If not match of error code, then empty string used.
● resetLevelNames ▶︎ Reset the log level names to library default. (Total 36) 1=TRACE, 2=DEBUG, 3=INFO, 4=WARNING, 5=ERROR, 6=CRITICAL, 7=FATAL
● attach ▶︎ Attaches a console to an existing Logx, allowing to have dual logging system independent of each other
● detach ▶︎ Detaches an already attached console from Logx
920 Order Flow SATY ATR//@version=6
indicator("Order-Flow / Volume Signals (No L2)", overlay=true)
//======================
// Inputs
//======================
rvolLen = input.int(20, "Relative Volume Lookback", minval=5)
rvolMin = input.float(1.1, "Min Relative Volume (× avg)", step=0.1)
wrbLen = input.int(20, "Wide-Range Lookback", minval=5)
wrbMult = input.float(1, "Wide-Range Multiplier", step=0.1)
upperCloseQ = input.float(0.60, "Close near High (0-1)", minval=0.0, maxval=1.0)
lowerCloseQ = input.float(0.40, "Close near Low (0-1)", minval=0.0, maxval=1.0)
cdLen = input.int(25, "Rolling CumDelta Window", minval=5)
useVWAP = input.bool(true, "Use VWAP Bias Filter")
showSignals = input.bool(true, "Show Long/Short OF Triangles")
//======================
// Core helpers
//======================
rng = high - low
tr = ta.tr(true)
avgTR = ta.sma(tr, wrbLen)
wrb = rng > wrbMult * avgTR
// Relative Volume
volAvg = ta.sma(volume, rvolLen)
rvol = volAvg > 0 ? volume / volAvg : 0.0
// Close location in bar (0..1)
clo = rng > 0 ? (close - low) / rng : 0.5
// VWAP (session) + SMAs
vwap = ta.vwap(close)
sma9 = ta.sma(close, 9)
sma20 = ta.sma(close, 20)
sma200= ta.sma(close, 200)
// CumDelta proxy (uptick/downtick signed volume)
tickSign = close > close ? 1.0 : close < close ? -1.0 : 0.0
delta = volume * tickSign
cumDelta = ta.cum(delta)
rollCD = cumDelta - cumDelta
//======================
// Signal conditions
//======================
volActive = rvol >= rvolMin
effortBuy = wrb and clo >= upperCloseQ
effortSell = wrb and clo <= lowerCloseQ
cdUp = ta.crossover(rollCD, 0)
cdDown = ta.crossunder(rollCD, 0)
biasBuy = not useVWAP or close > vwap
biasSell = not useVWAP or close < vwap
longOF = barstate.isconfirmed and volActive and effortBuy and cdUp and biasBuy
shortOF = barstate.isconfirmed and volActive and effortSell and cdDown and biasSell
//======================
// Plot ONLY on price chart
//======================
// SMAs & VWAP
plot(sma9, title="9 SMA", color=color.orange, linewidth=3)
plot(sma20, title="20 SMA", color=color.white, linewidth=3)
plot(sma200, title="200 SMA", color=color.black, linewidth=3)
plot(vwap, title="VWAP", color=color.new(color.aqua, 0), linewidth=3)
// Triangles with const text (no extra pane)
plotshape(showSignals and longOF, title="LONG OF",
style=shape.triangleup, location=location.belowbar, size=size.tiny,
color=color.new(color.green, 0), text="LONG OF")
plotshape(showSignals and shortOF, title="SHORT OF",
style=shape.triangledown, location=location.abovebar, size=size.tiny,
color=color.new(color.red, 0), text="SHORT OF")
// Alerts
alertcondition(longOF, title="LONG OF confirmed", message="LONG OF confirmed")
alertcondition(shortOF, title="SHORT OF confirmed", message="SHORT OF confirmed")
//────────────────────────────
// End-of-line labels (offset to the right)
//────────────────────────────
var label label9 = na
var label label20 = na
var label label200 = na
var label labelVW = na
if barstate.islast
// delete old labels before drawing new ones
label.delete(label9)
label.delete(label20)
label.delete(label200)
label.delete(labelVW)
// how far to move the labels rightward (increase if needed)
offsetBars = input.int(3)
label9 := label.new(bar_index + offsetBars, sma9, "9 SMA", style=label.style_label_left, textcolor=color.white, color=color.new(color.orange, 0))
label20 := label.new(bar_index + offsetBars, sma20, "20 SMA", style=label.style_label_left, textcolor=color.black, color=color.new(color.white, 0))
label200 := label.new(bar_index + offsetBars, sma200, "200 SMA", style=label.style_label_left, textcolor=color.white, color=color.new(color.black, 0))
labelVW := label.new(bar_index + offsetBars, vwap, "VWAP", style=label.style_label_left, textcolor=color.black, color=color.new(color.aqua, 0))
//────────────────────────────────────────────────────────────────────
//────────────────────────────────────────────
// Overnight High/Low + HOD/LOD (no POC)
//────────────────────────────────────────────
sessionRTH = input.session("0930-1600", "RTH Session (exchange tz)")
levelWidth = input.int(2, "HL line width", minval=1, maxval=5)
labelOffsetH = input.int(10, "HL label offset (bars to right)", minval=0)
isRTH = not na(time(timeframe.period, sessionRTH))
rthOpen = isRTH and not isRTH
// --- Track Overnight High/Low during NON-RTH; freeze at RTH open
// --- Track Overnight High/Low during NON-RTH; freeze at RTH open
var float onHigh = na
var float onLow = na
var int onHighBar = na
var int onLowBar = na
var float onHighFix = na
var float onLowFix = na
var int onHighFixBar = na
var int onLowFixBar = na
if not isRTH
if na(onHigh) or high > onHigh
onHigh := high
onHighBar := bar_index
if na(onLow) or low < onLow
onLow := low
onLowBar := bar_index
if rthOpen
onHighFix := onHigh
onLowFix := onLow
onHighFixBar := onHighBar
onLowFixBar := onLowBar
onHigh := na, onLow := na
onHighBar := na, onLowBar := na
// ──────────────────────────────────────────
// Candle coloring + labels for 9/20/VWAP crosses
// ──────────────────────────────────────────
showCrossLabels = input.bool(true, "Show cross labels")
// Helpers
minAll = math.min(math.min(sma9, sma20), vwap)
maxAll = math.max(math.max(sma9, sma20), vwap)
// All three lines
goldenAll = open <= minAll and close >= maxAll
deathAll = open >= maxAll and close <= minAll
// 9/20 only (exclude cases that also crossed VWAP)
dcUpOnly = open <= math.min(sma9, sma20) and close >= math.max(sma9, sma20) and not goldenAll
dcDownOnly = open >= math.max(sma9, sma20) and close <= math.min(sma9, sma20) and not deathAll
// Candle colors (priority: all three > 9/20 only)
var color cCol = na
cCol := goldenAll ? color.yellow : deathAll ? color.black :dcUpOnly ? color.lime :dcDownOnly ? color.red : na
barcolor(cCol)
// Labels
plotshape(showCrossLabels and barstate.isconfirmed and goldenAll, title="GOLDEN CROSS",
style=shape.labelup, location=location.belowbar, text="GOLDEN CROSS",
color=color.new(color.yellow, 0), textcolor=color.black, size=size.tiny)
plotshape(showCrossLabels and barstate.isconfirmed and deathAll, title="DEATH CROSS",
style=shape.labeldown, location=location.abovebar, text="DEATH CROSS",
color=color.new(color.black, 0), textcolor=color.white, size=size.tiny)
plotshape(showCrossLabels and barstate.isconfirmed and dcUpOnly, title="DC UP",
style=shape.labelup, location=location.belowbar, text="DC UP",
color=color.new(color.lime, 0), textcolor=color.black, size=size.tiny)
plotshape(showCrossLabels and barstate.isconfirmed and dcDownOnly, title="DC DOWN",
style=shape.labeldown, location=location.abovebar, text="DC DOWN",
color=color.new(color.red, 0), textcolor=color.white, size=size.tiny)
// ──────────────────────────────────────────
// Audible + alert conditions
// ──────────────────────────────────────────
alertcondition(goldenAll, title="GOLDEN CROSS", message="GOLDEN CROSS detected")
alertcondition(deathAll, title="DEATH CROSS", message="DEATH CROSS detected")
alertcondition(dcUpOnly, title="DC UP", message="Dual Cross UP detected")
alertcondition(dcDownOnly,title="DC DOWN", message="Dual Cross DOWN detected")

lower_tfLibrary "lower_tf"
█ OVERVIEW
This library is an enhanced (opinionated) version of the library originally developed by PineCoders contained in lower_tf .
It is a Pine Script® programming tool for advanced lower-timeframe selection and intra-bar analysis.
█ CONCEPTS
Lower Timeframe Analysis
Lower timeframe analysis refers to the analysis of price action and market microstructure using data from timeframes shorter than the current chart period. This technique allows traders and analysts to gain deeper insights into market dynamics, volume distribution, and the price movements occurring within each bar on the chart. In Pine Script®, the request.security_lower_tf() function allows this analysis by accessing intrabar data.
The library provides a comprehensive set of functions for accurate mapping of lower timeframes, dynamic precision control, and optimized historical coverage using request.security_lower_tf().
█ IMPROVEMENTS
The original library implemented ten precision levels. This enhanced version extends that to twelve levels, adding two ultra-high-precision options:
Coverage-Based Precision (Original 5 levels):
1. "Covering most chart bars (least precise)"
2. "Covering some chart bars (less precise)"
3. "Covering fewer chart bars (more precise)"
4. "Covering few chart bars (very precise)"
5. "Covering the least chart bars (most precise)"
Intrabar-Count-Based Precision (Expanded from 5 to 7 levels):
6. "~12 intrabars per chart bar"
7. "~24 intrabars per chart bar"
8. "~50 intrabars per chart bar"
9. "~100 intrabars per chart bar"
10. "~250 intrabars per chart bar"
11. "~500 intrabars per chart bar" ← NEW
12. "~1000 intrabars per chart bar" ← NEW
The key enhancements in this version include:
1. Extended Precision Range: Adds two ultra-high-precision levels (~500 and ~1000 intrabars) for advanced microstructure analysis requiring maximum granularity.
2. Market-Agnostic Implementation: Eliminates the distinction between crypto/forex and traditional markets, removing the mktFactor variable in favor of a unified, predictable approach across all asset classes.
3. Explicit Precision Mapping: Completely refactors the timeframe selection logic using native Pine Script® timeframe properties ( timeframe.isseconds , timeframe.isminutes , timeframe.isdaily , timeframe.isweekly , timeframe.ismonthly ) and explicit multiplier-based lookup tables. The original library used minute-based calculations with market-dependent conditionals that produced inconsistent results. This version provides deterministic, predictable mappings for every chart timeframe, ensuring consistent precision behavior regardless of asset type or market hours.
An example of the differences can be seen side-by-side in the chart below, where the original library is on the left and the enhanced version is on the right:
█ USAGE EXAMPLE
// This Pine Script® code is subject to the terms of the Mozilla Public License 2.0 at mozilla.org
// © andre_007
//@version=6
indicator("lower_tf Example")
import andre_007/lower_tf/1 as LTF
import PineCoders/Time/5 as PCtime
//#region ———————————————————— Example code
// ————— Constants
color WHITE = color.white
color GRAY = color.gray
string LTF1 = "Covering most chart bars (least precise)"
string LTF2 = "Covering some chart bars (less precise)"
string LTF3 = "Covering less chart bars (more precise)"
string LTF4 = "Covering few chart bars (very precise)"
string LTF5 = "Covering the least chart bars (most precise)"
string LTF6 = "~12 intrabars per chart bar"
string LTF7 = "~24 intrabars per chart bar"
string LTF8 = "~50 intrabars per chart bar"
string LTF9 = "~100 intrabars per chart bar"
string LTF10 = "~250 intrabars per chart bar"
string LTF11 = "~500 intrabars per chart bar"
string LTF12 = "~1000 intrabars per chart bar"
string TT_LTF = "This selection determines the approximate number of intrabars analyzed per chart bar. Higher numbers of
intrabars produce more granular data at the cost of less historical bar coverage, because the maximum number of
available intrabars is 200K.
\n\nThe first five options set the lower timeframe based on a specified relative level of chart bar coverage.
The last five options set the lower timeframe based on an approximate number of intrabars per chart bar."
string TAB_TXT = "Uses intrabars at the {0} timeframe.\nAvg intrabars per chart bar:
{1,number,#.#}\nChart bars covered: {2} of {3} ({4,number,#.##}%)"
string ERR_TXT = "No intrabar information exists at the {1}{0}{1} timeframe."
// ————— Inputs
string ltfModeInput = input.string(LTF3, "Intrabar precision", options = , tooltip = TT_LTF)
bool showInfoBoxInput = input.bool(true, "Show information box ")
string infoBoxSizeInput = input.string("normal", "Size ", inline = "01", options = )
string infoBoxYPosInput = input.string("bottom", "↕", inline = "01", options = )
string infoBoxXPosInput = input.string("right", "↔", inline = "01", options = )
color infoBoxColorInput = input.color(GRAY, "", inline = "01")
color infoBoxTxtColorInput = input.color(WHITE, "T", inline = "01")
// ————— Calculations
// @variable A "string" representing the lower timeframe for the data request.
// NOTE:
// This line is a good example where using `var` in the declaration can improve a script's performance.
// By using `var` here, the script calls `ltf()` only once, on the dataset's first bar, instead of redundantly
// evaluating unchanging strings on every bar. We only need one evaluation of this function because the selected
// timeframe does not change across bars in this script.
var string ltfString = LTF.ltf(ltfModeInput, LTF1, LTF2, LTF3, LTF4, LTF5, LTF6, LTF7, LTF8, LTF9, LTF10, LTF11, LTF12)
// @variable An array containing all intrabar `close` prices from the `ltfString` timeframe for the current chart bar.
array intrabarCloses = request.security_lower_tf(syminfo.tickerid, ltfString, close)
// Calculate the intrabar stats.
= LTF.ltfStats(intrabarCloses)
int chartBars = bar_index + 1
// ————— Visuals
// Plot the `avgIntrabars` and `intrabars` series in all display locations.
plot(avgIntrabars, "Average intrabars", color.silver, 6)
plot(intrabars, "Intrabars", color.blue, 2)
// Plot the `chartBarsCovered` and `chartBars` values in the Data Window and the script's status line.
plot(chartBarsCovered, "Chart bars covered", display = display.data_window + display.status_line)
plot(chartBars, "Chart bars total", display = display.data_window + display.status_line)
// Information box logic.
if showInfoBoxInput
// @variable A single-cell table that displays intrabar information.
var table infoBox = table.new(infoBoxYPosInput + "_" + infoBoxXPosInput, 1, 1)
// @variable The span of the `ltfString` timeframe formatted as a number of automatically selected time units.
string formattedLtf = PCtime.formattedNoOfPeriods(timeframe.in_seconds(ltfString) * 1000)
// @variable A "string" containing the formatted text to display in the `infoBox`.
string txt = str.format(
TAB_TXT, formattedLtf, avgIntrabars, chartBarsCovered, chartBars, chartBarsCovered / chartBars * 100, "'"
)
// Initialize the `infoBox` cell on the first bar.
if barstate.isfirst
table.cell(
infoBox, 0, 0, txt, text_color = infoBoxTxtColorInput, text_size = infoBoxSizeInput,
bgcolor = infoBoxColorInput
)
// Update the cell's text on the latest bar.
else if barstate.islast
table.cell_set_text(infoBox, 0, 0, txt)
// Raise a runtime error if no intrabar data is available.
if ta.cum(intrabars) == 0 and barstate.islast
runtime.error(str.format(ERR_TXT, ltfString, "'"))
//#endregion
█ EXPORTED FUNCTIONS
ltf(userSelection, choice1, choice2, ...)
Returns the optimal lower timeframe string based on user selection and current chart timeframe. Dynamically calculates precision to balance granularity with historical coverage within the 200K intrabar limit.
ltfStats(intrabarValues)
Analyzes an intrabar array returned by request.security_lower_tf() and returns statistics: number of intrabars in current bar, total chart bars covered, and average intrabars per bar.
█ CREDITS AND LICENSING
Original Concept : PineCoders Team
Original Lower TF Library :
License : Mozilla Public License 2.0

Name of tickerDescription:
This indicator displays the instrument’s ticker symbol and the current chart timeframe at the top center of the chart.
Features:
• Shows the ticker (e.g., BTCUSDT, AAPL, etc.).
• Displays the current timeframe (1m, 5m, 1H, 1D, etc.).
• Positioned at the top center of the chart for easy reference.
• Transparent background for minimal interference with price action.
• Lightweight and simple, no extra settings required.
Usage:
• Works with any instrument: stocks, crypto, futures.
• Useful for traders who want to always see the ticker and timeframe while analyzing the chart.
Settings:
• Text size can be adjusted in the script (text_size).
• Text and background colors can be customized (text_color, bgcolor).

Helper Lib by tristanlee85Library "helpers"
This library offers various functions and types based on the algorithmic
concepts as authored by ICT.
kv(key, value)
Returns a string of the key/value set, suitable for debug logging
Parameters:
key (string)
value (string)
Returns: A string formatted as "{key}: {value}"
kv(key, value)
Parameters:
key (string)
value (int)
kv(key, value)
Parameters:
key (string)
value (float)
kv(key, value)
Parameters:
key (string)
value (bool)
method enable(this, enable)
Enable/Disable debug logging
Namespace types: Debugger
Parameters:
this (Debugger)
enable (bool) : Set to `true` by default.
method group(this, label)
Creates a group label for nested debug() invocations
Namespace types: Debugger
Parameters:
this (Debugger)
label (string)
method groupEnd(this, label)
Ends the specified debug group
Namespace types: Debugger
Parameters:
this (Debugger)
label (string)
method log(this, s, arg1, arg2, arg3, arg4, arg5)
Logs the param values if debug mode is enabled
Namespace types: Debugger
Parameters:
this (Debugger)
s (string) : Title of the log message
arg1 (string)
arg2 (string)
arg3 (string)
arg4 (string)
arg5 (string)
method logIf(this, expr, s, arg1, arg2, arg3, arg4, arg5)
Same behavior as debug() except will only log if the passed expression is true
Namespace types: Debugger
Parameters:
this (Debugger)
expr (bool) : Boolean expression to determine if debug logs should be logged
s (string) : Title of the log message
arg1 (string)
arg2 (string)
arg3 (string)
arg4 (string)
arg5 (string)
style_getLineStyleFromType(opt)
Returns the corresponding line style constant for the given LineStyleType
Parameters:
opt (series LineStyleType) : The selected line style type
Returns: The Pine Script line style constant
style_getTextSizeFromType(opt)
Returns the corresponding text size constant for the given TextSizeType
Parameters:
opt (series TextSizeType) : The selected text size type
Returns: The Pine Script text size constant
style_getTextHAlignFromType(t)
Returns the corresponding horizontal text align constant for the given HAlignType
Parameters:
t (series HAlignType) : The selected text align type
Returns: The Pine Script text align constant
style_getTextVAlignFromType(t)
Returns the corresponding vertical text align constant for the given VAlignType
Parameters:
t (series VAlignType) : The selected text align type
Returns: The Pine Script text align constant
format_sentimentType(sentiment, pd)
Used to produce a string with the sentiment and PD array type (e.g., "+FVG")
Parameters:
sentiment (series SentimentType) : The sentiment value (e.g., SentimentType.BULLISH)
pd (series PDArrayType) : The price data array (e.g., PDArrayType.FVG)
Returns: A formatted string with the sentiment and PD array (e.g., "+FVG")
format_timeToString(timestamp)
Formats a UNIX timestamp into a date and time string based on predefined formats
Parameters:
timestamp (int) : The UNIX timestamp to format
Returns: A formatted string as "MM-dd (E) - HH:mm"
method init(this)
Initializes the session and validates the configuration. This MUST be called immediately after creating a new instance.
Namespace types: Session
Parameters:
this (Session) : The Session object reference
Returns: The Session object (chainable) or throws a runtime error if invalid
method isActive(this, _time)
Determines if the session is active based on the current bar time
Namespace types: Session
Parameters:
this (Session) : The Session object reference
_time (int)
Returns: `true` if the session is currently active; `false` otherwise
method draw(this)
Draws the line and optional label
Namespace types: LineLabel
Parameters:
this (LineLabel) : The LineLabel object reference
Returns: The LineLabel object (chainable)
method extend(this, x)
Extends the line and label right to the specified bar index
Namespace types: LineLabel
Parameters:
this (LineLabel) : The LineLabel object reference
x (int) : The bar index to extend to
Returns: The LineLabel object (chainable)
method destroy(this)
Removes the line and label from the chart
Namespace types: LineLabel
Parameters:
this (LineLabel) : The LineLabel object reference
isFVG(includeVI, barIdx)
Checks if the previous bars form a Fair Value Gap (FVG)
Parameters:
includeVI (bool) : If true, includes Volume Imbalance in the FVG calculation
barIdx (int) : The index of the bar to check from (default is 0 for the current bar)
Returns: A Gap object if a FVG is detected; otherwise, `na`
isVolumeImbalance(barIdx)
Checks if the previous bars form a Volume Imbalance (VI)
Parameters:
barIdx (int) : The index of the bar to check from (default is 0 for the current bar)
Returns: A Gap object if a VI is detected; otherwise, `na`
isLiquidityVoid(barIdx)
Checks if the previous bars form a Liquidity Void (LV)
Parameters:
barIdx (int) : The index of the bar to check from (default is 0 for the current bar)
Returns: A Gap object if an LV is detected; otherwise, `na`
isSwingPoint(barIdx)
Checks if the previous bars form a swing point
Parameters:
barIdx (int) : The index of the bar to check from (default is 0 for the current bar)
Returns: A SwingPoint object if a swing point is detected; otherwise, `na`
Debugger
A debug logging utility with group support
Fields:
enabled (series bool)
_debugGroupStack (array)
Session
Defines a trading session with a name and time range. When creating a new instance of this type, you MUST call init() immediately.
Fields:
name (series string) : A display-friendly name (e.g., "NY AM")
session (series string) : A string defining the session time range (e.g., "1300-1400")
enabled (series bool) : Optional flag for custom logic; defaults to false
start (series int) : UNIX time representing the session start (set via isActive())
end (series int) : UNIX time representing the session end (set via isActive())
_t (series int)
_start_HH (series float)
_start_mm (series float)
_end_HH (series float)
_end_mm (series float)
Gap
Represents a price inefficiency (gap) with details on sentiment and price levels
Fields:
type (series SentimentType) : The sentiment of the gap (e.g., SentimentType.BULLISH)
name (series string) : A display-friendly name (e.g., "+FVG")
startTime (series int) : UNIX time value for the gap's start
endTime (series int) : UNIX time value for the gap's end
startIndex (series int) : Bar index where the gap starts
endIndex (series int) : Bar index where the gap ends
gapLow (series float) : The lowest price level of the gap
gapHigh (series float) : The highest price level of the gap
ce (series float) : The consequent encroachment level of the gap
SwingPoint
Represents a swing point with details on type and price level
Fields:
type (series SwingPointType) : The type of swing point (e.g., SwingPointType.HIGH)
time (series int) : UNIX time value for the swing point
barIdx (series int) : Bar index where the swing point occurs
price (series float) : The price level of the swing point which is either the high or low of the middle bar
LineLabel
Combines a line and box type to produce a line with a label that is properly aligned
Fields:
x (series int) : The X-axis starting point as a bar index
y (series float) : The Y-axis starting point as the price level
color (series color) : Both the line and text color
width (series int) : Thickness of the line
label (series string) : Text to display
showLabel (series bool) : Boolean to conditionally show/hide the label (default is false)
lineStyle (series LineStyleType) : The style of the line
textSize (series TextSizeType)
_b (series box)
_l (series line)

Simple Multi-Timeframe Trends with RSI (Realtime)Simple Multi-Timeframe Trends with RSI Realtime Updates
Overview
The Simple Multi-Timeframe Trends with RSI Realtime Updates indicator is a comprehensive dashboard designed to give you an at-a-glance understanding of market trends across nine key timeframes, from one minute (M1) to one month (M).
It moves beyond simple moving average crossovers by calculating a sophisticated Trend Score for each timeframe. This score is then intelligently combined into a single, weighted Confluence Signal , which adapts to your personal trading style. With integrated RSI and divergence detection, SMTT provides a powerful, all-in-one tool to confirm your trade ideas and stay on the right side of the market.
Key Features
Automatic Trading Presets: The most powerful feature of the script. Simply select your trading style, and the indicator will automatically adjust all internal parameters for you:
Intraday: Uses shorter moving averages and higher sensitivity, focusing on lower timeframe alignment for quick moves.
Swing Trading: A balanced preset using medium-term moving averages, ideal for capturing trends that last several days or weeks.
Investment: Uses long-term moving averages and lower sensitivity, prioritizing the major trends on high timeframes.
Advanced Trend Scoring: The trend for each timeframe isn't just "up" or "down". The score is calculated based on a combination of:
Price vs. Moving Average: Is the price above or below the MA?
MA Slope: Is the trend accelerating or decelerating? A steep slope indicates a strong trend.
Price Momentum: How quickly has the price moved recently?
Volatility Adjustment: The score's quality is adjusted based on current market volatility (using ATR) to filter out choppy conditions.
Weighted Confluence Score: The script synthesizes the trend scores from all nine timeframes into a single, actionable signal. The weights are dynamically adjusted based on your selected Trading Style , ensuring the most relevant timeframes have the most impact on the final result.
Integrated RSI & Divergence: Each timeframe includes a smoothed RSI value to help you spot overbought/oversold conditions. It also flags potential bullish (price lower, RSI higher) and bearish (price higher, RSI lower) divergences, which can be early warnings of a trend reversal.
Clean & Customizable Dashboard: The entire analysis is presented in a clean, easy-to-read table on your chart. You can choose its position and optionally display the raw numerical scores for a deeper analysis.
How to Use It
1. Add to Chart: Apply the "Simple Multi-Timeframe Trends" indicator to your chart.
2. Select Your Style: This is the most important step. Go to the indicator settings and choose the Trading Style that best fits your strategy (Intraday, Swing Trading, or Investment). All calculations will instantly adapt.
3. Analyze the Dashboard:
Look at the Trend row to see the direction and strength of the trend on individual timeframes. Strong alignment (e.g., all green or all red) indicates a powerful, market-wide move.
Check the RSI row. Is the trend overextended (RSI > 60) or is there room to run? Look for the fuchsia color, which signals a divergence and warrants caution.
Focus on the Signal row. This is your summary. A "STRONG SIGNAL" with high alignment suggests a high-probability setup. A "NEUTRAL" or "Weak" signal suggests waiting for a better opportunity.
4. Confirm Your Trades: Use the SMTT dashboard as a confirmation tool. For example, if you are looking for a long entry, wait for the dashboard to show a "BULLISH" or "STRONG SIGNAL" to confirm that the broader market structure supports your trade.
Dashboard Legend
Trend Row
This row shows the trend direction and strength for each timeframe.
⬆⬆ (Dark Green): Ultra Bullish - Very strong, established uptrend.
⬆ (Green): Strong Bullish - Confident uptrend.
▲ (Light Green): Bullish - The beginning of an uptrend or a weak uptrend.
━ (Orange): Neutral - Sideways or consolidating market.
▼ (Light Red): Bearish - The beginning of a downtrend or a weak downtrend.
⬇ (Red): Strong Bearish - Confident downtrend.
⬇⬇ (Dark Red): Ultra Bearish - Very strong, established downtrend.
RSI Row
This row displays the smoothed RSI value and its condition.
Green Text: Oversold (RSI < 40). Potential for a bounce or reversal upwards.
Red Text: Overbought (RSI > 60). Potential for a pullback or reversal downwards.
Fuchsia (Pink) Text: Divergence Detected! A potential reversal is forming.
White Text: Neutral (RSI between 40 and 60).
Signal Row
This is the final, weighted confluence of all timeframes.
Label:
🚀 STRONG SIGNAL / 💥 STRONG SIGNAL: High confluence and strong momentum.
🟢 BULLISH / 🔴 BEARISH: Clear directional bias across relevant timeframes.
🟡 Weak + / 🟠 Weak -: Minor directional bias, suggests caution.
⚪ NEUTRAL: No clear directional trend; market is likely choppy or undecided.
Numerical Score: The raw weighted confluence score. The further from zero, the stronger the signal.
Alignment %: The percentage of timeframes (out of 9) that are showing a clear bullish or bearish trend. Higher percentages indicate a more unified market.
