Tìm kiếm tập lệnh với "tp"

BTC 5M Scalper: 3EMA Reversal v1.6 Lite by AIOBest Timeframe: 5 minutes!!
Optimal Asset: BTC/USDT (Bitcoin)
Stop Placement: Below the signal candle's low (for long) / Above the signal candle's high (for short)
Risk/Reward: Minimum 1:2 ratio recommended
Description:
This 3EMA Reversal strategy identifies trend continuation signals using:
Fast EMA (20) and Slow EMA (50) crossover
Volume confirmation (above 20-period average)
Engulfing candle pattern
Built-in stop loss and take profit levels
Usage Instructions:
Apply to BTC/USDT 5-minute chart
Enter long when green triangle appears (stop below signal candle)
Enter short when red triangle appears (stop above signal candle)
TP levels are automatically calculated based on your RR setting
Pro Tip: Combine with 1-hour trend analysis for better results. The strategy works best in trending markets with above-average volume.

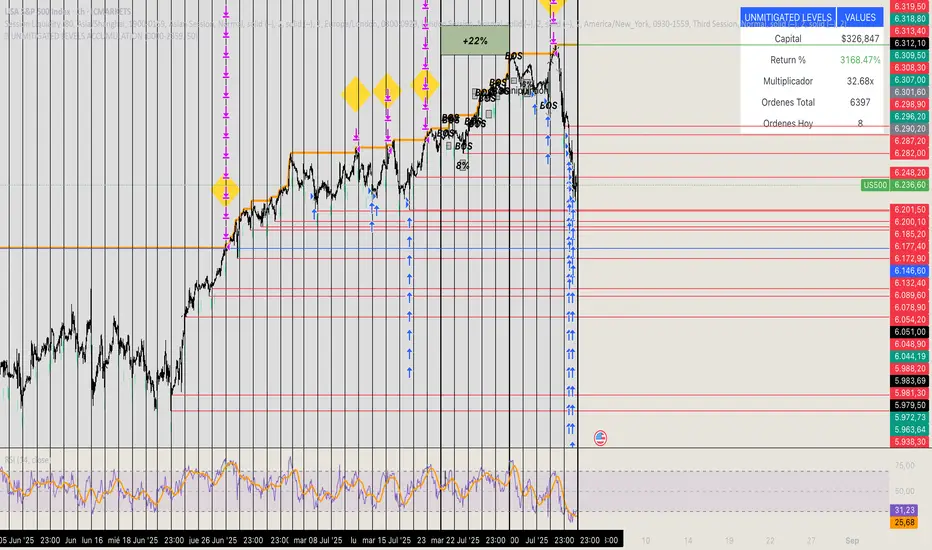
🏆 UNMITIGATED LEVELS ACCUMULATIONPDH TO ATH RISK FREE
All the PDL have a buy limit which starts at 0.1 lots which will duplicate at the same time the capital incresases. All of the buy limits have TP in ATH for max reward.
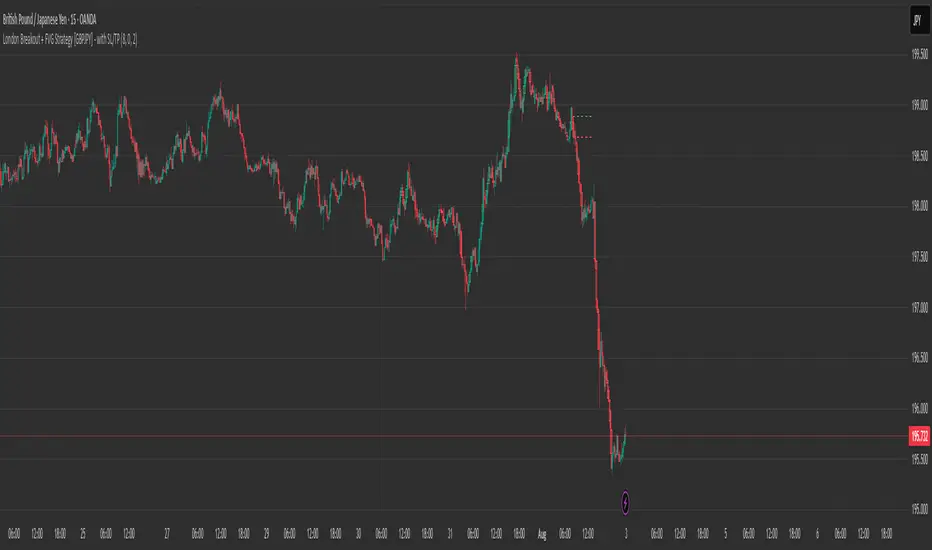
London Breakout + FVG Strategy [GBPJPY] - with SL/TPMarks the London open high and low on 15 min time frame, ads fvg on 5 min for orders
✅ BACKTEST: UT Bot + RSIRSI levels widened (60/40) — more signals.
Removed ATR volatility filter (to let trades fire).
Added inputs for TP and SL using ATR — fully dynamic.
Cleaned up conditions to ensure alignment with market structure.

EMA Crossover with Volume + Stacked TP & Trailing SLI am relatively new here. Here is my humble contribution to the community. Simple does it! Ema 21,55 with volume. Surprisingly high win rates and good profit factors on USDJPY, EURJPY, BTCUSD, XAGUSD,XAUUSD, USOIL, USDCAD, EURGBP and AUDNZD. I cannot write a single line of code. I used Copilot for this.

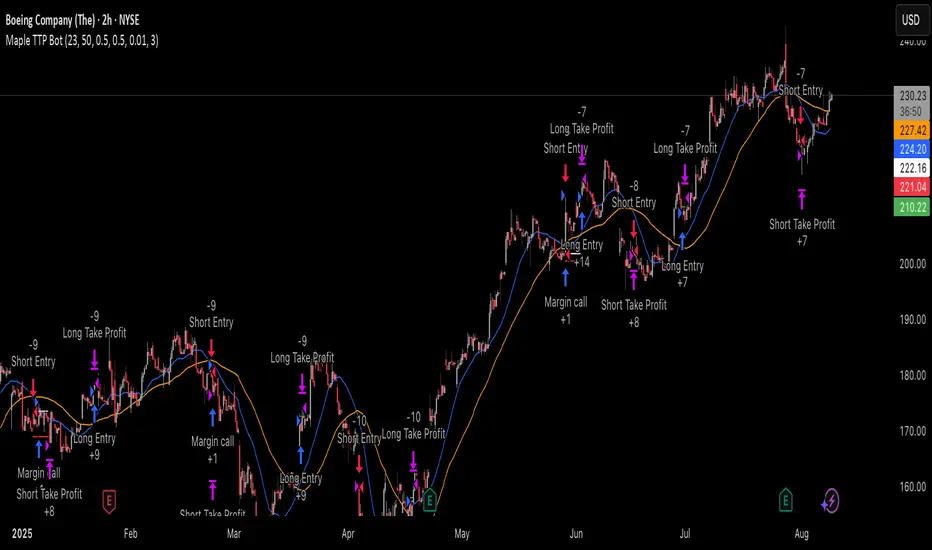
Trailing TP Bot • Crossover-based Trend Strategy using two simple moving averages (SMAs)
• Includes Take Profit and optional Trailing Take Profit
• Trades both long and short
• No pyramiding, i.e., one position at a time
Dubic EMA StrategyThe Dubic EMA Strategy is a trend-following and volatility-aware strategy that combines dual EMA filters with intelligent range and noise detection to provide clean, actionable entries. It's designed to avoid choppy markets, enhance trade precision, and adapt to different market conditions.
✅ Key Features:
Dual EMA Filter: Enters long when price is above both EMA High & EMA Low, and short when below both.
Range Filter: Avoids entries during tight consolidations or sideways markets.
Volatility Filter: Prevents trading in low-ATR conditions.
Dynamic Risk Management:
ATR-based or fixed % Stop Loss and Take Profit.
Optional Parabolic SAR trailing stop.
One Trade per Trend: Prevents re-entry until trend direction changes.
Unbroken Range Visualization: Detects and displays consolidation zones that can lead to breakouts.
Alerts & Labels: Clean BUY/SELL signals with alerts and chart labels.
🧩 Customization Options:
Adjustable EMA length
Toggle between ATR or % based SL/TP
Volatility threshold
Range detection sensitivity
Enable/disable SAR trailing stop
This strategy works best on trending assets and timeframes with volatility (e.g., crypto, forex, indices). Suitable for both manual trading and automation.
🛠️ Built for clarity, control, and precision.
📈 Backtest, optimize, and deploy with confidence.

Swing Strategy MTF with Auto SL/TP + Weekly Pivotsested and Working Notes:
Works on any intraday chart (like 1H or 4H)
Uses Daily trend for confirmation by default
Adjust trend EMAs or pivot TF if needed
Wait for a signal label after candle close
Targets and SL are drawn automatically
—

30M Scalping Strategy with Debug LogsWhat’s changed
Spot‑only: all short logic removed—only long entries and exits are generated.
Logging: uses log.info() to send entry/exit details (timestamp, price, ATR, RSI) to the Pine Logs console.
Clean & concise: core scalp logic (EMAs, RSI, MACD, volume, ATR SL/TP) remains intact.

HSI1! First 30m Candle Strategy (15m Chart)## HSI1! First 30-Minute Candle Breakout Strategy (15m Chart) — Description
### Overview
This strategy is designed for trading **Hang Seng Index (HSI) Futures** on a 15-minute chart. It uses the price range established during the first 30 minutes of the Hong Kong main session (09:15–09:44:59) to define key breakout levels for a systematic trade entry each day.
### How the Strategy Works
#### 1. Reference Candle Period
- **Aggregation Window:** The strategy monitors the first two 15-minute bars of the session (09:15:00–09:44:59 HKT).
- **Range Capture:** It records the highest and lowest prices (the "reference high/low") during this window.
#### 2. Trade Setup
- After the 09:45 bar completes, the reference range is locked in.
- Throughout the rest of the trading day (within session hours), the strategy looks for breakouts beyond the reference range.
#### 3. Entry Rules
- **Long Entry (Buy):**
- Triggered if price rises to or above the reference high.
- Only entered if the user's settings permit "Buy Only" or "Both".
- **Short Entry (Sell):**
- Triggered if price falls to or below the reference low.
- Only entered if the user's settings permit "Sell Only" or "Both".
- **Single trade per day:**
- Once any trade executes, no additional trades are opened until the next session.
#### 4. Exit Rules
- **Take Profit (TP):**
- Target profit is set to a distance equal to the initial range added above the long entry (or subtracted below the short entry).
- Example: For a 100-point range, a long trade targets entry + 100 points.
- **Stop Loss (SL):**
- Longs are stopped out if price falls back to the session's reference low; shorts are stopped out if price rallies to the reference high.
#### 5. Session Control
- Active only within the regular day session (09:15–12:00 and 13:00–16:00 HKT).
- Trade tracking resets each new trading day.
#### 6. Trade Direction Manual Setting
- A user input allows restriction to "Buy Only", "Sell Only" or "Both" directions, providing discretion over daily bias.
### Example Workflow
| Step | Action |
|---------------------------|-------------------------------------------------------------------------|
| 09:15–09:44 | Aggregate first two 15m candles; record daily high/low |
| After 09:45 | Wait for a breakout (price crossing either the high or the low) |
| Long trade triggered | Enter at the reference high, target is "high + range", SL is at the low |
| Short trade triggered | Enter at the reference low, target is "low - range", SL at the high |
| Trade management | No more trades for the day, regardless of further breakouts |
| End of session (if open) | Trades may be closed per further logic or left to strategy to handle |
### Key Features and Benefits
- **Discipline:** Only one trade per day, minimizing overtrading.
- **Clarity:** Transparent entry/exit rules; no discretionary execution.
- **Flexibility:** User can bias system to buy-only, sell-only, or allow both, depending on trend or personal view.
- **Simple Risk Control:** Pre-defined stop loss and profit target for every trade.
- **Works best in:** Trending, breakout-prone markets with a history of impulsive moves early in the session.
This strategy is ideal for systematic traders looking to capture the Hang Seng's early session momentum, with robust rule-based management and minimal intervention.

BE-Indicator Aggregator toolkit█ Overview:
BE-Indicator Aggregator toolkit is a toolkit which is built for those we rely on taking multi-confirmation from different indicators available with the traders. This Toolkit aid's traders in understanding their custom logic for their trade setups and provides the summarized results on how it performed over the past.
█ How It Works:
Load the external indicator plots in the indicator input setting
Provide your custom logic for the trade setup
Set your expected SL & TP values
█ Legends, Definitions & Logic Building Rules:
Building the logic for your trade setup plays a pivotal role in the toolkit, it shall be broken into parts and toolkit aims to understand each of the logical parts of your setup and interpret the outcome as trade accuracy.
Toolkit broadly aims to understand 4 types of inputs in "Condition Builder"
Comments : Line which starts with single quotation ( ' ) shall be ignored by toolkit while understanding the logic.
Note: Blank line space or less than 3 characters are treated equally to comments.
Long Condition: Line which starts with " L- " shall be considered for identifying Long setups.
Short Condition: Line which starts with " S- " shall be considered for identifying Short setups.
Variables: Line which starts with " VAR- " shall be considered as variables. Variables can be one such criteria for Long or short condition.
Building Rules: Define all variables first then specify the condition. The usual declare and assign concept of programming. :p)
Criteria Rules: Criteria are individual logic for your one parent condition. multiple criteria can be present in one condition. Each parameter should be delimited with ' | ' key and each criteria should be delimited with ' , ' (Comma with a space - IMPORTANT!!!)
█ Sample Codes for Conditional Builder:
For Trading Long when Open = Low
For Trading Short when Open = High with a Red candle
'Long Setup <---- Comment
L-O|E|L
' E <- in the above line refers to Equals ' = '
'Short Setup
S-AND:O|E|H, O|G|C
' 2 Criteria for used building one condition. Since, both have to satisfied used "AND:" logic.
Understanding of Operator Legends:
"E" => Refers to Equals
"NE" => Refers to Not Equals
"NEOR" => Logical value is Either Comparing value 1 or Comparing value 2
"NEAND" => Logical value is Comparing value 1 And Comparing value 2
"G" => Logical value Greater than Comparing value 1
"GE" => Logical value Greater than and equal to Comparing value 1
"L" => Logical value Lesser than Comparing value 1
"LE" => Logical value Lesser than and equal to Comparing value 1
"B" => Logical value is Between Comparing value 1 & Comparing value 2
"BE" => Logical value is Between or Equal to Comparing value 1 & Comparing value 2
"OSE" => Logical value is Outside of Comparing value 1 & Comparing value 2
"OSI" => Logical value is Outside or Equal to Comparing value 1 & Comparing value 2
"ERR" => Logical value is 'na'
"NERR" => Logical value is not 'na'
"CO" => Logical value Crossed Over Comparing value 1
"CU" => Logical value Crossed Under Comparing value 1
Understanding of Condition Legends:
AND: -> All criteria's to be satisfied for the condition to be True.
NAND: -> Output of AND condition shall be Inversed for the condition to be True.
OR: -> One of criteria to be satisfied for the condition to be True.
NOR: -> Output of OR condition shall be Inversed for the condition to be True.
ATLEAST:X: -> At-least X no of criteria to be satisfied for the condition to be True.
Note: "X" can be any number
NATLEAST:X: -> Output of ATLEAST condition shall be Inversed for the condition to be True
WASTRUE:X: -> Single criteria WAS TRUE within X bar in past for the condition to be True.
Note: "X" can be any number.
ISTRUE:X: -> Single criteria is TRUE since X bar in past for the condition to be True.
Note: "X" can be any number.
Understanding of Variable Legends:
While Condition Supports 8 Types, Variable supports only 6 Types listed below
AND: -> All criteria's to be satisfied for the Variable to be True.
NAND: -> Output of AND condition shall be Inversed for the Variable to be True.
OR: -> One of criteria to be satisfied for the Variable to be True.
NOR: -> Output of OR condition shall be Inversed for the Variable to be True.
ATLEAST:X: -> At-least X no of criteria to be satisfied for the Variable to be True.
Note: "X" can be any number
NATLEAST:X: -> Output of ATLEAST condition shall be Inversed for the Variable to be True
█ Sample Outputs with Logics:
1. RSI Indicator + Technical Indicator: StopLoss: 2.25 against Reward ratio of 1.75 (3.94 value)
Plots Used in Indicator Settings:
Source 1:- RSI
Source 2:- RSI Based MA
Source 3:- Strong Buy
Source 4:- Strong Sell
Logic Used:
For Long Setup : RSI Should be above RSI Based MA, RSI has been Rising when compared to 3 candles ago, Technical Indicator signaled for a Strong Buy on the current candle, however in last 6 candles Technical indicator signaled for Strong Sell.
Similarly Inverse for Short Setup.
L-AND:ES1|GE|ES2, ES1|G|ES1
L-ES3|E|1
L-OR:ES4 |E|1, ES4 |E|1, ES4 |E|1, ES4 |E|1, ES4 |E|1, ES4 |E|1
S-AND:ES1|LE|ES2, ES1|L|ES1
S-ES4|E|1
S-OR:ES3 |E|1, ES3 |E|1, ES3 |E|1, ES3 |E|1, ES3 |E|1, ES3 |E|1
'Note: Last OR condition can also be written by using WASTRUE definition like below
'L-WASTRUE:6:ES4|E|1
'S-WASTRUE:6:ES3|E|1
Output:
2. Volumatic Support / Resistance Levels :
Plots Used in Indicator Settings:
Source 1:- Resistance
Source 2:- Support
Logic Used:
For Long Setup : Long Trade on Liquidity Support.
For Short Setup : Short Trade on Liquidity Resistance.
'Variable Named "ChkLowTradingAbvSupport" is declared to check if last 3 candles is trading above support line of liquidity.
VAR-ChkLowTradingAbvSupport:AND:L|G|ES2, L |G|ES2, L |G|ES2
'Variable Named "ChkCurBarClsdAbv4thBarHigh" is declared to check if current bar closed above the high of previous candle where the Liquidity support is taken (4th Bar).
VAR-ChkCurBarClsdAbv4thBarHigh:OR:C|GE|H , L|G|H
'Combining Condition and Variable to Initiate Long Trade Logic
L-L |LE|ES2
L-AND:ChkLowTradingAbvSupport, ChkCurBarClsdAbv4thBarHigh
VAR-ChkHghTradingBlwRes:AND:H|L|ES1, H |L|ES1, H |L|ES1
VAR-ChkCurBarClsdBlw4thBarLow:OR:C|LE|L , H|L|L
S-H |GE|ES1
S-AND:ChkHghTradingBlwRes, ChkCurBarClsdBlw4thBarLow
Output 1: Day Trading Version
Output 2: Scalper Version
Output 3: Position Version

🧪 Yuri Garcia Smart Money Strategy FULL (Slope Divergence))📣 Yuri Garcia – Smart Money Strategy FULL
This is my private Smart Money Concept strategy, designed for my family and community to learn, trade, and grow sustainably.
🔑 How it works:
✅ Volume Cluster Zones: Automatically detects areas where strong buyers or sellers concentrate, acting as dynamic S/R levels.
✅ HTF Institutional Zones (4H): Higher timeframe trend filter ensures you’re always trading in the direction of major flows.
✅ Wick Pullback Filter: Confirms price rejects the zone, catching smart money traps and reversals.
✅ Cumulative Delta (CVD): Confirms whether buyers or sellers are truly in control.
✅ Slope-Based Divergence: Optional hidden divergence between price & CVD to spot reversals others miss.
✅ ATR Dynamic SL/TP: Adapts stop loss and take profit to live volatility with adjustable risk/reward.
🧩 Visual Markers Explained:
🟦 Blue X: Price inside HTF zone
🟨 Yellow X: Price inside Volume Cluster zone
🟧 Orange Circle: Wick pullback detected
🟥 Red Square: CVD confirms order flow strength
🔼 Aqua Triangle Up: Bullish slope divergence
🔽 Purple Triangle Down: Bearish slope divergence
🟢 Green Triangle Up: Final Long Entry confirmed
🔴 Red Triangle Down: Final Short Entry confirmed
⚡ Who is this for?
This strategy is best suited for traders who understand smart money concepts, order flow, and want an adaptive framework to trade major assets like BTC, Gold, SP500, NASDAQ, or FX pairs.
🔒 Important
Use responsibly, backtest extensively, and combine with solid risk management. This is for educational purposes only.
✨ Credits
Built with ❤️ by Yuri Garcia – dedicated to my family & community.
✅ How to use it
1️⃣ Add to chart
2️⃣ Adjust inputs for your asset & timeframe
3️⃣ Enable/disable slope divergence filter to match your style
4️⃣ Set your alerts with built-in conditions

50/100 EMA Crossover with Candle Confirmation📘 **50/100 EMA Crossover with Candle Confirmation – Strategy Description**
The **50/100 EMA Crossover with Candle Confirmation** is a trend-following strategy designed to filter high-probability entries by combining exponential moving average (EMA) crossovers with strong price action confirmation. This strategy aims to reduce false signals commonly associated with EMA-only systems by requiring a **candle close confirmation in the direction of the trend**, making it more reliable for intraday or swing trading across Forex, crypto, and stock markets.
---
### 🔍 **Core Logic**
* The strategy is based on the interaction of the **50 EMA** (fast-moving average) and the **100 EMA** (slow-moving average).
* **Trend direction** is determined by the crossover:
* **Bullish Trend**: When the 50 EMA crosses **above** the 100 EMA.
* **Bearish Trend**: When the 50 EMA crosses **below** the 100 EMA.
* To **filter out false breakouts**, a **candle confirmation** is used:
* For a **Buy signal**: After a bullish crossover, wait for a strong bullish candle (e.g., full-body green candle) to **close above both EMAs**.
* For a **Sell signal**: After a bearish crossover, wait for a strong bearish candle to **close below both EMAs**.
---
### ✅ **Entry Conditions**
**Buy Entry:**
* 50 EMA crosses above 100 EMA.
* Latest candle closes **above both EMAs**.
* Candle must be bullish (green/full body preferred).
**Sell Entry:**
* 50 EMA crosses below 100 EMA.
* Latest candle closes **below both EMAs**.
* Candle must be bearish (red/full body preferred).
---
### 🛑 **Exit or Take-Profit Options**
* **Fixed TP/SL**: 1:2 or 1:3 risk-reward.
* **Trailing Stop**: Based on recent swing highs/lows or ATR.
* **EMA Exit**: Exit trade when the candle closes on the opposite side of 50 EMA.
---
### ⚙️ **Best Settings**
* **Timeframes**: 5M, 15M, 1H, 4H (works well on most).
* **Markets**: Forex, Crypto (e.g., BTC/ETH), Indices (e.g., NASDAQ, NIFTY50).
* **Recommended filters**:
* Use with RSI divergence or volume confirmation.
* Avoid using during high-impact news (especially on lower timeframes).
---
### 🧠 **Why This Works**
The 50/100 EMA crossover provides a **medium-term trend signal**, reducing noise seen in fast EMAs (like 9 or 21). The candle confirmation adds a **momentum filter**, ensuring price supports the directional bias. This makes it suitable for traders who want a balance of trend and entry precision without overcomplicating with too many indicators.
---
### 📈 **Advantages**
* Simple yet effective for identifying trends.
* Filters out fakeouts using candle confirmation.
* Easy to automate in Pine Script or other trading bots.
* Can be combined with support/resistance or SMC zones for better confluence.
---
### ⚠️ **Limitations**
* May lag slightly in ranging markets.
* Late entries possible due to confirmation candle.
* Works best with additional volume or volatility filter.

MA Crossover Strategy with TP/SL (5 EMA Filter)How the Strategy Works on a 5-Minute Chart:
Data Input (5-Minute Candles):
Every single data point (candle) on your chart will represent 5 minutes of price action (Open, High, Low, Close for that 5-minute period).
All calculations (MAs, EMA, signals) will be based on these 5-minute price data points.
Moving Average Calculations:
Fast MA (10-period SMA): This will be the Simple Moving Average of the closing prices of the last 10 five-minute candles. It reacts relatively quickly to recent price changes.
Slow MA (30-period SMA): This will be the Simple Moving Average of the closing prices of the last 30 five-minute candles. It represents a slightly longer-term trend compared to the Fast MA.
5 EMA (5-period EMA): This is the Exponential Moving Average of the closing prices of the last 5 five-minute candles. Being an EMA, it gives more weight to the most recent 5-minute prices, making it very responsive to immediate price action.
Signal Generation (Entry Conditions):
Long Entry Signal:
The 10-period SMA crosses above the 30-period SMA (indicating a potential bullish shift in the short-to-medium term trend).
AND the current 5-minute candle's closing price is above the 5-period EMA (confirming that the immediate price momentum is also bullish and supporting the crossover).
If both conditions are met at the close of a 5-minute candle, a "Buy" signal is generated.
Short Entry Signal:
The 10-period SMA crosses below the 30-period SMA (indicating a potential bearish shift).
AND the current 5-minute candle's closing price is below the 5-period EMA (confirming immediate bearish momentum).
If both conditions are met at the close of a 5-minute candle, a "Sell" signal is generated.
Trade Execution:
When a signal is triggered, the strategy enters a trade (long or short) at the closing price of that 5-minute candle.
Immediately upon entry, it places two contingent orders:
Take Profit (Target): Set at 2% (by default) away from your entry price. For a long trade, it's 2% above; for a short trade, 2% below.
Stop Loss: Set at 1% (by default) away from your entry price. For a long trade, it's 1% below; for a short trade, 1% above.
The trade will remain open until either the Take Profit or Stop Loss price is hit by subsequent 5-minute candles.
Implications for Trading on a 5-Minute Chart:
Increased Trade Frequency: You will likely see many more signals and trades compared to higher timeframes (like 1-hour or daily charts). This means more potential opportunities but also more transaction costs (commissions, slippage).
Sensitivity to Noise: Lower timeframes are more prone to "market noise" – small, random price fluctuations that don't indicate a true trend. While the 5 EMA filter helps, some false signals might still occur.
Faster Price Action: Price movements can be very rapid on a 5-minute chart. Your take profit or stop loss levels might be hit very quickly, sometimes within the same or next few candles.
Parameter Optimization is Crucial: The default MA lengths (10, 30) and EMA (5) might not be optimal for every asset or market condition on a 5-minute chart. You'll need to backtest extensively and potentially adjust these lengths, as well as the targetPerc and stopPerc, to find what works best for the specific instrument you're trading.
Risk Management: The fixed percentage stop loss is vital on a 5-minute chart due to its volatility. Without it, a few unfavorable moves could lead to significant losses.

5 EMA STRATEGY by Power of Stocks(StockYogi)5 EMA STRATEGY by Power of Stocks(StockYogi)
This is a 5 EMA Breakout Strategy inspired by the trading principles taught by Shubhashi Pani, founder of the Power of Stocks (POS) community.
The strategy is designed to:
• Detect breakout setups when price breaks the high/low of a signal candle (based on EMA conditions)
• Enter trades only if the breakout occurs within the next 3 candles
• Allow multiple trades in the same direction without closing the earlier one
• Use independent stop-loss (SL) and take-profit (TP) targets for each trade based on a user-defined risk-reward ratio
• Optionally enter trades only at candle close
• Optionally avoid trades during a custom time window (e.g., 3:00 PM to 3:30 PM IST)
• Optionally close all open positions at a defined time (e.g., 3:30 PM IST)
The goal of this strategy is to provide greater flexibility and realism for intraday or short-term traders following structured breakout systems.
Disclaimer: This script is an implementation of technical ideas for educational purposes only. It is not financial advice. All trading involves risk, and past performance does not guarantee future results.
Strategy Credits:
This strategy is based on publicly known breakout rules taught by Shubhashi Pani (Power of Stocks). This is not an official POS script, and I am not affiliated with the Power of Stocks team. This implementation was developed independently to follow the logic shared for educational use.
Feel free to use, backtest, and modify according to your needs. Constructive feedback is welcome!

Faytterro Bands Breakout📌 Faytterro Bands Breakout 📌
This indicator was created as a strategy showcase for another script: Faytterro Bands
It’s meant to demonstrate a simple breakout strategy based on Faytterro Bands logic and includes performance tracking.
❓ What Is It?
This script is a visual breakout strategy based on a custom moving average and dynamic deviation bands, similar in concept to Bollinger Bands but with unique smoothing (centered regression) and performance features.
🔍 What Does It Do?
Detects breakouts above or below the Faytterro Band.
Plots visual trade entries and exits.
Labels each trade with percentage return.
Draws profit/loss lines for every trade.
Shows cumulative performance (compounded return).
Displays key metrics in the top-right corner:
Total Return
Win Rate
Total Trades
Number of Wins / Losses
🛠 How Does It Work?
Bullish Breakout: When price crosses above the upper band and stays above the midline.
Bearish Breakout: When price crosses below the lower band and stays below the midline.
Each trade is held until breakout invalidation, not a fixed TP/SL.
Trades are compounded, i.e., profits stack up realistically over time.
📈 Best Use Cases:
For traders who want to experiment with breakout strategies.
For visual learners who want to study past breakouts with performance metrics.
As a template to develop your own logic on top of Faytterro Bands.
⚠ Notes:
This is a strategy-like visual indicator, not an automated backtest.
It doesn't use strategy.* commands, so you can still use alerts and visuals.
You can tweak the logic to create your own backtest-ready strategy.
Unlike the original Faytterro Bands, this script does not repaint and is fully stable on closed candles.

ATR Stop-Loss with Fibonacci Take-Profit [jpkxyz]ATR Stop-Loss with Fibonacci Take-Profit Indicator
This comprehensive indicator combines Average True Range (ATR) volatility analysis with Fibonacci extensions to create dynamic stop-loss and take-profit levels. It's designed to help traders set precise risk management levels and profit targets based on market volatility and mathematical ratios.
Two Operating Modes
Default Mode (Rolling Levels)
In default mode, the indicator continuously plots evolving stop-loss and take-profit levels based on real-time price action. These levels update dynamically as new bars form, creating rolling horizontal lines across the chart. I use this mode primarily to plot the rolling ATR-Level which I use to trail my Stop-Loss into profit.
Characteristics:
Levels recalculate with each new bar
All selected Fibonacci levels display simultaneously
Uses plot() functions with trackprice=true for price tracking
Custom Anchor Mode (Fixed Levels)
This is the primary mode for precision trading. You select a specific timestamp (typically your entry bar), and the indicator locks all calculations to that exact moment, creating fixed horizontal lines that represent your actual trade levels.
Characteristics:
Entry line (blue) marks your anchor point
Stop-loss calculated using ATR from the anchor bar
Fibonacci levels projected from entry-to-stop distance
Lines terminate when price breaks through them
Includes comprehensive alert system
Core Calculation Logic
ATR Stop-Loss Calculation:
Stop Loss = Entry Price ± (ATR × Multiplier)
Long positions: SL = Entry - (ATR × Multiplier)
Short positions: SL = Entry + (ATR × Multiplier)
ATR uses your chosen smoothing method (RMA, SMA, EMA, or WMA)
Default multiplier is 1.5, adjustable to your risk tolerance
Fibonacci Take-Profit Projection:
The distance from entry to stop-loss becomes the base unit (1.0) for Fibonacci extensions:
TP Level = Entry + (Entry-to-SL Distance × Fibonacci Ratio)
Available Fibonacci Levels:
Conservative: 0.618, 1.0, 1.618
Extended: 2.618, 3.618, 4.618
Complete range: 0.0 to 4.764 (23 levels total)
Multi-Timeframe Functionality
One of the indicator's most powerful features is timeframe flexibility. You can analyze on one timeframe while using stop-loss and take-profit calculations from another.
Best Practices:
Identify your entry point on execution timeframe
Enable "Custom Anchor" mode
Set anchor timestamp to your entry bar
Select appropriate analysis timeframe
Choose relevant Fibonacci levels
Enable alerts for automated notifications
Example Scenario:
Analyse trend on 4-hour chart
Execute entry on 5-minute chart for precision
Set custom anchor to your 5-minute entry bar
Configure timeframe setting to "4h" for swing-level targets
Select appropriate Fibonacci Extension levels
Result: Precise entry with larger timeframe risk management
Visual Intelligence System
Line Behaviour in Custom Anchor Mode:
Active levels: Lines extend to the right edge
Hit levels: Lines terminate at the breaking bar
Entry line: Always visible in blue
Stop-loss: Red line, terminates when hit
Take-profits: Green lines (1.618 level in gold for emphasis)
Customisation Options:
Line width (1-4 pixels)
Show/hide individual Fibonacci levels
ATR length and smoothing method
ATR multiplier for stop-loss distance

15-Min ORB Indicator with Breakout Targets **What this indicator does:**
The 15-Min ORB (Opening Range Breakout) Indicator helps traders spot breakout trades by automatically detecting the high and low of the first 15 minutes after a session opens. It then monitors for breakouts above or below this range and plots dynamic take-profit levels based on your chosen multipliers.
**How it works:**
You set the start time for your session (hour and minute) in the settings.
The indicator marks the high and low during the first 15 minutes after your chosen open time, drawing lines on the chart and, if enabled, labels for these levels.
If price breaks above the 15-min high, a potential long breakout is identified; if it breaks below the low, a potential short breakout is detected.
Upon a breakout, the script calculates the distance from the entry (breakout) to the opposite side of the 15-min range and uses your input multipliers to project two take-profit levels (TP1/TP2).
All lines and labels (for the range and targets) can be individually toggled on or off in the settings.
Both the 15-min range and the targets can be styled (color, line style, label position).
**How to use it:**
Add the indicator to your chart.
Set the session start hour and minute to match your instrument’s open (e.g., 9:30 for US stocks or futures).
Use the settings to customize which levels and labels are shown, their appearance, and the target expansion multiples.
When price breaks out above or below the opening range, the script will plot TP1 and TP2 lines at your chosen risk/reward multiples, and label them if desired.
You can use the visual levels for trade entries, profit taking, or alerts.
**What makes it unique and useful:** >
Unlike many basic ORB indicators, this script not only marks the opening range but also tracks breakouts, auto-plots your profit targets based on range expansion, and gives you full control over display (styles, toggles, and label positions).
The TP targets are dynamic and can be set to any multiples, adapting to your risk/reward plan and breakout style.
Everything is customizable for your own session times, instrument, or trading approach.
**Typical uses:**
Intraday traders looking for clear breakout setups around the session open.
Automated R-multiple target planning for both long and short trades.
Visualizing volatility and measuring early price expansion.

Live Breakout Zones (No Repaint)The Live Breakout Zones indicator is a non-repainting, real-time breakout detection tool designed to help traders identify critical price breakouts as they happen — without lag and without repainting past signals.
This indicator scans recent price action to determine the highest high and lowest low over a user-defined lookback period. When price closes above the recent high or below the recent low, it immediately plots a breakout zone on the chart and provides a visual confirmation through labels and optional alerts.
🔍 Key Features:
✅ No Repainting – Signals are locked in as soon as a breakout happens; no future bar confirmation is needed.
⏱️ Minimal Lag – Reacts on breakout of recent range highs/lows without waiting for pivots or candle confirmation.
📦 Breakout Zones – Automatically draws colored rectangles showing the breakout level and zone width for clearer analysis.
🔔 Real-Time Alerts – Alerts for both bullish and bearish breakouts help you stay informed without watching the screen.
⚙️ Customizable – Adjustable lookback length, zone width, and color settings to match your strategy or chart style.
📈 Use Cases:
Identify key breakout moments for entry or retest zones.
Confirm breakout-based strategies in trending or consolidating markets.
Use zones for setting risk-reward areas, SL/TP levels, or re-entry planning.
⚙️ Settings:
Lookback Range (High/Low): Defines how many previous bars are checked for breakout levels.
Zone Width: Number of bars to extend the breakout box forward.
Bullish/Bearish Zone Color: Choose custom colors for breakout visualization.
🧠 Trading Tip:
Combine this tool with volume spikes, tail candles, or support/resistance for more reliable breakout setups.

Multi-Confluence Swing Hunter V1# Multi-Confluence Swing Hunter V1 - Complete Description
Overview
The Multi-Confluence Swing Hunter V1 is a sophisticated low timeframe scalping strategy specifically optimized for MSTR (MicroStrategy) trading. This strategy employs a comprehensive point-based scoring system that combines optimized technical indicators, price action analysis, and reversal pattern recognition to generate precise trading signals on lower timeframes.
Performance Highlight:
In backtesting on MSTR 5-minute charts, this strategy has demonstrated over 200% profit performance, showcasing its effectiveness in capturing rapid price movements and volatility patterns unique to MicroStrategy's trading behavior.
The strategy's parameters have been fine-tuned for MSTR's unique volatility characteristics, though they can be optimized for other high-volatility instruments as well.
## Key Innovation & Originality
This strategy introduces a unique **dual scoring system** approach:
- **Entry Scoring**: Identifies swing bottoms using 13+ different technical criteria
- **Exit Scoring**: Identifies swing tops using inverse criteria for optimal exit timing
Unlike traditional strategies that rely on simple indicator crossovers, this system quantifies market conditions through a weighted scoring mechanism, providing objective, data-driven entry and exit decisions.
## Technical Foundation
### Optimized Indicator Parameters
The strategy utilizes extensively backtested parameters specifically optimized for MSTR's volatility patterns:
**MACD Configuration (3,10,3)**:
- Fast EMA: 3 periods (vs standard 12)
- Slow EMA: 10 periods (vs standard 26)
- Signal Line: 3 periods (vs standard 9)
- **Rationale**: These faster parameters provide earlier signal detection while maintaining reliability, particularly effective for MSTR's rapid price movements and high-frequency volatility
**RSI Configuration (21-period)**:
- Length: 21 periods (vs standard 14)
- Oversold: 30 level
- Extreme Oversold: 25 level
- **Rationale**: The 21-period RSI reduces false signals while still capturing oversold conditions effectively in MSTR's volatile environment
**Parameter Adaptability**: While optimized for MSTR, these parameters can be adjusted for other high-volatility instruments. Faster-moving stocks may benefit from even shorter MACD periods, while less volatile assets might require longer periods for optimal performance.
### Scoring System Methodology
**Entry Score Components (Minimum 13 points required)**:
1. **RSI Signals** (max 5 points):
- RSI < 30: +2 points
- RSI < 25: +2 points
- RSI turning up: +1 point
2. **MACD Signals** (max 8 points):
- MACD below zero: +1 point
- MACD turning up: +2 points
- MACD histogram improving: +2 points
- MACD bullish divergence: +3 points
3. **Price Action** (max 4 points):
- Long lower wick (>50%): +2 points
- Small body (<30%): +1 point
- Bullish close: +1 point
4. **Pattern Recognition** (max 8 points):
- RSI bullish divergence: +4 points
- Quick recovery pattern: +2 points
- Reversal confirmation: +4 points
**Exit Score Components (Minimum 13 points required)**:
Uses inverse criteria to identify swing tops with similar weighting system.
## Risk Management Features
### Position Sizing & Risk Control
- **Single Position Strategy**: 100% equity allocation per trade
- **No Overlapping Positions**: Ensures focused risk management
- **Configurable Risk/Reward**: Default 5:1 ratio optimized for volatile assets
### Stop Loss & Take Profit Logic
- **Dynamic Stop Loss**: Based on recent swing lows with configurable buffer
- **Risk-Based Take Profit**: Calculated using risk/reward ratio
- **Clean Exit Logic**: Prevents conflicting signals
## Default Settings Optimization
### Key Parameters (Optimized for MSTR/Bitcoin-style volatility):
- **Minimum Entry Score**: 13 (ensures high-conviction entries)
- **Minimum Exit Score**: 13 (prevents premature exits)
- **Risk/Reward Ratio**: 5.0 (accounts for volatility)
- **Lower Wick Threshold**: 50% (identifies true hammer patterns)
- **Divergence Lookback**: 8 bars (optimal for swing timeframes)
### Why These Defaults Work for MSTR:
1. **Higher Score Thresholds**: MSTR's volatility requires more confirmation
2. **5:1 Risk/Reward**: Compensates for wider stops needed in volatile markets
3. **Faster MACD**: Captures momentum shifts quickly in fast-moving stocks
4. **21-period RSI**: Reduces noise while maintaining sensitivity
## Visual Features
### Score Display System
- **Green Labels**: Entry scores ≥10 points (below bars)
- **Red Labels**: Exit scores ≥10 points (above bars)
- **Large Triangles**: Actual trade entries/exits
- **Small Triangles**: Reversal pattern confirmations
### Chart Cleanliness
- Indicators plotted in separate panes (MACD, RSI)
- TP/SL levels shown only during active positions
- Clear trade markers distinguish signals from actual trades
## Backtesting Specifications
### Realistic Trading Conditions
- **Commission**: 0.1% per trade
- **Slippage**: 3 points
- **Initial Capital**: $1,000
- **Account Type**: Cash (no margin)
### Sample Size Considerations
- Strategy designed for 100+ trade sample sizes
- Recommended timeframes: 4H, 1D for swing trading
- Optimal for trending/volatile markets
## Strategy Limitations & Considerations
### Market Conditions
- **Best Performance**: Trending markets with clear swings
- **Reduced Effectiveness**: Highly choppy, sideways markets
- **Volatility Dependency**: Optimized for moderate to high volatility assets
### Risk Warnings
- **High Allocation**: 100% position sizing increases risk
- **No Diversification**: Single position strategy
- **Backtesting Limitation**: Past performance doesn't guarantee future results
## Usage Guidelines
### Recommended Assets & Timeframes
- **Primary Target**: MSTR (MicroStrategy) - 5min to 15min timeframes
- **Secondary Targets**: High-volatility stocks (TSLA, NVDA, COIN, etc.)
- **Crypto Markets**: Bitcoin, Ethereum (with parameter adjustments)
- **Timeframe Optimization**: 1min-15min for scalping, 30min-1H for swing scalping
### Timeframe Recommendations
- **Primary Scalping**: 5-minute and 15-minute charts
- **Active Monitoring**: 1-minute for precise entries
- **Swing Scalping**: 30-minute to 1-hour timeframes
- **Avoid**: Sub-1-minute (excessive noise) and above 4-hour (reduces scalping opportunities)
## Technical Requirements
- **Pine Script Version**: v6
- **Overlay**: Yes (plots on price chart)
- **Additional Panes**: MACD and RSI indicators
- **Real-time Compatibility**: Confirmed bar signals only
## Customization Options
All parameters are fully customizable through inputs:
- Indicator lengths and levels
- Scoring thresholds
- Risk management settings
- Visual display preferences
- Date range filtering
## Conclusion
This scalping strategy represents a comprehensive approach to low timeframe trading that combines multiple technical analysis methods into a cohesive, quantified system specifically optimized for MSTR's unique volatility characteristics. The optimized parameters and scoring methodology provide a systematic way to identify high-probability scalping setups while managing risk effectively in fast-moving markets.
The strategy's strength lies in its objective, multi-criteria approach that removes emotional decision-making from scalping while maintaining the flexibility to adapt to different instruments through parameter optimization. While designed for MSTR, the underlying methodology can be fine-tuned for other high-volatility assets across various markets.
**Important Disclaimer**: This strategy is designed for experienced scalpers and is optimized for MSTR trading. The high-frequency nature of scalping involves significant risk. Past performance does not guarantee future results. Always conduct your own analysis, consider your risk tolerance, and be aware of commission/slippage costs that can significantly impact scalping profitability.

Simple Risk-to-Reward (R) Indicator (TP1–TP2)What this indicator does:
This tool helps traders clearly visualize their risk and reward on any trade by plotting their entry, stop loss, and take-profit (TP) levels directly on the chart. It’s designed to make manual trade planning more visual and systematic.
How it works:
You set your planned entry price, whether you want to plot a Long or Short setup, and your stop-loss distance (in ticks).
The indicator calculates your stop-loss level and automatically plots it on the chart.
It then draws take-profit levels at 1R and 2R (where “R” is your risk, the distance between entry and stop).
You can toggle the TP1 and TP2 lines on or off to suit your preference.
How to use it:
Open the settings and enter your intended entry price.
Select “Long Setup” for a buy trade, or turn it off for a sell/short trade.
Enter your desired stop loss in ticks.
Choose which take-profit levels to display by toggling TP1 and TP2.
The indicator will show entry, stop, and take-profit levels right on your chart so you can easily see your planned risk/reward.
What makes it unique and useful:
This indicator is designed for manual trade planning, giving you full control over your inputs and letting you instantly see your risk/reward on any instrument or timeframe. Unlike some built-in tools, it supports both long and short trades, lets you set all levels manually, and keeps your charts clean and easy to interpret.

US30 Stealth StrategyOnly works on US30 (CAPITALCOM) 5 Minute chart
📈 Core Concept:
This is a trend-following strategy that captures strong market continuations by entering on:
The 3rd swing in the current trend,
Confirmed by a volume-verified engulfing candle,
With adaptive SL/TP and position sizing based on risk.
🧠 Entry Logic:
✅ Trend Filter
Uses a 50-period Simple Moving Average (SMA).
Buy only if price is above SMA → Uptrend
Sell only if price is below SMA → Downtrend
✅ Swing Count Logic
For buy: Wait for the 3rd higher low
For sell: Wait for the 3rd lower high
Uses a 5-bar lookback to detect highs/lows
This ensures you’re not buying early — but after trend is confirmed with structure.
✅ Engulfing Candle Confirmation
Bullish engulfing for buys
Bearish engulfing for sells
Candle must engulf previous bar completely (body logic)
✅ Volume Filter
Current candle volume must be greater than the 20-period volume average
Ensures trades only occur with institutional participation
✅ MA Slope Filter
Requires the slope of the 50 SMA over the last 3 candles to exceed 0.1
Avoids chop or flat trends
Adds momentum confirmation to the trade
✅ Session Filter (Time Filter)
Trades only executed between:
2:00 AM to 11:00 PM Oman Time (UTC+4)
Helps avoid overnight chop and illiquidity
📊 Position Sizing & Risk Management
✅ Smart SL (Adaptive Stop Loss)
SL is based on full size of the signal candle (including wick)
But if candle is larger than 25 points, SL is cut to half the size
This prevents oversized risk from long signals during volatile moves.
