USDT.D Volatility TrackerUSDT.D Volatility Tracker
Description:
This script is designed to track the volatility of USDT.D (US Dollar in cryptocurrency) on the TradingView platform. It uses a moving average and deviation from it to generate buy and sell signals, helping traders visualize changes in volatility and make informed decisions.
Input Parameters:
maPeriod: The period of the moving average (default 120). This parameter allows users to adjust the length of the period used to calculate the moving average.
devThreshold: The deviation threshold (default 0.6). This parameter defines the level of deviation that will trigger buy or sell signals.
Data Request:
The script requests closing data for USDT.D using the request.security function, allowing it to retrieve up-to-date data on the selected timeframe.
Moving Average and Deviation Calculation:
An exponential moving average (EMA) is used to calculate the deviation from the moving average, enabling the identification of current volatility.
Deviation Line Display:
The deviation rate line is displayed on the chart, allowing users to visually track changes in volatility.
Signal Generation:
If the deviation exceeds the set threshold (devThreshold), a buy signal is generated (green background).
If the deviation falls below the negative threshold (-devThreshold), a sell signal is generated (red background).
Visual Signals:
Buy signals are displayed on the chart as green triangles, while sell signals are displayed as red triangles. This helps traders quickly identify potential entry and exit points.
Tìm kiếm tập lệnh với "track"

Systematic Investment Tracker by Ceyhun Gonul### English Description
**Systematic Investment Tracker with Enhanced Features**
This script, titled **Systematic Investment Tracker with Enhanced Features**, is a TradingView tool designed to support systematic investments across different market conditions. It provides traders with two customizable investment strategies — **Continuous Buying** and **Declining Buying** — and includes advanced dynamic investment adjustment features for each.
#### Detailed Explanation of Script Features and Originality
1. **Two Investment Strategies**:
- **Continuous Buying**: This strategy performs purchases consistently at each interval, as set by the user, regardless of market price changes. It follows the principle of dollar-cost averaging, allowing users to build an investment position over time.
- **Declining Buying**: Unlike Continuous Buying, this strategy triggers purchases only when the asset's price has declined from the previous interval's closing price. This approach helps users capitalize on lower price points, potentially improving average costs during downward trends.
2. **Dynamic Investment Adjustment**:
- For both strategies, the script includes a **Dynamic Investment Adjustment** feature. If enabled, this feature increases the purchasing amount by 50% if the current price has fallen by a specific user-defined percentage relative to the previous price. This allows users to accumulate a larger position when the asset is declining, which may benefit long-term cost-averaging strategies.
3. **Customizable Time Frames**:
- Users can specify a **start and end date** for investment, allowing them to restrict or backtest strategies within a specific timeframe. This feature is valuable for evaluating strategy performance over specific market cycles or historical periods.
4. **Graphical Indicators and Labels**:
- The script provides graphical labels on the chart that display purchase points. These indicators help users visualize their investment entries based on the strategy selected.
- A summary **performance label** is also displayed, providing real-time updates on the total amount spent, accumulated quantity, average cost, portfolio value, and profit percentage for each strategy.
5. **Language Support**:
- The script includes English and Turkish language options. Users can toggle between these languages, allowing the summary label text and descriptions to be displayed in their preferred language.
6. **Performance Comparison Table**:
- An optional **Performance Comparison Table** is available, offering a side-by-side analysis of net profit, total investment, and profit percentage for both strategies. This comparison table helps users assess which strategy has yielded better returns, providing clarity on each approach's effectiveness under the chosen parameters.
#### How the Script Works and Its Uniqueness
This closed-source script brings together two established investment strategies in a single, dynamic tool. By integrating continuous and declining purchase strategies with advanced settings for dynamic investment adjustment, the script offers a powerful, flexible tool for both passive and active investors. The design of this script provides unique benefits:
- Enables automated, systematic investment tracking, allowing users to build positions gradually.
- Empowers users to leverage declines through dynamic adjustments to optimize average cost over time.
- Presents an easy-to-read performance label and table, enabling an efficient and transparent performance comparison for informed decision-making.
---
### Türkçe Açıklama
**Gelişmiş Özellikli Sistematik Yatırım Takipçisi**
**Gelişmiş Özellikli Sistematik Yatırım Takipçisi** adlı bu TradingView scripti, çeşitli piyasa koşullarında sistematik yatırım stratejilerini desteklemek üzere tasarlanmış bir araçtır. Script, kullanıcıya iki özelleştirilebilir yatırım stratejisi — **Sürekli Alım** ve **Düşen Alım** — ve her strateji için gelişmiş dinamik yatırım ayarlama seçenekleri sunar.
#### Script Özelliklerinin Detaylı Açıklaması ve Özgünlük
1. **İki Yatırım Stratejisi**:
- **Sürekli Alım**: Bu strateji, fiyat değişimlerine bakılmaksızın kullanıcının belirlediği her aralıkta sabit bir miktar yatırım yapar. Bu yaklaşım, uzun vadede pozisyonu kademeli olarak oluşturmak isteyenler için idealdir.
- **Düşen Alım**: Sürekli Alım’ın aksine, bu strateji yalnızca fiyat bir önceki aralığın kapanış fiyatına göre düştüğünde alım yapar. Bu yöntem, yatırımcıların daha düşük fiyatlardan alım yaparak ortalama maliyeti potansiyel olarak iyileştirmelerine yardımcı olur.
2. **Dinamik Yatırım Ayarlaması**:
- Her iki strateji için de **Dinamik Yatırım Ayarlaması** özelliği bulunmaktadır. Bu özellik aktif edildiğinde, mevcut fiyatın bir önceki fiyata göre kullanıcı tarafından belirlenen bir yüzde oranında düşmesi durumunda alım miktarını %50 artırır. Bu durum, uzun vadede maliyet ortalaması stratejilerine katkıda bulunur.
3. **Özelleştirilebilir Tarih Aralığı**:
- Kullanıcılar, yatırımı belirli bir tarih aralığında sınırlandırmak veya test etmek için bir **başlangıç ve bitiş tarihi** belirleyebilir. Bu özellik, strateji performansını geçmiş piyasa döngüleri veya belirli dönemlerde değerlendirmek için kullanışlıdır.
4. **Grafiksel İşaretleyiciler ve Etiketler**:
- Script, grafik üzerinde alım noktalarını gösteren işaretleyiciler sağlar. Bu görsel göstergeler, kullanıcıların seçilen stratejiye göre yatırım girişlerini görselleştirmesine yardımcı olur.
- Ayrıca, her strateji için harcanan toplam tutar, biriken miktar, ortalama maliyet, portföy değeri ve kâr yüzdesi gibi bilgileri gerçek zamanlı olarak gösteren bir **performans etiketi** sunar.
5. **Dil Desteği**:
- Script, İngilizce ve Türkçe dillerini desteklemektedir. Kullanıcılar, performans etiketi metninin ve açıklamalarının tercih ettikleri dilde görüntülenmesi için dil seçimini yapabilir.
6. **Performans Karşılaştırma Tablosu**:
- İsteğe bağlı olarak kullanılabilen bir **Performans Karşılaştırma Tablosu**, her iki strateji için net kâr, toplam yatırım ve kâr yüzdesi gibi bilgileri yan yana analiz eder. Bu tablo, kullanıcıların hangi stratejinin daha yüksek getiri sağladığını değerlendirmesine yardımcı olur.
#### Scriptin Çalışma Prensibi ve Özgünlüğü
Bu script, iki yatırım stratejisini gelişmiş bir araçta birleştirir. Sürekli ve düşen fiyatlara dayalı alım stratejilerini dinamik yatırım ayarlama özelliğiyle entegre ederek yatırımcılar için güçlü ve esnek bir çözüm sunar. Script’in tasarımı aşağıdaki benzersiz faydaları sağlamaktadır:
- Otomatik, sistematik yatırım takibi yaparak kullanıcıların pozisyonlarını kademeli olarak oluşturmalarına olanak tanır.
- Dinamik ayarlama ile düşüşlerden yararlanarak zaman içinde ortalama maliyeti optimize etme olanağı sağlar.
- Her iki stratejinin performansını basit ve anlaşılır bir şekilde karşılaştıran etiket ve tablo ile verimli bir performans değerlendirmesi sunar.

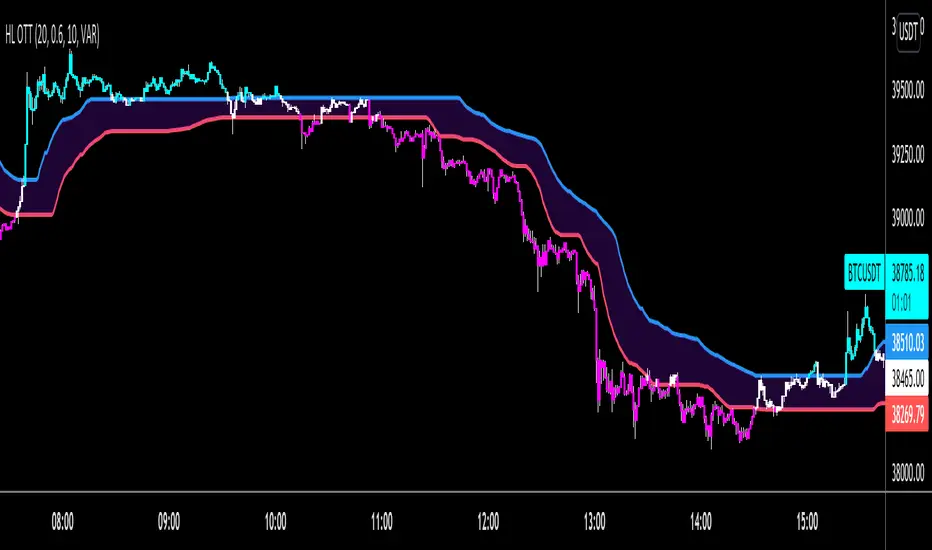
HIGH and LOW Optimized Trend Tracker HOTT LOTTAnıl Özekşi's latest development on his precious OTT - Optimized Trend Tracker:
In this version, there are two lines of OTT which are derived from HIGHEST price values (HOTT) and LOVEST price values (LOTT) which were originally sourced to CLOSE values on default OTT.
Another significant difference is there is no Support Line (Moving Average) in this version.
The area between HOTT and LOTT is FLAT ZONE which developer advises to do nothing.
Bars will be highlighted to Turquoise when candles close over HOTT, means an UPTREND SIGNAL
and to Fuchia when candles begin closing under LOTT line to indicate a DOWNTREND SIGNAL.
FLAT ZONE is highlighted also to have the maximum concentration on sideways market conditions.
There are three quantitative parameters in this indicator:
The first parameter in the OTT indicator set by the two parameters is the period/length.
OTT lines will be much sensitive to trend movements if it is smaller.
And vice versa, will be less sensitive when it is longer.
As the period increases it will become less sensitive to little trends and price actions.
In this way, your choice of period, will be closely related to which of the sort of trends you are interested in.
The OTT percent parameter in OTT is an optimization coefficient. Just like in the period
small values are better at capturing short term fluctuations, while large values
will be more suitable for long-term trends.
The final adjustable quantitative parameter is HIGHEST and LOWEST length which is the source of calculations.
Anıl Özekşi generally works on 1 minute charts so I personally advise traders to optimize parameters to have more accurate signals. Just concentrate on FLAT price zones and indicator will do the rest in trends.
Built in Moving Average type defaultly set as VAR but users can choose from 10 different Moving Average types like:
SMA : Simple Moving Average
EMA : Exponential Moving Average
DEMA : Double Exponential Moving Average
WMA : Weighted Moving Average
TMA : Triangular Moving Average
VAR : Variable Index Dynamic Moving Average a.k.a. VIDYA
WWMA : Welles Wilder's Moving Average
ZLEMA : Zero Lag Exponential Moving Average
TSF : True Strength Force
HULL : Hull Moving Average
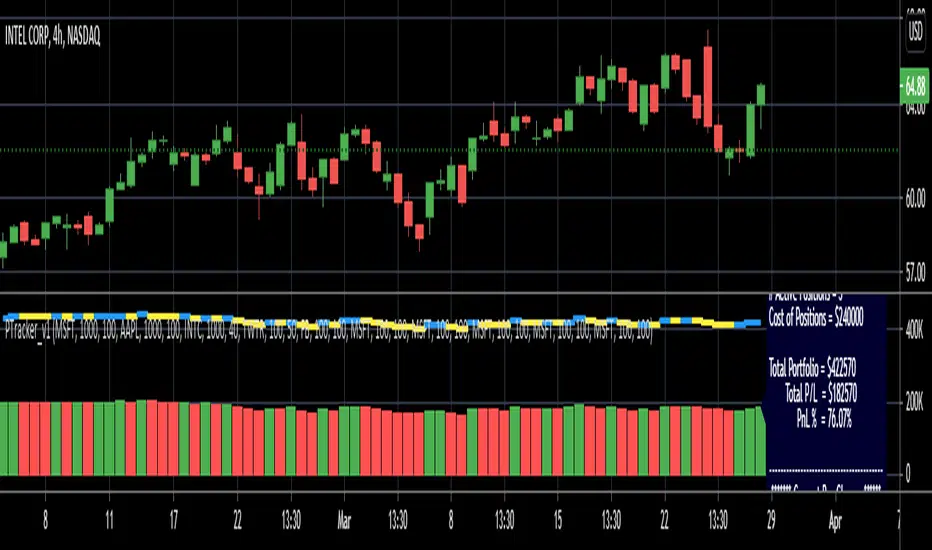
Simple Portfolio TrackerThis is just a simple portfolio tracker that i started to play around with - i'm sure there are smarter ways to do this, but i chose the simpler way :) -- please feel free to use this, or consider it as a starting point to your own indicator.
i will come back later and add some more stuff once i get time. for example, show the total value, recent change, P&L % ..etc
So the simple idea is to track a portfolio of few positions and watch how the total portfolio and the PnL changes over time as the price of the individual holdings move up and down. it can be added to any chart.
The code is currently set to track 5 positions - settings allow to enter if the positions is used or not, symbol, amount and cost price..
** note: more positions can be added by editing the code and copying and pasting the marked "position block" that contains the input statements and the calculations, then changing/replacing the position identifier (_1, _2, ..etc) in all variables with new number..
--- don't forget to add these extra positions you insert in the code to the formula lines that calculate the totals
i tried to make this as easy as possible in the code. the code includes a sample portfolio as default values just to help "demo" how this works
the input is made easy, thanks to the recent addition of the "inline" feature in the input() statement
i don't know if some traders will find this useful ?? or if more about how to use it is needed.. let me know in the comments.. as i mentioned, i was just playing with the idea over the weekend so didn't really put a lot of work into it.
Credits and thanks to @boji1 for inspiring this :)
Session Fibonacci Tracker with Dynamic Range FreezeSession Fibonacci Tracker with Dynamic Range Freeze
This indicator plots Fibonacci retracement and extension levels based on session high/low ranges with a unique "freeze" mechanism that locks levels during volatility and recalculates only when price returns to the established range.
How It Works:
The indicator uses a three-stage process to maintain stable Fibonacci levels:
Range Establishment: At the start of each session (default 1800 ET), the indicator tracks the session high and low. Fibonacci levels are calculated with dynamic anchoring - when price is above the session open, 0 anchors at the high with 1 at the low; when below, 0 anchors at the low with 1 at the high.
Freeze Mechanism: Once the range is established, it immediately freezes. If a candle closes outside this range, the Fibonacci levels remain locked at their current values even as new session highs or lows form. This prevents levels from constantly recalculating during trending moves.
Recalculation: The frozen range only updates when price action (high or low) touches back inside the established range. At this point, levels recalculate based on the current session high/low, then freeze again.
Key Features:
Customizable Fibonacci levels: All retracement (0.236, 0.382, 0.500, 0.618, 0.786) and extension levels (-1.0, -0.618, -0.272, 1.272, 1.618, 2.0) can be enabled/disabled and adjusted to custom values
Time-based line extension prevents historical buffer overflow errors
Works across all timeframes
Session start time fully customizable
Visual status indicator shows whether levels are frozen or active
All lines and labels are fully customizable (colors, width, labels, prices)
Use Cases:
This indicator is particularly useful for traders who want stable reference levels during volatile periods. Traditional Fibonacci tools recalculate with every new extreme, making them difficult to use as support/resistance during trends. This implementation keeps levels stable until price returns to consolidation, providing consistent reference points for entries, exits, and stop placement.
Settings:
Session Settings: Configure session start time (default 1800 ET)
Fibonacci Levels: Enable/disable and customize each retracement level value
Extension Levels: Enable/disable and customize each extension level value
Visual Settings: Adjust line extension, width, labels, and price display
Colors: Customize colors for open line, 0 level, 1 level, retracements, and extensions

Directional Candle Size TrackerThis indicator measures the strength of bullish and bearish momentum by tracking the average size of candles — but only when they’re moving in the intended direction.
🟢 Bullish Strength rises when green candles expand in size
🔴 Bearish Strength rises when red candles grow in size
When the market pauses or flips direction, the opposing line flatlines, preserving the last value
Unlike traditional moving averages that blend all candles together, this tracker isolates directional pressure, giving you a clearer read on which side is truly in control. It’s especially useful for spotting momentum decay, trap setups, and regime transitions.
Use it to:
Confirm breakout strength
Detect fading conviction
Compare bullish vs. bearish aggression in real time

Average Daily Range TrackerAverage Daily Range Tracker
This indicator helps you measure volatility in real time by tracking the Average Daily Range (ADR) and comparing it to the current day’s price action.
🔑 Features
Calculates the ADR over a user-defined lookback period (default = 14 days).
Displays today’s developing range (High–Low) as the session unfolds.
Shows what % of the ADR has already been consumed intraday.
Visual progress bar makes it easy to see how close today is to its historical average range.
Optional ADR plot available in a separate pane.
📈 How traders use it
Spot when a market has already made its “typical” daily move.
Adjust intraday trade expectations: avoid chasing after the bulk of the move is done.
Use % of ADR consumed as a volatility filter for setups.
Combine with support/resistance to identify exhaustion zones.
⚙️ Customization
Lookback length for ADR calculation.
Progress bar size and color.
Optional toggle to plot ADR in its own panel.

Apex Edge - London Open Session# Apex Edge - London Open Session Trading System
## Overview
The London Open Session indicator captures institutional price action during the first hour of the London forex session (8:00-9:00 AM GMT) and identifies high-probability breakout and retest opportunities. This system tracks the session's high/low range and generates precise entry signals when price breaks or retests these key institutional levels.
## Core Strategy
**Session Tracking**: Automatically identifies and marks the London Open session boundaries, creating a trading zone from the first hour's price range.
**Dual Entry Logic**:
- **Breakout Entries**: Triggers when price closes beyond the session high/low and continues in that direction
- **Retest Entries**: Activates when price returns to test the broken level as new support/resistance
**Performance Analytics**: Built-in win rate tracking displays real-time performance statistics over user-defined lookback periods, enabling data-driven optimization for each currency pair.
## Key Features
### Automated Zone Detection
- Precise London session timing with timezone offset controls
- Visual session boundaries with customizable colours
- Automatic high/low range calculation and display
### Smart Entry System
- Breakout confirmation requiring candle close beyond zone
- Retest detection with configurable pip distance tolerance
- Separate risk/reward ratios for breakout vs retest entries
- Visual entry arrows with clear trade direction labels
### Performance HUD
- Real-time win rate calculation over customizable periods (7-365 days)
- Total trades tracking with win/loss breakdown
- Average risk-reward ratio display
- Color-coded performance metrics (green >70%, yellow >50%, red <50%)
### PineConnector Integration
- Direct MT4/MT5 execution via PineConnector alerts
- Proper forex pip calculations for all currency pairs
- Customizable risk percentage per trade
- Symbol override capability for broker compatibility
- Automatic SL/TP level calculation in pips
## Critical Usage Requirements
### Pair-Specific Optimization
Each currency pair requires individual optimization due to varying volatility characteristics, institutional participation levels, and typical price ranges during London hours. The performance HUD is essential for identifying optimal settings before live trading.
**Recommended Testing Process**:
1. Apply indicator to desired currency pair and timeframe
2. Experiment with session timing - while 8:00-9:00 AM GMT is standard, some pairs may show improved performance with alternative hourly windows (e.g., 7:00-8:00 AM or 9:00-10:00 AM)
3. Adjust Stop Loss distances, Risk/Reward ratios, and Retest distances
4. Monitor win rate over 30+ day periods using the performance HUD
5. Only proceed with live alerts once consistent 60%+ win rates are achieved
6. Create separate optimized chart setups for each profitable pair/timeframe combination
### Timeframe Specifications
This indicator is specifically designed and tested for:
- **1-minute charts**: Optimal for capturing immediate institutional reactions
- **5-minute charts**: Balanced approach between noise reduction and opportunity frequency
Higher timeframes generally produce inferior results due to increased noise and reduced institutional edge during the London session window.
## Settings Configuration
### Session Timing
- **London Open/Close Hours**: Adjust for your chart's timezone
- **Rectangle End Time**: Set to 4:30 PM to stop signals before NY session close
- **Timezone Offset**: Ensure accurate London session capture
### Entry Parameters
- **Retest Distance**: 3-8 pips depending on pair volatility
- **Stop Loss Pips**: Separate settings for breakouts (10-15 pips) and retests (8-12 pips)
- **Risk/Reward Ratios**: Independent ratios for different entry types
### PineConnector Setup
- **License ID**: Your PineConnector license key
- **Symbol Override**: MT4/MT5 symbol names if different from TradingView
- **Risk Percentage**: Position size as percentage of account balance
- **Prefix/Comment**: Organize trades in terminal
## Manual Trading Limitations
Without PineConnector automation, traders face significant practical challenges:
**Settings Management**: Each currency pair requires different optimized parameters. Switching between charts means manually adjusting multiple settings each time, creating potential for errors and missed opportunities.
**Timing Sensitivity**: London Open signals can occur rapidly during high-volatility periods. Manual execution may result in slippage or missed entries.
**Multi-Pair Monitoring**: Tracking 4-11 currency pairs simultaneously while manually adjusting settings for each switch becomes impractical for most traders.
**Parameter Consistency**: Risk of using suboptimal settings when quickly switching between pairs, potentially compromising the careful optimization work.
## Recommended Workflow
1. **Historical Testing**: Use win rate HUD to identify profitable pairs and optimal parameters
2. **Demo Automation**: Test PineConnector alerts on demo accounts with optimized settings
3. **Live Implementation**: Deploy alerts only on proven profitable pair/timeframe combinations
4. **Ongoing Monitoring**: Regular review of performance metrics to maintain edge
## Risk Disclaimer
This indicator provides analysis tools and automation capabilities but does not guarantee profitable trading outcomes. Past performance does not predict future results. Users should thoroughly backtest and demo trade before risking live capital. The London session strategy works best during specific market conditions and may underperform during low volatility or unusual market environments.
## Support Requirements
Successful implementation requires:
- Basic understanding of London session market dynamics
- PineConnector subscription for automation features
- Patience for proper optimization process
- Realistic expectations about win rates and drawdown periods
This system is designed for serious traders willing to invest time in proper optimization and risk management rather than plug-and-play solutions.

[blackcat] L2 Multi-Level Price Condition TrackerOVERVIEW
The L2 Multi-Level Price Condition Tracker represents an innovative approach to analyzing financial markets by simultaneously monitoring multiple price levels, thus providing traders with a holistic view of market dynamics. By combining dynamic calculations based on moving averages and price deviations, this tool aims to deliver precise and actionable insights into potential entry and exit points. It leverages sophisticated statistical measures to identify key thresholds that signify shifts in market sentiment, thereby aiding traders in making well-informed decisions. 🎯
Key benefits encompass:
• Comprehensive calculation of midpoints and average prices indicating short-term trend directions.
• Interactive visualization elements enhancing interpretability effortlessly.
• Real-time generation of buy/sell signals driven by precise condition evaluations.
TECHNICAL ANALYSIS COMPONENTS
📉 Midpoint Calculations:
Computes central reference points derived from high-low ranges establishing baseline supports/resistances.
Utilizes Simple Moving Averages (SMAs) along with standardized deviation formulas smoothing out volatility while preserving long-term trends accurately.
Facilitates identification of directional biases reflecting underlying market forces dynamically.
🕵️♂️ Advanced Price Level Detection:
Derives upper/lower bounds adjusting sensitivities adaptively responding to changing conditions flexibly.
Employs proprietary logic distinguishing between bullish/bearish sentiments promptly signaling transitions effectively.
Ensures consistent adherence to predefined statistical protocols maintaining accuracy robustly.
🎥 Dynamic Signal Generation:
Detects crossovers indicating dominance shifts between buyers/sellers promptly triggering timely alerts.
Integrates conditional logic reinforcing signal validity minimizing erroneous activations systematically.
Supports adaptive thresholds tuning sensitivities based on evolving market conditions flexibly accommodating varying scenarios.
INDICATOR FUNCTIONALITY
🔢 Core Algorithms:
Utilizes moving averages alongside standardized deviation formulas generating precise net volume measurements.
Implements Arithmetic Mean Line Algorithm (AMLA) smoothing techniques improving interpretability.
Ensures consistent alignment with established statistical principles preserving fidelity.
🖱️ User Interface Elements:
Dedicated plots displaying real-time midpoint markers facilitating swift decision-making.
Context-sensitive color coding distinguishing positive/negative deviations intuitively highlighting key activations clearly.
Background shading emphasizing proximity to crucial threshold activations enhancing visibility focusing attention on vital signals promptly.
STRATEGY IMPLEMENTATION
✅ Entry Conditions:
Confirm bullish/bearish setups validated through multiple confirmatory signals assessing concurrent market sentiment factors.
Validate entry decisions considering alignment between calculated midpoints and broader trend directions ensuring coherence.
Monitor cumulative breaches signifying potential trend reversals executing partial/total closes contingent upon predetermined loss limits preserving capital efficiently.
🚫 Exit Mechanisms:
Trigger exits upon hitting predefined thresholds derived from historical analyses promptly executing closures.
Execute partial/total closes contingent upon cumulative loss limits preserving capital efficiently managing exposures prudently.
Conduct periodic reviews gauging strategy effectiveness rigorously identifying areas needing refinement implementing corrective actions iteratively enhancing performance metrics steadily.
PARAMETER CONFIGURATIONS
🎯 Optimization Guidelines:
Lookback Period: Governs responsiveness versus stability balancing sensitivity/stability governing moving averages aligning with preferred granularity.
Price Source: Dictates primary data series driving volume calculations selecting relevant inputs accurately tailoring strategies accordingly.
💬 Customization Recommendations:
Commence with baseline defaults; iteratively refine parameters isolating individual impacts evaluating adjustments independently prior to combined modifications minimizing disruptions.
Prioritize minimizing erroneous trigger occurrences first optimizing signal fidelity sustaining balanced risk-reward profiles irrespective of chosen settings upholding disciplined approaches preserving capital efficiently.
ADVANCED RISK MANAGEMENT
🛡️ Proactive Risk Mitigation Techniques:
Enforce strict compliance with pre-defined maximum leverage constraints adhering strictly to guidelines managing exposures prudently.
Mandatorily apply trailing stop-loss orders conforming to script outputs enforcing discipline rigorously preventing adverse consequences.
Allocate positions proportionately relative to available capital reserves conducting periodic reviews gauging effectiveness continuously identifying improvement opportunities steadily.
⚠️ Potential Pitfalls & Solutions:
Address frequent violations arising during heightened volatility phases necessitating manual interventions judiciously preparing contingency plans proactively mitigating risks effectively.
Manage false alerts warranting immediate attention avoiding adverse consequences systematically implementing corrective actions reliably.
Prepare proactive responses amid adverse movements ensuring seamless functionality amidst fluctuating conditions fortifying resilience against anomalies robustly.
PERFORMANCE MONITORING METRICS
🔍 Evaluation Criteria:
Assess win percentages consistently across diverse trading instruments gauging reliability measuring profitability efficiency accurately evaluating downside risks comprehensively uncovering systematic biases potentially skewing outcomes.
Calculate average profit ratios per successful execution benchmarking actual vs expected performances documenting results meticulously tracking progress dynamically addressing identified shortcomings proactively fostering continuous improvements.
📈 Historical Data Analysis Tools:
Maintain detailed logs capturing every triggered event recording realized profits/losses comparing simulated projections accurately identifying discrepancies warranting investigation implementing iterative refinements steadily enhancing performance metrics progressively.
Identify recurrent systematic errors demanding corrective actions implementing iterative refinements steadily addressing identified shortcomings proactively fostering continuous enhancements dynamically improving robustness resiliently.
PROBLEM SOLVING ADVICE
🔧 Frequent Encountered Challenges:
Unpredictable behaviors emerging within thinly traded markets requiring filtration processes enhancing signal integrity excluding low-liquidity assets prone to erratic movements effectively.
Latency issues manifesting during abrupt price fluctuations causing missed opportunities introducing buffer intervals safeguarding major news/event impacts mitigating distortions seamlessly verifying reliable connections ensuring uninterrupted data flows guaranteeing accurate interpretations dependably.
💡 Effective Resolution Pathways:
Limit ongoing optimization attempts preventing model degradation maintaining optimal performance levels consistently recalibrating parameters periodically adapting strategies flexibly responding appropriately amidst varying conditions dynamically improving robustness resiliently.
Verify reliable connections ensuring uninterrupted data flows guaranteeing accurate interpretations dependably bolstering overall efficacy systematically addressing identified shortcomings dynamically fostering continuous advancements.
THANKS
Heartfelt acknowledgment extends to all developers contributing invaluable insights regarding multi-level price condition-based trading methodologies! ✨

Consecutive Green Candles + 20% Move ScreenerConsecutive Green Candles Momentum Tracker
This indicator identifies powerful bullish momentum streaks in stocks, highlighting opportunities where consistent buying pressure has driven significant price increases.
The script tracks sequences of consecutive green (bullish) candles that collectively move a stock's price by more than 20%. It marks both the beginning of such streaks with a green label and their conclusion with a red arrow when price momentum finally reverses.
Perfect for traders looking to:
- Identify stocks experiencing strong directional momentum
- Spot potential reversal points after extended rallies
- Screen for securities with recent bullish strength
- Understand the magnitude of recent price runs
Simply adjust the minimum number of candles and percentage threshold to match your preferred momentum criteria.

Umesh BC IST 3:30 AM Session Tracker + 4H Candles📌 IST 3:30 AM Session Tracker + 4H Candle Marker
This indicator is designed for traders who follow Indian Standard Time (IST) and want precise session tracking and 4H candle insights.
🔧 Features:
🕒 Daily Session Start at 3:30 AM IST
Automatically detects and marks the beginning of each new trading day based on 3:30 AM IST, not midnight.
Displays session Open, High, and Low lines.
Background shading for each session.
Customizable alert when a new day starts.
🟧 4H Candle Start Markers (IST Time)
Identifies every new 4-hour candle that starts at:
3:30, 7:30, 11:30, 3:30 PM, 7:30 PM, 11:30 PM IST
Adds a vertical line and label ("🟧 4H") above the candle.
Plots a dynamic line for the 4H candle's opening price.
Includes optional alert for new 4H candles.
🔔 Alerts Included:
"🕒 New IST Day Start": Triggers at 3:30 AM IST.
"🟧 New 4H Candle": Triggers at each 4H candle start (IST).
✅ Best for:
Intraday, swing, and institutional traders using IST-based analysis.
Those wanting more accurate daily sessions and clear candle structuring.

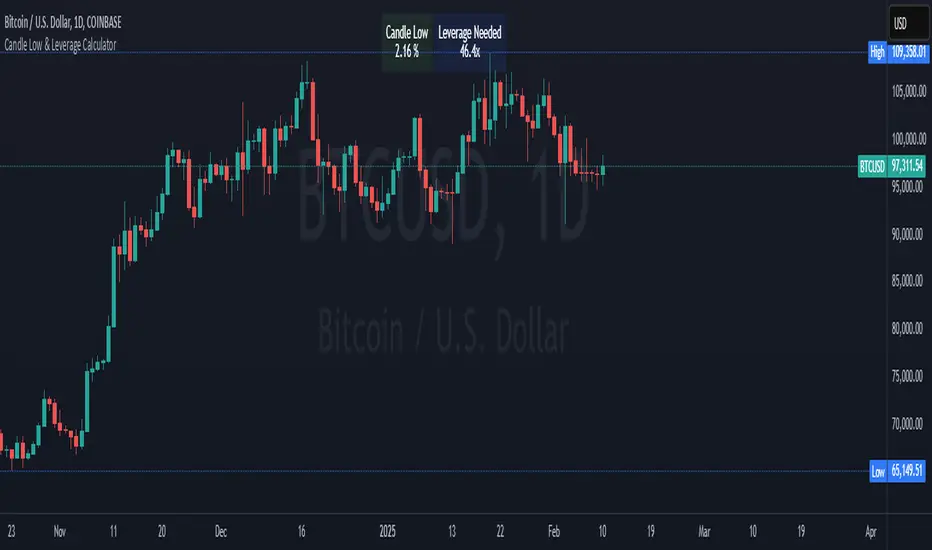
Crypto Candle Low Leverage TrackerCrypto Candle Low Leverage Tracker
The Candle Low Leverage Indicator is a powerful tool for long position traders seeking to manage risk effectively when using leverage. By evaluating the current candle's low price, this indicator helps traders make more informed decisions about potential entry points, stop losses, and leverage levels. The indicator matches the low of the candle to the leverage needed for liquidation, giving you a clear view of how leverage impacts your position.
This indicator provides two critical insights:
% from Candle Low: Tracks how much the price has moved from the low of the current candle. For long position traders, this percentage is crucial for understanding how far the price has come off the low and deciding whether it’s safe to enter a position or if further price action is needed.
Leverage Needed: Estimates the leverage required to reach the candle's low as the liquidation price. Long traders can use this information to adjust leverage to a safer level, ensuring they don’t overexpose themselves to liquidation risks by matching leverage to the candle’s low.
Key Features:
Customizable table positioning (top, middle, bottom).
Toggle options to show/hide % from Candle Low and Leverage Needed.
Visual indicators with color changes: green for positive change, red for negative change, and blue for leverage requirements.
Ideal for long traders, this tool helps evaluate market conditions, manage risks, and calculate the best leverage to use in long trades, ensuring that leverage aligns with the candle’s low to prevent unnecessary liquidations.
Market Cap & Volume Tracker with TrendsMarket Cap & Volume Tracker with Trends
This indicator provides a compact, at-a-glance view of key market data directly on your chart, specifically focusing on Market Cap, Volume, and Volume Trends over various time intervals. It helps traders and investors monitor price action and volume shifts in real-time.
Key Features:
Market Cap: Displays the market capitalization of the selected asset, calculated as the Close Price multiplied by Volume, and formatted in Millions (M).
Volume Data: Shows the volume for:
Pre-market (the volume before the main market session starts)
Current Volume (real-time volume during the current session)
After-hours Volume (volume traded after the market closes)
All volumes are formatted in Thousands (K) for easy readability.
Volume Trends: Monitors volume movement across multiple time intervals:
15-Minutes
30-Minutes
45-Minutes
1 Hour
The indicator tracks whether the volume is Increasing or Decreasing in each of these time frames to help identify trends and potential market shifts.
Customization:
Easily adjustable colors for the table background, text, and header for clear visibility and user preferences.
Option to choose the display position of the table (top or bottom right corner).
Use Case:
This indicator is ideal for traders who want quick insights into the market's activity without the need to look at multiple charts or external data points. It helps spot volume changes and trends over various time frames and supports decision-making for entries, exits, and overall market sentiment.

Risk TrackerThis Risk Tracker Pine Script provides traders with a customizable tool for tracking and managing trade risk directly on their chart. The script is designed to accommodate both futures and crypto trades, allowing you to monitor risk and reward parameters, adjust contract sizes, and manage leverage in real-time.
Key Features:
1. Trade Direction and Risk-Reward Ratio:
• Select between Long or Short trade directions.
• Set a custom Risk-Reward Ratio (RRR) to calculate potential profit and loss levels based on your trade setup.
2. Customizable Parameters:
• Input fields for contract size, leverage, margin, and maximum drawdown allow you to adjust the risk settings depending on the market you are trading.
• You can toggle between using a dollar-based or percentage-based risk calculation depending on whether you’re trading futures (USD-based) or crypto.
3. Real-time Stop-Loss and Take-Profit Calculation:
• The script automatically calculates and draws the Stop-Loss (SL) and Take-Profit (TP) levels on the chart based on your entry price and selected risk settings.
• The color of the SL and TP lines is customizable, allowing you to visually distinguish profit and loss levels.
4. Historical Price Levels:
• If there is no active trade, the script scans historical price data to find the last instances when the price hit the predefined stop-loss or take-profit levels, helping you understand past price behavior.
5. Risk Management Table:
• A summary table is displayed on the chart, showing the key metrics of your trade, including:
• Tick value and Dollar value for futures.
• Margin and Leverage for crypto.
• Risk-Reward Ratio, Entry price, Risk and Profit in USD or percentage terms.
• The table dynamically updates based on the current trade status.
6. Extended Chart Visualization:
• Option to extend the SL and TP lines to the left of the chart, allowing you to easily view these levels across multiple timeframes and bars.
This script helps ensure you are always aware of your trade’s risk profile, providing a clear and visual representation of potential profit and loss, both in terms of percentage and dollar value. Ideal for futures and crypto traders who rely on precise risk management to maintain profitability.

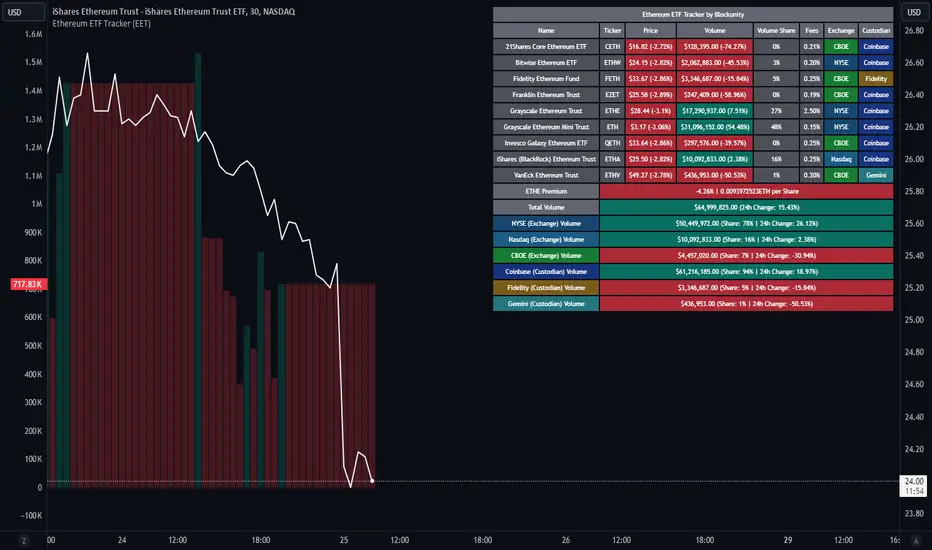
Ethereum ETF Tracker (EET)Get all the information you need about all the different Ethereum ETF.
With the Ethereum ETF Tracker, you can observe all possible Ethereum ETF data:
ETF name.
Ticker.
Price.
Volume.
Share of total ETF volume.
Fees.
Exchange.
Custodian.
At the bottom of the table, you'll find the ETHE Premium (and ETH per Share), and day's total volume.
In addition, you can see the volume for the different Exchanges, as well as for the different Custodians.
If you don't want to display these lines to save space, you can uncheck "Show Additional Data" in the indicator settings.
The Idea
The goal is to provide the community with a tool for tracking all Ethereum ETF data in a synthesized way, directly in your TradingView chart.
How to Use
Simply read the information in the table. You can hover above the Fees and Exchanges cells for more details.
The table takes space on the chart, you can remove the extra lines by unchecking "Show Additional Data" in the indicator settings or reduce text size by changing the "Table Text Size" parameter.
Aggregate volume can be displayed directly on the graph (this volume can be displayed on any asset, such as Ethereum itself). The display can be disabled in the settings.
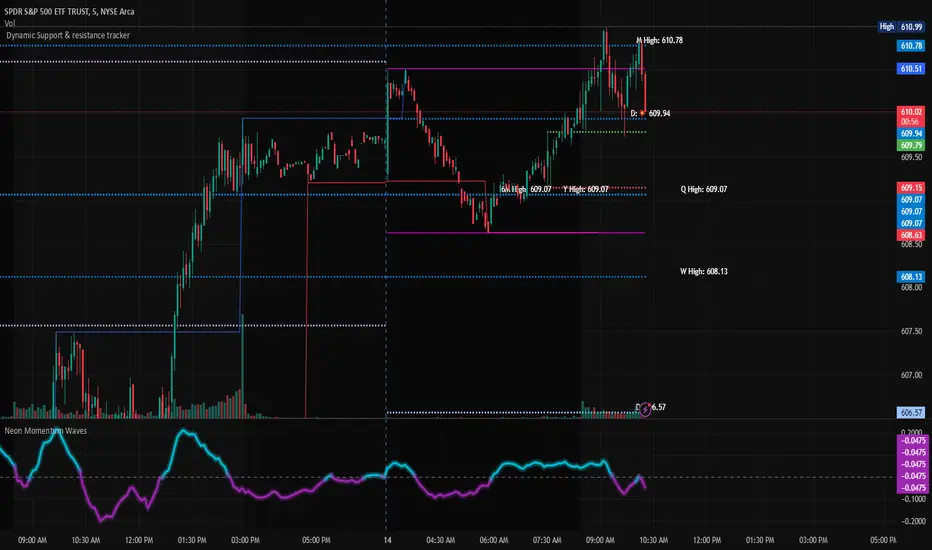
Dynamic Support & Resistance TrackerThe "Dynamic Support & Resistance Tracker" is a powerful Pine Script study designed to identify and visualize key support and resistance levels on a trading chart. This study dynamically adjusts to market conditions, providing traders with valuable insights for making informed trading decisions.
Key Features:
Dynamic Support & Resistance Lines:
The script identifies and plots support and resistance levels using pivot points based on a user-defined number of left and right bars.
Resistance lines are plotted in red, while support lines are plotted in blue, making it easy to distinguish between the two.
Toggle Breaks:
Users can choose to display or hide break signals for support and resistance levels using a simple toggle input.
Volume Threshold:
The study includes daily and weekly high and low calculations to provide a comprehensive view of market ranges.
Previous high and low lines are plotted for both daily and weekly timeframes, aiding in identifying potential breakout or breakdown levels.
Regular Market Hours:
The script defines regular market hours and tracks sessions, ensuring that support and resistance levels are relevant to active trading periods.
Midline and Extension Lines:
The study calculates and plots a midline between the previous high and low, along with extension lines above and below the range. These lines help identify potential target levels and extensions beyond the current range.
Real-time Updates:
The script ensures that all lines are updated in real-time, adjusting to new bars as they form. This dynamic feature keeps the levels relevant and accurate throughout the trading session.
Usage Instructions:
Adjust the number of left and right bars to define the sensitivity of the support and resistance levels.
Toggle the display of break signals to highlight significant breaks in support or resistance.
Monitor the daily and weekly high and low lines to understand the broader market context.
Utilize the midline and extension lines to set potential price targets and manage risk effectively.
This study provides traders with a robust tool for identifying and reacting to key market levels, enhancing their trading strategies with dynamic and real-time insights.
Periodic Activity Tracker [LuxAlgo]The Periodic Activity Tracker tool periodically tracks the cumulative buy and sell volume in a user-defined period and draws the corresponding matching bars and volume delta for each period.
Users can select a predefined aggregation period from the following options: Hourly, Daily, Weekly, and Monthly.
🔶 USAGE
This tool provides a simple and clear way of analyzing volumes for each aggregated period and is made up of the following elements:
Buy and sell volumes by period as red and green lines with color gradient area
Delta (difference) between buy & sell volume for each period
Buy & sell volume bars for each period
Separator between lines and bars, and period tags below each pair of bars for ease of reading
On the chart above we can see all the elements displayed, the volume level on the lines perfectly matches the volume level on the bars for each period.
In this case, the tool has the default settings so the anchor period is set to Daily and we can see how the period tag (each day of the week) is displayed below each pair of bars.
Users can disable the delta display and adjust the bar size.
🔹 Reading The Tool
In trading, assessing the strength of the bulls (buyers) and bears (sellers) is key to understanding the current trading environment. Which side, if any, has the upper hand? To answer this question, some traders look at volume in relation to price.
This tool provides you with a view of buy volume versus sell volume, allowing you to compare both sides of the market.
As with any volume tool, the key is to understand when the forces of the two groups are balanced or unbalanced.
As we can observe on the chart:
NOV '23: Buy volume greater than sell volume, both moving up close together, flat delta. We can see that the price is in range.
DEC '23: Buy volume bigger than Sell volume, both moving up but with a bigger difference, bigger delta than last month but still flat. We can see the price in the range above last month's range.
JAN '24: Buy and sell volume tied together, no delta whatsoever. We can see the price in range but testing above and below last month's range.
FEB '24: Buy volume explodes higher and sell volume cannot keep up, big growing delta. Price explodes higher above last month's range.
Traders need to understand that there is always an equal number of buyers and sellers in a liquid market, the quality here is how aggressive or passive they are. Who is 'attacking' and who is 'defending', who is using market orders to move prices, and who is using limit orders waiting to be filled?
This tool gives you the following information:
Lines: if the top line is green, the buyers are attacking, if it is red, the sellers are attacking.
Delta: represents the difference in their strength, if it is above 0 the buyers are stronger, if it is below 0 the sellers are stronger.
Bars: help you to see the difference in strength between buyers and sellers for each period at a glance.
🔹 Anchor Period
By default, the tool is set to Hourly. However, users can select from a number of predefined time periods.
Depending on the user's selection, the bars are displayed as follows:
Hourly : hours of the current day
Daily : days of the current week
Weekly : weeks of the current month
Monthly : months of the current year
On the chart above we can see the four periods displayed, starting at the top left and moving clockwise we have hourly, daily, weekly, and monthly.
🔶 DETAILS
🔹 Chart TimeFrame
The chart timeframe has a direct impact on the visualization of the tool, and the user should select a chart timeframe that is compatible with the Anchor period in the tool's settings panel.
For the chart timeframe to be compatible it must be less than the Anchor period parameter. If the user selects an incompatible chart timeframe, a warning message will be displayed.
As a rule of thumb, the smaller the chart timeframe, the more data the tool will collect, returning indications for longer-term price variations.
These are the recommended chart timeframes for each period:
Hourly : 5m charts or lower
Daily : 1H charts or lower
Weekly : 4H charts or lower
Monthly : 1D charts or lower
🔹 Warnings
This chart shows both types of warnings the user may receive
At the top, we can see the warning that is given when the 'Bar Width' parameter exceeds the allowed value.
At the bottom is the incompatible chart timeframe warning, which prompts the user to select a smaller chart timeframe or a larger "Anchor Period" parameter.
🔶 SETTINGS
🔹 Data Gathering
Anchor period: Time period representing each bar: hours of the day, days of the week, weeks of the month, and months of the year. The timeframe of the chart must be less than this parameter, otherwise a warning will be displayed.
🔹 Style
Bars width: Size of each bar, there is a maximum limit so a warning will be displayed if it is reached.
Volume color
Delta: Enable/Disable Delta Area Display

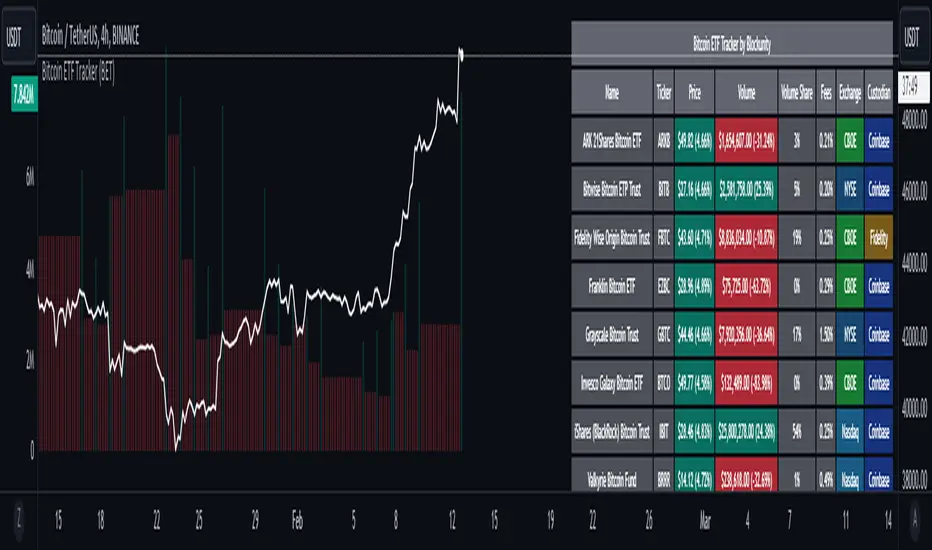
Bitcoin ETF Tracker (BET)Get all the information you need about all the different Bitcoin ETFs.
With the Bitcoin ETF Tracker, you can observe all possible Bitcoin ETF data:
The ETF name.
The ticker.
The price.
The volume.
The share of total ETF volume.
The ETF fees.
The exchange and custodian.
At the bottom of the table, you'll find the day's total volume.
In addition, you can see the volume for the different Exchanges, as well as for the different Custodians.
If you don't want to display these lines to save space, you can uncheck "Show Additional Data" in the indicator settings.
The Idea
The goal is to provide the community with a tool for tracking all Bitcoin ETF data in a synthesized way, directly in your TradingView chart.
How to Use
Simply read the information in the table. You can hover above the Fees and Exchanges cells for more details.
The table takes space on the chart, you can remove the extra lines by unchecking "Show Additional Data" in the indicator settings or reduce text size by changing the "Table Text Size" parameter.
Upcoming Features
As soon as we have a little more history, we'll add variation rates as well as plots to observe the breakdown between the various Exchanges and Custodians.
5 Day ADR ICT Intraday Tracker + Timeframes, Alerts, BarcolorsThis indicator gives you a hint on hypothetical room left for a trade by tracking todays current range as a percentage of the 5 Day ADR.
Look for entries in yellow and orange zones and exits on dark blue once the ADR is reached.
I just added a Timeframe, Alerts for High and Low Zones and an option to colorize the Bars/Candles to "5 Day ADR ICT Intraday Tracker" by BryceWH
RSI Season Tracker by KrisWatersSeason tracker identifies the momentum with tracking dominance and market capitalization data of Bitcoin , Altcoin and USDT .
With this indicator you can able to get know about Bitcoin, Altcoin and USDT dominance and market capitalization easily.
Backgrond Color Definations:
If the background color of indicator is ORANGE means that Bitcoin dominance is the most powerful. It is a good sign for Bitcoin.
If the background color of indicator is BLUE means that Altcoin dominance is the most powerful. It is a good sign for Altcoins.
If the background color of indicator is GREEN means that USDT dominance is the most powerful. It is a good sign for USDT.
Plus Sign (+) Meaning and Color Definations:
If ORANGE plus sign is visible on indicator means that market capitalization of Bitcoin is increasing. It is a good sign for Bitcoin.
If BLUE plus sign is visible on indicator means that market capitalization of Altcoin is increasing. It is a good sign for Altcoins.
If GREEN plus sign is visible on indicator means that market capitalization of Bitcoin and Altcoins are decreasing. It is not a good sign for both.
Light and Dark RSI Line Color Definations:
If the line of Bitcoin color is Orange means that, RSI value was increased compared with previous bar. It is one of the good sign of the momentum strength.
If the line of Bitcoin color is Yellow means that, RSI value was decreased compared with previous bar. It is not a good sign.
If the line of Altcoin color is Navy means that, RSI value was increased compared with previous bar. It is one of the good sign of the momentum strength.
If the line of Altcoin color is Blue means that, RSI value was decreased compared with previous bar. It is not a good sign.
If the line of USDT color is Green means that, RSI value was increased compared with previous bar. It is one of good the sign of the momentum strength.
If the line of USDT color is Lime means that, RSI value was decreased compared with previous bar. It is not a good sign.
Simple RSI rules are valid for this indicator.
RSI value is under 30 indicates that asset is OVERSOLD .
RSI value is upper 70 indicates that asset is OVERBOUGHT .
Important Notice: Dominance data is not correlated with price. For example; sometimes dominance is increasing but the price is not. And that's where the market capitalization comes in.
If the plus sign is not visible , you can get questioning for the movement. It is not a good sign at all.
If the plus sign is visible and RSI is increasing , It is a good sign for the strength of assets movement.
I recommended to use on DAILY timeframe . But you can use different timeframes as well.
Please leave comment below If you have any question or development idea.

Trend Tracker By Prem This Script tracks change of trend and Works as a leading indicator. If anyone interested in further modifying its script please do so and share with everyone with the same name as Trend Tracker By Prem

Relative Performance Tracker [QuantAlgo]🟢 Overview
The Relative Performance Tracker is a multi-asset comparison tool designed to monitor and rank up to 30 different tickers simultaneously based on their relative price performance. This indicator enables traders and investors to quickly identify market leaders and laggards across their watchlist, facilitating rotation strategies, strength-based trading decisions, and cross-asset momentum analysis.
🟢 Key Features
1. Multi-Asset Monitoring
Track up to 30 tickers across any market (stocks, crypto, forex, commodities, indices)
Individual enable/disable toggles for each ticker to customize your watchlist
Universal compatibility with any TradingView symbol format (EXCHANGE:TICKER)
2. Ranking Tables (Up to 3 Tables)
Each ticker's percentage change over your chosen lookback period, calculated as:
(Current Price - Past Price) / Past Price × 100
Automatic sorting from strongest to weakest performers
Rank: Position from 1-30 (1 = strongest performer)
Ticker: Symbol name with color-coded background (green for gains, red for losses)
% Change: Exact percentage with color intensity matching magnitude
For example, Rank #1 has the highest gain among all enabled tickers, Rank #30 has the lowest (or most negative) return.
3. Histogram Visualization
Adjustable bar count: Display anywhere from 1 to 30 top-ranked tickers (user customizable)
Bar height = magnitude of percentage change.
Bars extend upward for gains, downward for losses. Taller bars = larger moves.
Green bars for positive returns, red for negative returns.
4. Customizable Color Schemes
Classic: Traditional green/red for intuitive interpretation
Aqua: Blue/orange combination for reduced eye strain
Cosmic: Vibrant aqua/purple optimized for dark mode
Custom: Full personalization of positive and negative colors
5. Built-In Ranking Alerts
Six alert conditions detect when rankings change:
Top 1 Changed: New #1 leader emerges
Top 3/5/10/15/20 Changed: Shifts within those tiers
🟢 Practical Applications
→ Momentum Trading: Focus on top-ranked assets (Rank 1-10) that show strongest relative strength for trend-following strategies
→ Market Breadth Analysis: Monitor how many tickers are above vs. below zero on the histogram to gauge overall market health
→ Divergence Spotting: Identify when previously leading assets lose momentum (drop out of top ranks) as potential trend reversal signals
→ Multi-Timeframe Analysis: Use different lookback periods on different charts to align short-term and long-term relative strength
→ Customized Focus: Adjust histogram bars to show only top 5-10 strongest movers for concentrated analysis, or expand to 20-30 for comprehensive overview

Coins Trend Tracker HTThe Coins Trend Tracker HT script provides a powerful tool for monitoring and comparing the trend signals of multiple cryptocurrencies based on their Exponential Moving Averages (EMAs). This script is particularly useful for traders who want to keep track of multiple coins across different timeframes and identify potential trading opportunities based on EMA crossovers.
Features:
Customizable Coin Selection: Users can select up to four different cryptocurrencies to monitor.
Flexible Timeframes: Users can choose two different timeframes for EMA calculations to suit their trading strategies.
Visual Trend Indicators: The script displays trend indicators (🚀 for bullish and 💀 for bearish) based on the EMA crossover status for each coin and timeframe.
Conditional Cell Coloring: Table cells are color-coded based on the EMA crossover conditions, helping users quickly identify bullish or bearish trends.
Opacity Control: Users can adjust the opacity of the table cell colors for better visualization on the chart.
How It Works:
Coin Selection: Users can select up to four different cryptocurrencies to monitor by entering their ticker symbols.
Timeframe Selection: Users can select two different timeframes for the EMA calculations. The script calculates the 5-period and 20-period EMAs for each coin and timeframe.
EMA Crossovers: The script checks for EMA crossovers (EMA 5 crossing above or below EMA 20) and updates the trend indicators and cell colors accordingly.
Table Display: The script displays a table with the selected coins, their current prices, and trend indicators for the chosen timeframes. The background color of the table cells changes based on the EMA crossover status.
Script Logic:
The get_price function retrieves the latest price of the selected coin for the specified timeframe.
The get_ema_cross function calculates the 5-period and 20-period EMAs and checks for crossover conditions.
The fill_row function populates the table with the coin data, trend indicators, and conditionally colored cells.
The table header and data rows are updated based on the user-selected coins, timeframes, and EMA crossover conditions.
Usage:
Add the script to your TradingView chart.
Customize the coin selection, timeframes, text color, default cell color, bullish and bearish cross colors, and cell opacity through the input settings.
The script will display a table with the selected coins, their current prices, and trend indicators based on the EMA crossovers for the chosen timeframes.
