EMA Trend Pro v5.0 5M ONLY — 策略版(1:1出30%+保本)Here is a clear, professional English description you can copy-paste directly (suitable for sharing with friends, investors, brokers, or posting on TradingView):
EMA Trend Pro v5.0 – Strategy Overview
This is a trend-following strategy designed for 15-minute charts on assets like XAUUSD, NASDAQ, BTC, and ETH.
Entry Rules
Buy when the 7, 14, and 21-period EMAs are aligned upward and the 14-period EMA crosses above the 144-period EMA (with ADX > 20 and volume confirmation).
Sell short when the EMAs are aligned downward and the 14-period EMA crosses below the 144-period EMA.
Risk Management
Initial stop-loss is placed at 1.8 × ATR below (long) or above (short) the entry price.
Position size is calculated to risk a fixed percentage of equity per trade.
Profit-Taking & Trade Management
When price reaches 1:1 reward-to-risk, 30% of the position is closed.
At the same moment, the stop-loss for the remaining 70% is moved to the entry price (breakeven).
The remaining position is split:
50% targets 1:2 reward-to-risk
50% targets 1:3 reward-to-risk (allowing big wins during strong trends)
Visualization
Clean colored bars extend to the right showing entry, stop-loss, and three take-profit levels.
Price labels clearly display "Entry", "SL", "TP1 1:1", "TP2 1:2", and "TP3 1:3".
Only the current trade is displayed for a clean chart.
Key Advantages
High win rate due to breakeven protection after 1R
Excellent reward-to-risk ratio that lets winners run
Fully automated, works on any market with clear trends
Professional look, easy to understand and explain
Perfect for swing traders who want consistent profits with limited downside risk.
Feel free to use this description on TradingView, in your trading journal, or when explaining the strategy to others!
If you want a shorter version (e.g., for TradingView description box) or a Chinese version, just let me know — I’ll give it to you right away! 😊
Tìm kiếm tập lệnh với "tradingview+筹码结构"

Dynamic Fair-Value Ribbon Pro @darshakssc1. What This Indicator Is (In Simple Terms)
The Dynamic Fair-Value Ribbon Pro is a visual tool that helps you see how price behaves around a statistically derived “fair-value zone”:
A colored ribbon/cloud marks a central “fair” area.
Areas above the ribbon are labeled as “Unfair High Zone”.
Areas below the ribbon are labeled as “Unfair Low Zone”.
A small state panel tells you where price currently sits relative to this ribbon.
All calculations are based only on historical price, volume, and volatility.
It does not predict future price, does not give buy/sell signals, and is not financial advice.
2. Adding the Indicator
Open a chart on TradingView.
Click on Indicators .
Search for “Dynamic Fair-Value Ribbon Pro” .
Click to add it to your chart.
You will see:
A cloud/ribbon around price.
Colored bars when price is outside the ribbon.
A panel in the top right describing the current state.
3. Core Concept: Fair vs Unfair Zones (Analytical Only)
The indicator tries to answer a descriptive question:
“Where is price trading relative to a historically derived central area?”
It does this by:
Calculating a central value (“fair mid”).
Building a band around that mid.
Coloring the chart depending on whether price is inside or outside that band.
It is not claiming that:
Price “must” return to the band.
Price is “overvalued” or “undervalued”.
Any state is good or bad.
It is simply a visual classification tool .
4. Engine Modes — How the Ribbon Is Calculated
Under “Fair-Value Engine” you can choose:
4.1 Mode 1: Range
Looks back over a chosen number of bars (default: 100).
Finds the highest high and lowest low in that window.
Defines a central “slice” of that range as the fair-value ribbon :
Range Mode: Lower Percent → bottom boundary of the slice (e.g., 30%).
Range Mode: Upper Percent → top boundary of the slice (e.g., 70%).
Effect:
The ribbon represents a middle portion of the historical range .
Above the ribbon = “Unfair High Zone” (analytical label only).
Below the ribbon = “Unfair Low Zone”.
This is purely statistical — it does not mean price is wrong or will revert.
4.2 Mode 2: VWAP + Stdev
In this mode, the central value is based on VWAP :
VWAP (Volume-Weighted Average Price) is used as the midline.
A standard deviation envelope is built around VWAP:
VWAP Mode: Stdev Multiplier controls how wide that envelope is.
Effect:
The ribbon shows where price is trading relative to a volume-weighted average .
Again, areas above and below are just described as “unfair” zones in a visual, analytical sense , not a predictive one.
5. ATR Adaptive Width — Making the Ribbon React to Volatility
Under “ATR Adaptive Width” :
Use ATR Adaptive Width:
On: the band width scales with volatility.
Off: band width stays fixed based on Range or VWAP settings.
ATR Length: how many bars to use for ATR.
Reference ATR (% of price): a reference level for normal volatility.
Min Width Scale / Max Width Scale: clamps the scaling so that the band doesn’t get too narrow or too wide.
What this does (analytically):
When volatility (ATR) is higher than the reference, the band can become wider .
When volatility is lower , the band can become narrower .
This is a mathematical rescaling only and does not imply any optimal levels or performance.
6. Visual Elements — What You See on the Chart
6.1 Fair-Value Ribbon (Cloud)
The cloud between Fair Ribbon Low and Fair Ribbon High is the fair zone .
Color can be changed via “Fair Ribbon Color” .
6.2 Midline
If “Show Center Line” is enabled:
A line runs through the middle of the ribbon.
In Range mode, this is the average of the upper and lower band.
In VWAP mode, it’s essentially the VWAP-based mid.
This line is for visual reference only and makes no claims about support, resistance, or reversion.
6.3 Bar Colors
Unfair High Zone: bars are colored with Unfair High Bar Color.
Unfair Low Zone: bars are colored with Unfair Low Bar Color.
Inside the ribbon:
If “Fade Bars Inside Fair Zone” is ON, bars may be more faded/neutral.
These colors are simply classification highlights ; they do not tell you what to do.
6.4 State Panel (Top Right)
If “Show State Panel” is enabled, you’ll see a small box that displays:
Current engine:
Range or VWAP+Stdev.
Current price state:
Inside Ribbon (Fair Zone)
Above Ribbon (Unfair High Zone)
Below Ribbon (Unfair Low Zone)
This is a quick summary of where price sits relative to the computed ribbon.
7. Typical Ways to Use It (Informational Only)
The indicator can help you visually:
See when price is spending time inside a historically defined central zone.
Notice when price is frequently trading outside that zone.
Compare different timeframes (e.g., 5m vs 1h vs 4h) to see how the fair zone shifts.
Experiment with:
Range length (shorter vs longer lookback).
VWAP vs Range mode.
ATR adaptation on/off.
Important:
Any interpretation of these visuals is entirely up to the user.
The script does not tell you to buy, sell, hold, or do anything specific.
8. Limitations and Important Notes
All calculations use past data only (price, volume, volatility).
The ribbon does not guarantee:
that price will revert,
that zones will hold,
or that any outcome will occur.
There are no built-in signals such as “long/short” or automatic entries/exits.
The script is best used as a supporting, visual layer alongside other tools or methods you choose.
9. Disclaimer
This indicator is:
Strictly informational and educational.
Not a trading system or strategy.
Not financial advice or a recommendation.
Not guaranteed to be accurate, complete, or suitable for any specific purpose.
Users should always perform their own research and due diligence.
Past behavior of any visual pattern or zone does not guarantee future behavior.

ATR multiple from High & LowA simple numerical indicator measuring ATR multiple from recent 252 days high and low.
ATR multiples from high (and low) are used as a base in many systematic trading and trend following systems. As an example many systems buy after a 2.5–4 ATR multiple pullback in a strong stock if the regime allows it. This would then be paired with an entry tactic, for example buy as it recaptures the a pivot within the upper range, a MA or breaks out again after this mid term pullback/shakeout.
This indicator uses a function which captures the recent high and low no matter if we have 252 bars or not, which is not how standard high/low works in Tradingview. This means it also works with recent IPO:s.
I prefer to overlay the indicator in one of the lower panes, for example the volume pane and then right click on the indicator and select Pin to scale > No scale (fullscreen).

Nifty50 Sector Weightage PerformanceNifty50 Sector Weightage Performance is a comprehensive market analysis indicator that visualizes the composition and daily performance of all 15 sectors in the Nifty 50 index. This powerful tool provides real-time insights into sector movements, helping traders and investors identify market trends, understand sector rotation, and make informed trading decisions.
The indicator combines sector weightage data with daily percentage changes to calculate a weighted market sentiment score, displayed through an intuitive visual progress bar that indicates whether the market is moving towards bullish or bearish territory.
Comprehensive Sector Coverage
- Tracks all 15 sectors of the Nifty 50 index. Some broad indices because of request limit on Tradingview.
- Displays real-time sector weights and daily percentage changes
- Color-coded visualization for quick performance assessment
Complete Sector Breakdown
1. Financial Services (36.76%)
- Symbol: NSE:BANKNIFTY
- Largest sector in Nifty 50
- Uses Bank Nifty index for comprehensive financial sector representation
2. Oil, Gas & Consumable Fuels (10.26%)
- Individual Stocks(weighted average):
- RELIANCE (8.71%)
- ONGC (0.81%)
- COALINDIA (0.74%)
3. Information Technology (9.98%)
- Symbol: NSE:CNXIT
- Represents IT sector performance through CNX IT index
4. Automobile & Auto Components (6.83%)
- Individual Stocks (weighted average):
- M&M (Mahindra & Mahindra) - 2.77%
- BAJAJ_AUTO (Bajaj Auto) - 0.84%
- EICHERMOT (Eicher Motors) - 0.79%
- MARUTI (Maruti Suzuki) - 1.77%
- TATAMOTORS (Tata Motors) - 0.66%
5. Fast Moving Consumer Goods (6.52%)
- Symbol: NSE:CNXFMCG
- Uses CNX FMCG index for consumer goods sector
6. Telecommunication (4.96%)
- Symbol: NSE:BHARTIARTL
- Uses Bharti Airtel as representative stock
7. Healthcare (4.27%)
- Symbol: NSE:CNXPHARMA
- Pharmaceutical sector represented by CNX Pharma index
8. Construction (3.98%)
- Symbol: NSE:LT
- Uses Larsen & Toubro as representative stock
9. Metals & Mining (3.64%)
- Symbol: NSE:CNXMETAL
- Metals sector through CNX Metal index
10. Consumer Services (2.63%)
- Individual Stocks (weighted average):
- ETERNAL (Eternal) - 1.8%
- TRENT (Trent) - 0.82%
11. Consumer Durables (2.47%)
- Individual Stocks (weighted average):
- TITAN (Titan Company) - 1.36%
- ASIANPAINT (Asian Paints) - 1.11%
12. Power (2.37%)
- Individual Stocks (weighted average):
- NTPC (NTPC Limited) - 1.32%
- POWERGRID (Power Grid Corporation) - 1.05%
13. Construction Materials (2.07%)
- Individual Stocks (weighted average):
- ULTRACEMCO (UltraTech Cement) - 1.18%
- GRASIM (Grasim Industries) - 0.89%
14. Services (2.00%)
- Individual Stocks (weighted average):
- INDIGO (Interglobe Aviation) - 1.06%
- ADANIPORTS (Adani Ports) - 0.93%
15. Capital Goods (1.28%)
- Individual Stock:
- BEL (Bharat Electronics) - 1.28%
Sector Performance Calculation
- Single Index Sectors: Uses direct index/symbol percentage change
- Multi-Stock Sectors: Calculates weighted average based on individual stock weights and their percentage changes
- Formula: Weighted Average = Σ(Stock Weight × Stock % Change) / Total Sector Weight
Data Source
Nifty 50 Index: www.niftyindices.com

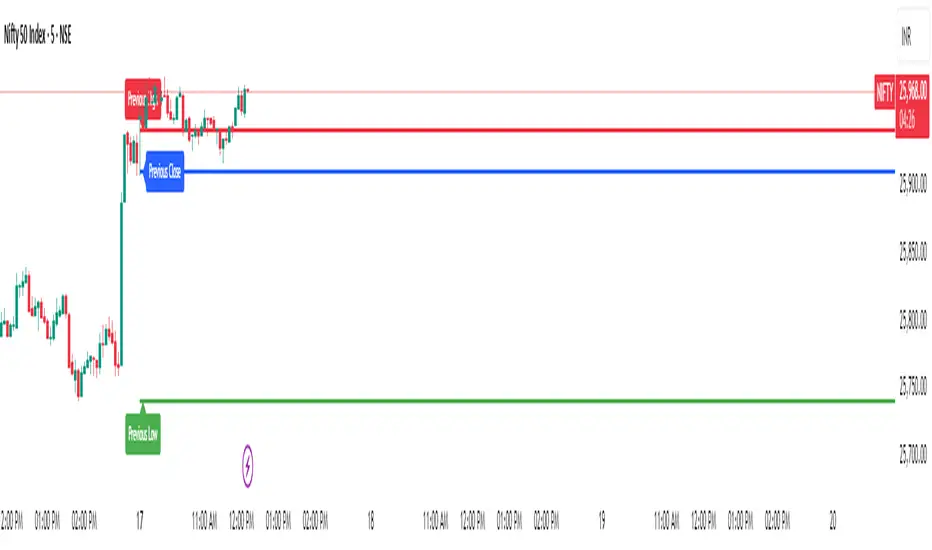
Previous Day Levels @darshaksscThis indicator provides intraday traders and analysts with immediate visual reference to the previous day's high, low, and close. These historical price levels are frequently watched by market participants for potential reaction, context, and session structure.
How to Add the Indicator:
Open any chart on TradingView.
Click the Indicators button at the top.
Search for “Previous Day Levels @darshakssc” in the Public Library.
Click the ★ Favorite icon if you wish to save it for quick access in the future.
Click the indicator’s name to add it to your chart.
The lines and labels will appear automatically on any intraday timeframe.
What You Will See:
Previous day’s High (red line and label: “Previous High”).
Previous day’s Low (green line and label: “Previous Low”).
Previous day’s Close (blue line and label: “Previous Close”).
These are drawn automatically at each new session and remain visible throughout today’s trading.
Usage:
Use these levels as reference points for context, risk placement, or understanding shifts in session structure.
Watch for price interactions, rejections, or consolidations around these lines—they often act as support/resistance for many trading strategies.
No signals or trade advice are provided by this tool. All decisions are made manually by the trader.
Features:
Persistent, color-coded horizontal lines and clear, small labels.
No alerts, buy/sell arrows, or any indication of trading performance.
Fully automated for each new session—no action required from the user after adding.
Disclaimer:
This indicator is intended for informational and charting purposes only. It is not financial advice or a buy/sell recommendation. Always perform your own due diligence before making trading decisions.
5 Moving Averages – Custom Trend Colors + No Neutral Mode5 Moving Averages Pro – Custom Trend Colors + No Neutral Mode
The cleanest and most professional 5-MA bundle on TradingView.
Features:
• 5 fully customizable moving averages (period + type: SMA, EMA, WMA, HMA, VWMA)
• All 5 MAs instantly change color based on global trend:
– Green → price above ALL 5 MAs (strong bullish)
– Red → price below ALL 5 MAs (strong bearish)
– Optional neutral gray (or completely disable neutral mode)
• Fully customizable bullish, bearish and neutral colors
• Optional background coloring (very light & clean)
• Trend change arrows (only on real bullish/bearish confirmation)
• "No Neutral" mode → forces green/red even in sideways markets (price vs average of the 5 MAs)
Perfect for:
• Trend-following systems
• Clean chart setups
• Scalping, day trading & swing trading
• Confirming institutional bias
Zero repainting | Super lightweight | Works on all timeframes & markets
One of the most loved multi-MA indicators worldwide. Join 250K+ traders already using it daily!

MACD Divergence Optimizer# MACD Divergence Optimizer - User Guide
## Overview
The **MACD Divergence Optimizer** is a professional-grade technical analysis indicator for TradingView that automatically detects hidden divergences on MACD with volume weighting. It identifies potential reversal points before price action confirms the move, giving traders an early edge.
---
## What is Divergence?
A **divergence** occurs when price and an oscillator (like MACD) move in opposite directions:
- **Bullish Divergence**: Price makes a lower low, but MACD makes a higher low → Potential uptrend reversal
- **Bearish Divergence**: Price makes a higher high, but MACD makes a lower high → Potential downtrend reversal
Divergences are among the most reliable reversal signals in technical analysis.
---
## Indicator Features
### Volume-Weighted MACD
- Standard MACD is calculated on closing price
- This indicator uses **volume-weighted closing prices** for greater accuracy
- Formula: MACD = (Volume-Weighted EMA₁₂ - Volume-Weighted EMA₂₆)
- Volume weighting gives more importance to high-conviction price moves
### Automatic Swing Detection
- Detects local highs and lows (5-bar lookback)
- Tracks the last 5 swings for divergence analysis
- Only meaningful swings are tracked (filtered for noise)
### Smart Signal Generation
- Green triangle (▲) = Bullish Divergence (BUY signal)
- Red triangle (▼) = Bearish Divergence (SELL signal)
- Triangles appear directly on the MACD line for precise entry timing
### Built-in Alerts
- Real-time notifications for divergence signals
- Alerts can trigger mobile push notifications or sound
- Never miss a trading opportunity
---
## How to Use
### Installation
1. Open TradingView and navigate to the Chart
2. Click "Indicator" → Search "MACD Divergence Optimizer"
3. Click "Add to Chart"
4. The indicator appears in a separate panel below the price chart
### Reading the Indicator
**MACD Panel displays:**
- **Blue Line** = MACD (fast momentum)
- **Orange Line** = Signal line (slow momentum)
- **Histogram** (colored bars) = Difference between MACD and Signal
- Green bars = MACD above signal (bullish)
- Red bars = MACD below signal (bearish)
**Divergence Signals:**
- **Green Triangle ▲** = Bullish divergence detected
- Price is lower, but MACD momentum is strengthening
- Look for uptrend reversal
- Confirm with higher closes or volume
- **Red Triangle ▼** = Bearish divergence detected
- Price is higher, but MACD momentum is weakening
- Look for downtrend reversal
- Confirm with lower closes or selling volume
---
## Parameters & Settings
### MACD Fast Length (Default: 12)
- Controls the faster moving average period
- **Lower values** → More responsive, more false signals
- **Higher values** → Smoother, fewer signals
- **Typical range**: 8-15
### MACD Slow Length (Default: 26)
- Controls the slower moving average period
- **Lower values** → Faster divergence detection
- **Higher values** → More reliable, fewer signals
- **Typical range**: 20-35
### Signal Smoothing (Default: 9)
- EMA period applied to MACD itself
- **Lower values** → Faster crossover signals
- **Higher values** → Fewer false crossovers
- **Typical range**: 5-15
### Min Divergence Strength (Default: 0.5%)
- Minimum % difference between current MACD and swing MACD
- **Lower values** → More divergence signals (noisier)
- **Higher values** → Only strong divergences (fewer signals)
- **Recommended**: 0.3% - 1.0%
### Lookback Bars (Default: 75)
- Historical window for analysis
- Larger lookback = more context but slower calculation
- **Typical range**: 50-100
---
## Trading Strategy
### Bullish Divergence (Entry Setup)
1. **Identify Signal**: Green triangle appears on MACD
2. **Confirm Price**: Look for price rejection of the low (bounce)
3. **Volume Check**: Buy on increase in volume at the bounce
4. **Entry**: Above the swing low level
5. **Stop Loss**: Below the most recent swing low
6. **Target**: Next swing high or resistance level
### Bearish Divergence (Entry Setup)
1. **Identify Signal**: Red triangle appears on MACD
2. **Confirm Price**: Look for price rejection of the high
3. **Volume Check**: Sell on increase in volume at rejection
4. **Entry**: Below the swing high level
5. **Stop Loss**: Above the most recent swing high
6. **Target**: Next swing low or support level
### Risk Management
- **Position Size**: Risk only 1-2% per trade
- **Stop Loss**: Place beyond recent swings
- **Take Profit**: Scale out at 1:1, 1:2, 1:3 risk-reward ratios
- **Filter**: Use on higher timeframes (4H, Daily) for reliability
---
## Timeframe Recommendations
| Timeframe | Best For | Signal Quality |
|-----------|----------|---|
| **1H** | Scalping, day trading | Moderate (some noise) |
| **4H** | Swing trading | Excellent |
| **Daily** | Position trading | Excellent |
| **Weekly** | Long-term trends | Excellent |
---
## Tips & Best Practices
### ✅ DO:
- **Use on trends**: Divergences work best when there's a clear trend
- **Combine signals**: Look for confirmation from price action, volume, or moving averages
- **Trade the bounce**: Wait for price to react to the swing, then enter
- **Adjust parameters**: Test different MACD lengths for your trading style
- **Use alerts**: Set up mobile alerts so you don't miss signals
### ❌ DON'T:
- **Trade every signal**: Some signals are stronger than others
- **Trade flat/choppy markets**: Divergences fail in ranging markets
- **Ignore support/resistance**: Trade divergences near key levels for best results
- **Over-leverage**: Divergences are probabilistic, not guaranteed
- **Disable volume analysis**: Always check volume when divergence fires
---
## Advanced Features
### Volume Weighting
The indicator uses **volume-weighted MACD** instead of standard MACD. This means:
- High-volume reversals get more emphasis
- Low-volume moves are smoothed out
- More accurate momentum readings
- Better at identifying true trend changes
### Array Tracking
The indicator tracks the last 5 swings in arrays:
- `swingLows ` = last 5 price lows
- `swingHighs ` = last 5 price highs
- `swingMacds ` = corresponding MACD values
This allows detection of **hidden divergences** not visible in traditional analysis.
---
## Common Questions
**Q: Why didn't the indicator trigger a signal when I see a divergence?**
A: The indicator may require:
- MACD histogram to cross the zero line (confirms momentum shift)
- Minimum strength threshold to be met (adjust Min Divergence Strength)
- At least 5 swings to be recorded in the lookback window
**Q: Can I use this on all timeframes?**
A: Yes, but divergences are more reliable on higher timeframes (4H+). Lower timeframes produce more signals but with more noise.
**Q: Should I trade every green/red triangle?**
A: No. Use them as a heads-up for potential reversals. Always confirm with:
- Price action (rejection of the swing)
- Volume (increasing volume at reversal)
- Key support/resistance levels
**Q: How do I set alerts?**
A:
1. Right-click the indicator → Edit Alerts
2. Check "Bullish Divergence" and/or "Bearish Divergence"
3. Choose notification type (browser, mobile, email)
4. Set frequency to "Once per bar close"
**Q: What's the difference between regular and hidden divergence?**
A: This indicator detects **hidden divergences** (also called continuation divergences):
- **Regular**: Price makes new extreme, but oscillator doesn't
- **Hidden**: Price makes new extreme, oscillator makes new extreme in different direction
- Hidden divergences are often more reliable for continuation plays
---
## Disclaimer
This indicator is provided for educational and informational purposes only. It is not financial advice. Past performance does not guarantee future results. Always use proper risk management and combine with other analysis methods. Trading and investing carry risk of loss. Do your own research before making trading decisions.
---
## Support & Updates
For issues, feature requests, or questions:
- Check the indicator settings and parameter values
- Test on historical data first before live trading
- Adjust parameters to match your trading style and timeframe
---
**Version**: 1.0
**Last Updated**: November 2025
**Compatible**: TradingView v6+

BTC Marty IndicatorsThis custom Pine Script indicator is designed specifically for Bitcoin (BTC) trading analysis on TradingView. It combines multiple technical tools into a single, easy-to-use overlay indicator to help traders identify trends, momentum shifts, and overall market sentiment. Ideal for swing traders, long-term holders, or anyone monitoring BTC's price action across various timeframes.
Key Features:
Timeframe-Independent SMAs (110 and 350d)
MACD Histogram Signals

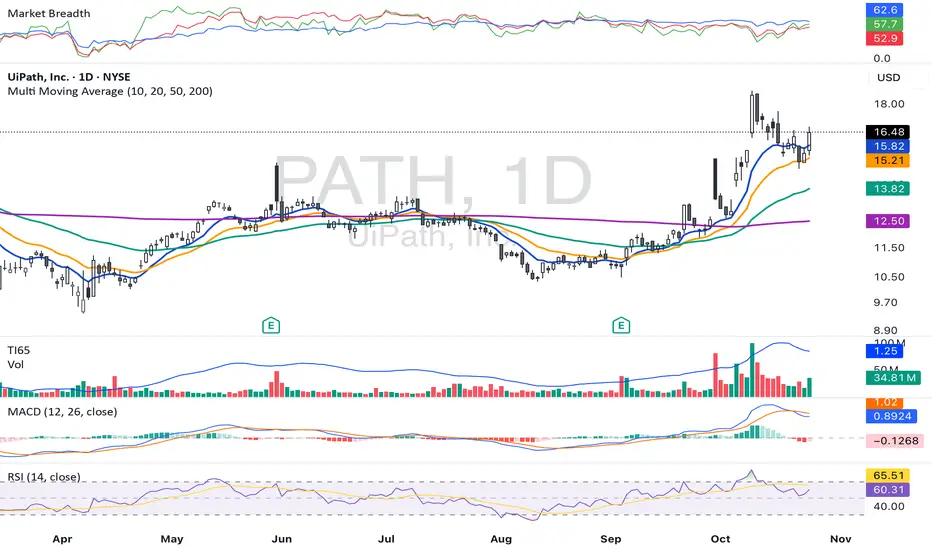
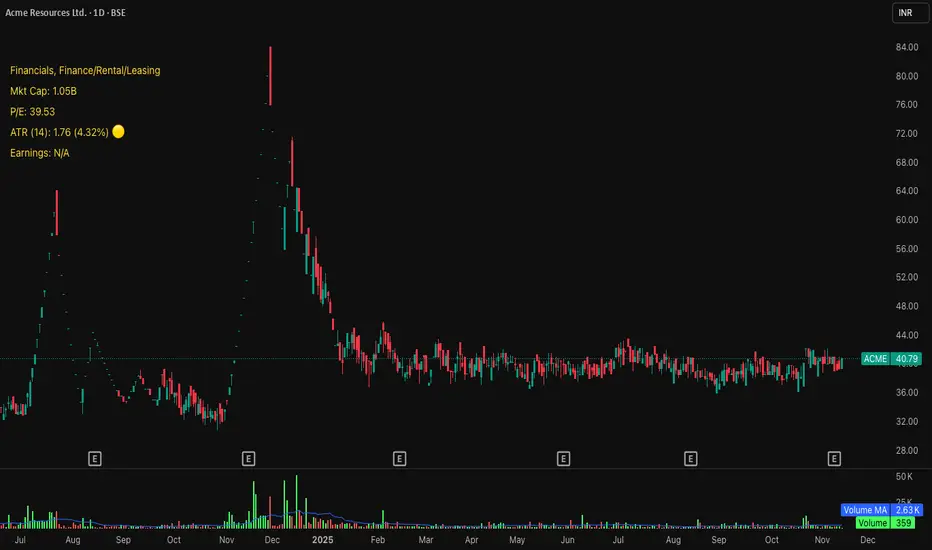
Michael's Custom Watermark🔷 MICHAEL'S CUSTOM WATERMARK INDICATOR
━━━━━━━━━━━━━━━━━━━━━━━━━━━━━━━━━━━━━━━
📊 OVERVIEW
A comprehensive chart watermark overlay that displays essential fundamental and technical information for stocks in a clean, customizable table format. Perfect for traders who want quick access to key metrics without cluttering their charts.
━━━━━━━━━━━━━━━━━━━━━━━━━━━━━━━━━━━━━━━
✨ KEY FEATURES
📊 Fundamental Data Display — Shows Industry, Sector, Market Cap, and P/E Ratio
📅 Earnings Information — Displays next earnings date with countdown timer
📈 ATR Volatility Indicator — 14-day ATR with color-coded visual alerts (🔴🟡🟢)
🎨 Auto Theme Detection — Automatically adjusts text color based on chart background
⚙️ Fully Customizable — Position, colors, size, and displayed metrics all adjustable
🏢 GICS Sector Mapping — Heuristic-based sector classification aligned with industry standards
━━━━━━━━━━━━━━━━━━━━━━━━━━━━━━━━━━━━━━━
🎯 WHAT MAKES THIS INDICATOR UNIQUE?
Unlike basic watermarks, this indicator provides:
Real-time fundamental data integration
Smart theme-aware color adaptation for both light and dark charts
Configurable volatility alerts using ATR thresholds
Earnings countdown feature to never miss important dates
Optimized display that only shows relevant data for the current symbol type
━━━━━━━━━━━━━━━━━━━━━━━━━━━━━━━━━━━━━━━
📖 HOW TO USE
1. BASIC SETUP
Add the indicator to your chart. By default, it displays in the top-left corner with all features enabled.
2. POSITIONING
Vertical Location: Top, Middle, or Bottom
Horizontal Location: Left, Center, or Right
Vertical Offset: Fine-tune position with 0-50 pixel offset from top
3. CUSTOMIZATION OPTIONS
TEXT APPEARANCE:
Auto Text Color — Enable to automatically adapt text color to your chart theme
Manual Color — Set a fixed text color if auto-color is disabled
Text Size — Choose from Huge, Large, Normal, or Small
Theme Colors — Customize text color for light and dark backgrounds separately
DATA DISPLAY TOGGLES:
Show Industry & Sector — Display heuristic-based GICS-aligned sector and industry classification
Show Market Cap — View market capitalization in T/B/M format
Show P/E Ratio — Display Price-to-Earnings ratio (stocks only)
Show ATR (14-Day) — Display Average True Range with percentage and visual indicator
Show Next Earnings — Display upcoming earnings information
Show Earnings Countdown — Show days remaining until next earnings (requires earnings display)
4. ATR VOLATILITY ALERTS
Configure custom thresholds to monitor volatility:
Red Threshold — ATR percentage that triggers red alert 🔴 (default: 6%)
Yellow Threshold — ATR percentage that triggers yellow alert 🟡 (default: 3%)
Green — Shows automatically when ATR is below yellow threshold 🟢
━━━━━━━━━━━━━━━━━━━━━━━━━━━━━━━━━━━━━━━
📐 UNDERSTANDING THE DISPLAY
🏢 SECTOR & INDUSTRY
Shows the GICS sector classification followed by the specific industry. The indicator uses heuristic-based mapping to align TradingView sectors with standard GICS classifications. Note that this mapping is based on keyword detection and industry analysis, so while generally accurate, it may not perfectly match official GICS classifications in all cases.
💰 MARKET CAP
Displays market capitalization using standard abbreviations:
T = Trillion
B = Billion
M = Million
📊 P/E RATIO
Shows the trailing twelve-month Price-to-Earnings ratio. Only displayed for stocks when enabled. Shows "N/A" if data is unavailable.
📈 ATR (14-DAY)
Displays the 14-period Average True Range in both absolute value and percentage terms, with a color-coded indicator:
🔴 Red: High volatility (above red threshold)
🟡 Yellow: Moderate volatility (between yellow and red thresholds)
🟢 Green: Low volatility (below yellow threshold)
📅 EARNINGS
Shows earnings information in three formats:
"X days remaining" — When countdown is enabled and earnings date is known
"Upcoming" — When date is in the future but countdown is disabled
"Recently Reported" — When earnings just occurred
"N/A" — When no earnings data is available
━━━━━━━━━━━━━━━━━━━━━━━━━━━━━━━━━━━━━━━
⚙️ TECHNICAL DETAILS
SUPPORTED INSTRUMENTS:
Optimized for stocks with full fundamental data
Works with other instruments (crypto, forex, futures) but only displays applicable metrics
Automatically suppresses irrelevant data (e.g., P/E for non-stocks)
PERFORMANCE:
Lightweight overlay with minimal resource usage
Updates only on last bar for efficiency
No historical recalculation needed
COMPATIBILITY:
Pine Script v6
Works on all timeframes
Compatible with all chart types
Auto-adapts to theme changes
━━━━━━━━━━━━━━━━━━━━━━━━━━━━━━━━━━━━━━━
💡 TIPS & BEST PRACTICES
Enable Auto Text Color for seamless theme switching between light and dark modes
Adjust vertical offset to avoid overlap with price action in high-volatility periods
Use ATR thresholds appropriate to your trading style and asset class
Disable features you don't use to keep the watermark clean and focused
Position in corners to maximize chart viewing space
Use smaller text size for multi-panel layouts
━━━━━━━━━━━━━━━━━━━━━━━━━━━━━━━━━━━━━━━
🔧 TROUBLESHOOTING
"N/A" SHOWING FOR P/E RATIO:
This is normal for non-stock instruments
May occur for stocks with negative earnings
Check if fundamental data is available for the symbol
EARNINGS SHOWING "N/A":
Earnings data may not be available for all stocks
Check TradingView's data coverage for your symbol
TEXT COLOR NOT VISIBLE:
Enable Auto Text Color feature
Manually set text color to contrast with your chart background
Adjust custom light/dark text colors in settings
━━━━━━━━━━━━━━━━━━━━━━━━━━━━━━━━━━━━━━━
⚠️ DISCLAIMER
This indicator is for informational purposes only. The fundamental data displayed is sourced from TradingView's data providers. Always verify critical information before making trading decisions. Past performance is not indicative of future results.
━━━━━━━━━━━━━━━━━━━━━━━━━━━━━━━━━━━━━━━
If you find this indicator helpful, please give it a boost 🚀 and share your feedback in the comments!
Version: 1.0
Pine Script Version: v6
Created by: Michael
UltimateFlow by Kate V0.2Ultimate Flow Script: Tracks market structure breaks, buy/sell entries (CE/SE), and trends with a Zero Lag SMA. Highlights Bullish & Bearish Order Blocks (OB, BB, MM) with dynamic boxes and tiny labels. Zigzag swings visualize market structure for smart entries. Play with the various settings to suit your trading style. Alerts available for MSB changes and price in OB zones.
Disclaimer: This script is for educational and informational purposes only. It should be used in line with your own trading strategy, risk management, and discretion. Past performance is not indicative of future results.
This script is designed for price action, market structure, and order block analysis on TradingView. It includes:
Buy & Sell Signals (CE/SE) – Highlights potential entries based on market structure breaks and trend changes. Mini triangles or markers indicate possible reversals.
Zero Lag SMA (ZSMA) – Smooths price action for trend confirmation without delay. Helps identify trend direction and support/resistance areas.
Order Blocks (OBs) – Highlights key Bullish (Bu-OB) and Bearish (Be-OB) order blocks on the chart. Boxes dynamically extend as price evolves and include tiny labels (Bu-OB, Be-BB, MM, etc.) for clarity.
Zigzag Market Structure – Draws swing highs and lows to visualize market structure breaks (MSB).
How it works:
OB boxes extend automatically and change when price breaks them.
CE/SE markers help identify high-probability trade entries.
ZSMA confirms trend direction.
Alerts can be set for MSB changes or when price enters an OB zone.

Smart MA Crossover█ OVERVIEW
"Smart MA Crossover" is a technical analysis indicator designed to enhance the effectiveness of strategies based on MA crossovers, combining classic moving average crossovers with breakouts from boxes and dynamic trend visualizations. The indicator is fully customizable—you can freely adjust both parameters and graphical elements.
█ CONCEPTS
Trading approaches based solely on moving average crossover moments generate a large number of false signals. Smart MA Crossover was created to improve this statistic. That's why boxes are added, which are formed from the candle where the MA crossover occurred and generate signals only upon breakout from them. The boxes have bullish (green) and bearish (red) colors. By default, the show_only_matching filter is enabled, displaying entry signals only when the breakout direction matches the box color (e.g., only upward for a bullish box). Boxes are by default the size of the candle on which the crossover occurred, but their size can be adjusted to suit your strategy via an optional average candle size multiplier.
█ FEATURES
- Moving Averages: Two configurable MAs (fast_length, default 10; slow_length, default 30) with selectable type (SMA, EMA, WMA, HMA, VWMA). Optionally displayed with gradient fill between them (color depends on trend: green for uptrend, red for downtrend).
- MA Gradient and Candle Coloring: Enable gradient fill between MAs (transparency: gradient_opacity, default 85) and dynamic candle coloring based on trend (green/red).
- Fog Gradient Trend: Multi-layered gradient "fog" around hl2, consisting of 5 levels up and down, with offset based on average candle size (offset_mult, default 0.7) and increasing transparency (base_transp, default 80; transp_inc, default 4). Fog colors are dynamic (green/red).
- Breakout Boxes: Created at the moment of MA crossover, extending to the right. Box height optionally multiplied by average candle size (use_box_multiplier, box_multiplier, default 1.0). Boxes close and generate a signal when price breaks out beyond the top/bottom edge.
Signals:
- Triangles: Green downward triangles (buy breakout) below the bar, red upward triangles (sell breakout) above the bar—only on breakouts matching direction (if show_only_matching = true). When the matching filter is disabled, every box generates a signal based not on the MA crossover, but on the breakout direction.
- Labels: “BUY” (green, below bar) and “SELL” (red, iabove bar) with transparent background (transparency 40).
- Matching Filter: The show_only_matching option limits signals to breakouts consistent with box direction (bullish box → only buy, bearish → only sell).
- Visualization: Gradient MA lines, fill between MAs, multi-layered fog with increasing transparency, boxes with transparent background (85) and colored borders, dynamic trend colors.
- Alerts: Built-in alerts for BUY and SELL signals (with message including ticker and timeframe).
█ HOW TO USE
Add to Chart: Apply the indicator via Pine Editor or the Indicators menu on TradingView.
Configure Settings:
- MA Settings: Adjust fast (fast_length, default 10) and slow (slow_length, default 30) MA lengths and type (ma_type, default SMA).
- Visualization: Enable/disable MA lines (show_ma_lines), MA gradient (use_gradient_ma), fog trend (show_fog), candle coloring (color_candles).
- Boxes and Breakouts: Enable candle size multiplier (use_box_multiplier) and set value (box_multiplier, default 1.0). Enable signal filter (show_only_matching).
- Signals: Choose type (signal_type): Triangles or Labels (Buy/Sell).
- Fog Trend: Adjust offset (offset_mult), base transparency (base_transp), and increment (transp_inc). Select trend colors (col_up, col_dn).
Signal Interpretation:
- Buy Signals: Green triangles below the bar or “BUY” label—on upward breakout from a bullish box (after bull cross).
- Sell Signals: Red triangles above the bar or “SELL” label—on downward breakout from a bearish box (after bear cross).
- Fog and Gradient: green fog/fill = uptrend; red = downtrend.
- Boxes: Active boxes indicate potential breakout zones; their closure confirms the move.
Signal Confirmation: Use with other tools, such as support/resistance levels, volume, or additional MAs to filter false crossovers.
█ APPLICATIONS
- MA Cross Strategies: Replace classic crossovers—boxes and breakouts eliminate many false signals, thereby increasing effectiveness. Confirm with other indicators, e.g., RSI, Fibonacci, FVG, pivot levels.
- Trend Following: Can be used as a classic trend indicator, especially with larger MA values.
█ NOTES
- Test the indicator across different timeframes and assets, adjusting MA lengths and box multiplier to market volatility.
- In consolidating markets, the indicator generates more false signals.

Auto Fibonacci RetraceNOTE: This script is for educational purposes only.
This Pine Script v6 indicator automates the drawing of Fibonacci retracement levels on a TradingView chart based on detected pivot highs and lows. It's designed to identify the most recent swing points in a price trend and plot horizontal lines at standard Fibonacci ratios (0%, 23.6%, 38.2%, 50%, 61.8%, 78.6%, 100%), along with optional labels for each level. The script is useful for traders who want dynamic, hands-free Fib retracements that update as new pivots form, helping to spot potential support/resistance zones without manual intervention.
Key Features
Automatic Pivot Detection: Uses TradingView's built-in ta.pivothigh and ta.pivotlow functions to find recent swing highs and lows. The sensitivity is adjustable via user inputs for "Left Bars" and "Right Bars" (default: 5 each), which define how many bars are checked on either side to confirm a pivot.
Trend Direction Awareness: Determines if the current swing is an uptrend (recent high after low) or downtrend (recent low after high) and orients the Fib levels accordingly—starting from the low in uptrends or high in downtrends.
Dynamic Drawing:
Plots dashed horizontal lines extending to the right of the chart for each Fib level.
Colors are predefined for visual distinction (e.g., blue for 23.6%, orange for 61.8%).
Lines and labels are cleared and redrawn only when a new pivot is detected or on initial load to prevent chart clutter.
Customizable Labels: Optional labels show the percentage (e.g., "61.8%") and can be positioned on the "Left" (at the swing start) or "Right" (pinned to the current bar, updating dynamically). Labels use semi-transparent backgrounds for readability.
Performance Optimizations: Uses arrays to manage lines and labels efficiently, with reverse-indexed loops for safe deletion. The max_bars_back=500 ensures it handles historical data without excessive computation.
User Inputs:
Left/Right Bars: Tune pivot detection (higher values for major trends, lower for shorter swings).
Show Fib Levels/Labels: Toggle visibility.
Label Position: "Left" or "Right" for placement flexibility.
Usage Instructions
Adding to Chart: Copy-paste into TradingView's Pine Editor, save as a new indicator, and add it to your chart via the "Indicators" menu.
Customization: Adjust inputs in the indicator settings panel. For example, set Left/Right Bars to 10 for daily charts in strong trends.
Best Practices:
Use on trending markets (e.g., stocks, forex, crypto like BTC/USD); avoid choppy sideways action.
Combine with other indicators (e.g., RSI for overbought/oversold confirmation) for better trade signals.
Test on historical data—zoom out to see how it redraws on past swings.
Limitations: Relies on pivot functions, so it may lag slightly (pivots confirm after "Right Bars"). Not a trading strategy—use for analysis only. No alerts built-in, but you can add alertcondition if extending it.
Potential Enhancements: Add extensions (e.g., 161.8%), user-defined levels, or alerts on price touches via simple modifications.
This script provides a clean, efficient way to visualize Fib retracements automatically, saving time compared to manual drawing. If you need further tweaks or integration into a full strategy, let me know!

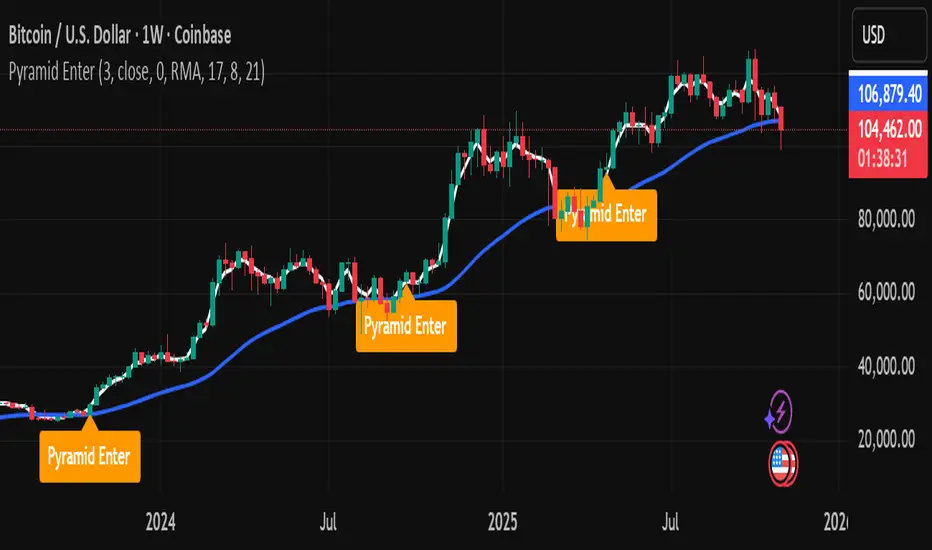
Pyramid EnterPyramid Enter — Educational Position-Scaling Study
Purpose
Pyramid Enter is a lightweight, educational visualization of additive entries (“pyramiding into strength”). It’s designed to help you study how layered entries might line up during persistent trends. This script does not execute orders, make predictions, or provide financial advice. It simply shows where entry candidates could appear under a simple crossover framework with an optional trend filter.
How it works (concept)
Computes a fast EMA of your chosen Source (default: close).
Applies a user-selected Smoother (SMA/EMA/RMA/WMA/None) to create a slower reference line.
Marks an Enter candidate when the fast EMA crosses above the smoothed line.
Optional EMA 8/21 trend filter can be enabled to allow marks only when EMA(8) > EMA(21).
Includes an adaptive-on-flip option: if the 8/21 filter turns on, a one-time Enter candidate is allowed (useful for studying “first add after trend resumes”).
This is strictly a visual study of where entries might layer during momentum continuation — exits, risk, and sizing are intentionally out of scope so you can analyze those topics separately.
Inputs
Inputs
Length: Period of the fast EMA applied to Source.
Source: Price series used for the fast EMA.
Offset: Visual offset only; no effect on logic.
Smoothing
Type: Choose “SMA / EMA / RMA / WMA / None” for the reference line.
Length: Period for the smoothing type above.
Visualization
Show Labels: Toggle the on-chart Enter labels.
EMA 8/21 Filter
Enable EMA 8/21 Filter: Only mark when EMA(8) > EMA(21).
Fast EMA / Slow EMA: Lengths for the filter (defaults 8/21).
Plot Filter EMAs: Display the 8/21 lines for context.
Adaptive entry when filter flips ON: Allows a one-time Enter candidate on the bar the trend filter turns on (handy when studying re-acceleration after a pullback).
Visuals
White line: Fast EMA of Source.
Blue line: Selected smoother (your slower reference).
Labels: “Pyramid Enter” markers at candidate spots (intrabar + bar-close confirmation are handled internally to keep charts tidy).
No alerts are included. This tool is for chart study only.
Suggested study workflow
Context first — Add your higher-timeframe tools or moving averages to understand the broader regime.
Enable the 8/21 filter if you want to restrict labels to uptrends only.
Experiment with the smoother — SMA is simple, but EMA/RMA/WMA can change sensitivity.
Review clusters of “Pyramid Enter” labels during strong trends to learn where scaling could be considered in a rules-based process.
Pair with your risk framework — Because this script intentionally omits exits/position sizing, use it alongside your own stop, trailing, and de-risking logic for research.
Good citizens of the chart
No repainting tricks.
Marks follow standard EMA/smoothing crossovers with a simple state lock to avoid duplicates.
Designed to be lightweight and readable on any timeframe or symbol.
Limitations & notes
This is not a signal provider, trading system, or performance model.
Labels are educational candidates only; they do not imply profitability or suitability.
Past chart behavior does not guarantee future results. Always do your own research and practice risk management.
Compatibility
Works on all symbols/timeframes supported by TradingView.
Overlay: true (prints on price chart).
No alerts included by design.
Changelog
v1.0 — Initial public release: minimal visual study, optional 8/21 filter, adaptive flip option, no alerts.
License
Michael Culpepper Gratitude License — Free to use and modify for education and research. Please credit the author if you remix or share. Not for sale. No warranty.
Tags / Category (suggested)
Category: Trend Analysis / Educational Tools
Tags: pyramid, scaling, trend, ema, crossover, education, study
Ben's BTC Macro Fair Value OscillatorBen's BTC Macro Fair Value Oscillator
Overview
The **BTC Macro Fair Value Oscillator** is a non-crypto fair value framework that uses macro asset relationships (equities, dollar, gold) to estimate Bitcoin's "macro-driven fair value" and identify mean-reversion opportunities.
"Is BTC cheap or expensive right now?" on the 4 Hour Timeframe ONLY
### Key Features
✅ **Macro-driven**: Uses QQQ, DXY, XAUUSD instead of on-chain or crypto metrics
✅ **Dynamic weighting**: Assets weighted by rolling correlation strength
✅ **Mean-reversion signals**: Identifies when BTC is cheap/expensive vs macro
✅ **Validated parameters**: Optimized through 5-year backtest (Sharpe 6.7-9.9)
✅ **Visual transparency**: Live correlation panel, fair value bands, statistics
✅ **Non-repainting**: All calculations use confirmed historical data only
### What This Indicator Does
- Builds a **synthetic macro composite** from traditional assets
- Runs a **rolling regression** to predict BTC price from macro
- Calculates **deviation z-score** (how far BTC is from macro fair value)
- Generates **entry signals** when BTC is extremely cheap vs macro (dev < -2)
- Generates **exit signals** when BTC returns to fair value (dev > 0)
### What This Indicator Is NOT
❌ Not a high-frequency trading system (sparse signals by design)
❌ Not optimized for absolute returns (optimized for Sharpe ratio)
❌ Not suitable as standalone trading system (best as overlay/confirmation)
❌ Not predictive of short-term price movements (mean-reversion timeframe: days to weeks)
---
## Core Concept
### The Premise
Bitcoin doesn't trade in a vacuum. It's influenced by:
- **Risk appetite** (equities: QQQ, SPX)
- **Dollar strength** (DXY - inverse to risk assets)
- **Safe haven flows** (Gold: XAUUSD)
When macro conditions are "good for BTC" (risk-on, weak dollar, strong equities), BTC should trade higher. When macro conditions turn against it, BTC should trade lower.
### The Innovation
Instead of looking at BTC in isolation, this indicator:
1. **Measures how strongly** BTC currently correlates with each macro asset
2. **Builds a weighted composite** of those macro returns (the "D" driver)
3. **Regresses BTC price on D** to estimate "macro fair value"
4. **Tracks the deviation** between actual price and fair value
5. **Signals mean reversion** when deviation becomes extreme
### The Edge
The validated edge comes from:
- **Extreme deviations predict future returns** (dev < -2 → +1.67% over 12 bars)
- **Monotonic relationship** (more negative dev → higher forward returns)
- **Works out-of-sample** (test Sharpe +83-87% better than training)
- **Low correlation with buy & hold** (provides diversification value)
---
## Methodology
### Step 1: Macro Composite Driver D(t)
The indicator builds a weighted composite of macro asset returns:
**Process:**
1. Calculate **log returns** for BTC and each macro reference (QQQ, DXY, XAUUSD)
2. Compute **rolling correlation** between BTC and each reference over `corrLen` bars
3. **Weight each asset** by `|correlation|` if above `minCorrAbs` threshold, else 0
4. **Sign-adjust** weights (+1 for positive corr, -1 for negative) to handle inverse relationships
5. **Z-score normalize** each reference's returns over `fvWindow`
6. **Composite D(t)** = weighted sum of sign-adjusted z-scores
**Formula:**
```
For each reference i:
corr_i = correlation(BTC_returns, ref_i_returns, corrLen)
weight_i = |corr_i| if |corr_i| >= minCorrAbs else 0
sign_i = +1 if corr_i >= 0 else -1
z_i = (ref_i_returns - mean) / std
contrib_i = sign_i * z_i * weight_i
D(t) = sum(contrib_i) / sum(weight_i)
```
**Key Insight:** D(t) represents "how good macro conditions are for BTC right now" in a normalized, correlation-weighted way.
---
### Step 2: Fair Value Regression
Uses rolling linear regression to predict BTC price from D(t):
**Model:**
```
BTC_price(t) = α + β * D(t)
```
**Calculation (Pine Script approach):**
```
corr_CD = correlation(BTC_price, D, fvWindow)
sd_price = stdev(BTC_price, fvWindow)
sd_D = stdev(D, fvWindow)
cov = corr_CD * sd_price * sd_D
var_D = variance(D, fvWindow)
β = cov / var_D
α = mean(BTC_price) - β * mean(D)
fair_value(t) = α + β * D(t)
```
**Result:** A time-varying "macro fair value" line that adapts as correlations change.
---
### Step 3: Deviation Oscillator
Measures how far BTC price has deviated from fair value:
**Calculation:**
```
residual(t) = BTC_price(t) - fair_value(t)
residual_std = stdev(residual, normWindow)
deviation(t) = residual(t) / residual_std
```
**Interpretation:**
- `dev = 0` → BTC at fair value
- `dev = -2` → BTC is 2 standard deviations **cheap** vs macro
- `dev = +2` → BTC is 2 standard deviations **rich** vs macro
---
### Step 4: Signal Generation
**Long Entry:** `dev` crosses below `-2.0` (BTC extremely cheap vs macro)
**Long Exit:** `dev` crosses above `0.0` (BTC returns to fair value)
**No shorting** in default config (risk management choice - crypto volatility)
---
## How It Works
### Visual Components
#### 1. Price Chart (Main Panel)
**Fair Value Line (Orange):**
- The estimated "macro-driven fair value" for BTC
- Calculated from rolling regression on macro composite
**Fair Value Bands:**
- **±1σ** (light): 68% confidence zone
- **±2σ** (medium): 95% confidence zone
- **±3σ** (dark, dots): 99.7% confidence zone
**Entry/Exit Markers:**
- **Green "LONG" label** below bar: Entry signal (dev < -2)
- **Red "EXIT" label** above bar: Exit signal (dev > 0)
#### 2. Deviation Oscillator (Separate Pane)
**Line plot:**
- Shows current deviation z-score
- **Green** when dev < -2 (cheap)
- **Red** when dev > +2 (rich)
- **Gray** when neutral
**Histogram:**
- Visual representation of deviation magnitude
- Green bars = negative deviation (cheap)
- Red bars = positive deviation (rich)
**Threshold lines:**
- **Green dashed at -2.0**: Entry threshold
- **Red dashed at 0.0**: Exit threshold
- **Gray solid at 0**: Fair value line
#### 3. Correlation Panel (Top-Right)
Shows live correlation and weighting for each macro asset:
| Asset | Corr | Weight |
|-------|------|--------|
| QQQ | +0.45 | 0.45 |
| DXY | -0.32 | 0.32 |
| XAUUSD | +0.15 | 0.00 |
| Avg \|Corr\| | 0.31 | 0.77 |
**Reading:**
- **Corr**: Current rolling correlation with BTC (-1 to +1)
- **Weight**: How much this asset contributes to fair value (0 = excluded)
- **Avg |Corr|**: Average correlation strength (should be > 0.2 for reliable signals)
**Colors:**
- Green/Red corr = positive/negative correlation
- White weight = asset included, Gray = excluded (below minCorrAbs)
#### 4. Statistics Label (Bottom-Right)
```
━━━ BTC Macro FV ━━━
Dev: -2.34
Price: $103,192
FV: $110,500
Status: CHEAP ⬇
β: 103.52
```
**Fields:**
- **Dev**: Current deviation z-score
- **Price**: Current BTC close price
- **FV**: Current macro fair value estimate
- **Status**: CHEAP (< -2), RICH (> +2), or FAIR
- **β**: Current regression beta (sensitivity to macro)
---
## Installation & Setup
### TradingView Setup
1. Open TradingView and navigate to any **BTC chart** (BTCUSD, BTCUSDT, etc.)
2. Open **Pine Editor** (bottom panel)
3. Click **"+ New"** → **"Blank indicator"**
4. **Delete** all default code
5. **Copy** the entire Pine Script from `GHPT_optimized.pine`
6. **Paste** into the editor
7. Click **"Save"** and name it "BTC Macro Fair Value Oscillator"
8. Click **"Add to Chart"**
### Recommended Chart Settings
**Timeframe:** 4h (validated timeframe)
**Chart Type:** Candlestick or Heikin Ashi
**Overlay:** Yes (indicator plots on price chart + separate pane)
**Alternative Timeframes:**
- Daily: Works but slower signals
- 1h-2h: May work but not validated
- < 1h: Not recommended (too noisy)
### Symbol Requirements
**Primary:** BTC/USD or BTC/USDT on any exchange
**Macro References:** Automatically fetched
- QQQ (Nasdaq 100 ETF)
- DXY (US Dollar Index)
- XAUUSD (Gold spot)
**Data Requirements:**
- At least **90 bars** of history (warmup period)
- Premium TradingView recommended for full historical data
---
## Reading the Indicator
### Identifying Signals
#### Strong Long Signal (High Conviction)
- ✅ Deviation < -2.0 (extreme undervaluation)
- ✅ Avg |Corr| > 0.3 (strong macro relationships)
- ✅ Price touching or below -2σ band
- ✅ "LONG" label appears below bar
**Interpretation:** BTC is extremely cheap relative to macro conditions. Historical data shows +1.67% average return over next 12 bars (48 hours at 4h timeframe).
#### Moderate Long Signal (Lower Conviction)
- ⚠️ Deviation between -1.5 and -2.0
- ⚠️ Avg |Corr| between 0.2-0.3
- ⚠️ Price approaching -2σ band
**Interpretation:** BTC is cheap but not extreme. Consider as confirmation for other signals.
#### Exit Signal
- 🔴 Deviation crosses above 0 (returns to fair value)
- 🔴 "EXIT" label appears above bar
**Interpretation:** Mean reversion complete. Close long positions.
#### Strong Short/Avoid Signal
- 🔴 Deviation > +2.0 (extreme overvaluation)
- 🔴 Avg |Corr| > 0.3
- 🔴 Price touching or above +2σ band
**Interpretation:** BTC is expensive vs macro. Historical data shows -1.79% average return over next 12 bars. Consider exiting longs or reducing exposure.
### Regime Detection
**Strong Regime (Reliable Signals):**
- Avg |Corr| > 0.3
- Multiple assets weighted > 0
- Fair value line tracking price reasonably well
**Weak Regime (Unreliable Signals):**
- Avg |Corr| < 0.2
- Most weights = 0 (grayed out)
- Fair value line diverging wildly from price
- **Action:** Ignore signals until correlations strengthen

📋 Trading Checklist – Precision Entry SystemTake your trading discipline to the next level with this Precision Trading Checklist for TradingView. Designed for intraday traders following liquidity, structure, and Smart Money Concepts (SMC) AKA ICT Concepts, this overlay ensures you never miss a key confirmation before entering a trade.
Features:
✅ Pre-Market Preparation: Track previous session highs/lows, AM/PM sessions, and key liquidity zones.
✅ Bias & Narrative Check: Quickly confirm daily trend, price position relative to daily open, and higher timeframe confluence.
✅ Session-Specific Rules: Focused sessions like Silver Bullet (10:00–11:30), Afternoon (13:30–15:00), and Final Hour (15:00–16:00).
✅ Structure & Setup Validation: Confirm liquidity sweeps, market structure shifts, expansion candles, fair value gaps, and order blocks.
✅ Risk Management Reminders: Stop-loss, target points, risk percentage, breakeven management, and pyramiding rules.
✅ Post-Trade Journaling: Document entries, session, setup type, trade outcome, and grading for continuous improvement.
✅ Golden Rules: Visual reminders to enforce discipline, avoid emotional trades, and respect session limits.
Why Use It:
This checklist is perfect for traders who want to stay consistent, minimise mistakes, and follow a disciplined routine. Displayed as an overlay on your chart, it provides all essential checks in one glance, keeping you focused on the setup rather than scrolling through notes or separate trackers.
How to use:
Add the indicator to your chart
Click the settings/gear icon
Check off items as you complete them
The checklist on your chart updates in real-time with green checkmarks!
The checkboxes will persist as long as the indicator is on your chart,
making it perfect for tracking your pre-trade and post-trade routines!
Follow the checklist items step by step before entering trades.
Use the session-specific guidelines to filter setups.
Journal your trades post-execution for growth and analysis.

Adil Hoca - US Market Score Only NasdaqMarket Score & Crash Detector Indicator
User Guide & Usage Instructions
This TradingView indicator provides a comprehensive market risk assessment, combining multiple financial metrics to detect potential market crashes, recessions, and overall trend regimes. It is especially designed to alert traders and investors about early warning signals before significant market downturns, enabling proactive decision-making.
Key Features
Multi-Metric Market Sentiment: Uses volatility indices, currency strength, yield spreads, breadth, and bond ratios to evaluate market health.
Crash Detection System: Monitors various conditions such as VIX spikes, breadth collapse, momentum cliffs, high-yield spread surges, and hidden market weaknesses.
Reccession Indicator: Incorporates the Sahm Rule, a proven recession indicator based on employment data.
Alert System: Sends real-time alerts for critical market conditions, including crashes, recession signals, and spreads alerts.
Visual Elements: Includes histograms, trend lines, threshold lines, and shape signals to visually interpret market states.
Customizable Parameters: Adjust weights, sensitivity, thresholds, and alert preferences to suit your trading style.
How it Works
1. Data Collection
The indicator fetches data from multiple sources:
Market volatility: VIX index
Currency strength: DXY index
Interest rates: SOFR, PCE inflation
Yield spreads: High Yield Credit Spread, Investment Grade Spread
Market Breadth: Ratio of QQQ to TLT (tech vs. bonds)
Bond Ratios: TMF/TMV (long-term bonds)
Employment Data: The Sahm Rule (monthly unemployment data)
2. Normalization
Data is normalized via z-score calculations over defined periods to standardize the metrics, making them comparable regardless of their original scale.
3. Composite Score Calculation
Each metric is weighted according to user-defined parameters, and a composite score is generated to represent the overall market sentiment, smoothed with an EMA for trend clarity.
4. Crash & Recession Detection
Crash System: Looks for conditions like VIX spikes, breadth collapse, momentum drops, high yield spread surges, and hidden weaknesses. If multiple conditions meet thresholds, alerts trigger.
Recession Indicator: Uses the Sahm Rule, which compares the current unemployment rate's three-month average to the lowest point over the past 12 months. When it exceeds a certain threshold, a recession signal is generated.
5. Alerts & Visualization
Sound & Shape Alerts: Signals like warning triangles, cross icons, and color changes.
Threshold Lines: Indicate levels like "Strong Bullish," "Strong Bear," and critical zones.
Dual Confirmation: Combines crash and recession signals for high-confidence alerts.
Usage & Customization
Placing the Indicator
Copy and paste the Pine Script code into TradingView's Pine Editor.
Save and add the script to your chart. Adjust inputs like weights, sensitivity mode, thresholds, and alert preferences via the input panel.
Key Inputs
Weights: Customize the importance of each metric.
Sensitivity Mode: Changes alert thresholds for early warnings.
Crash Sensitivity: Defines how many indicators need to trigger before issuing a crash alert.
Recession Thresholds: Set the unemployment level that signals recession.
Interpreting Visuals
Histogram: Shows the composite score; green means bullish, red indicates bearish.
Momentum Line: Highlights trend acceleration/deceleration.
Threshold Lines: Dotted/dashed lines showing critical zones.
Shape Shapes: Triangles or crosses appear for early signals or critical events.
Alerts
Crash Alerts: Warn of imminent market crashes.
Recession Alerts: Indicate economic downturns based on Sahm Rule.
Spread Alerts: Show high-yield credit spread surges signaling stress.
Double Confirmation: High-confidence signals when crash and recession conditions align.
Best Practices
Use on multiple timeframes for confirmation.
Combine with other technical analysis tools for better accuracy.
Adjust thresholds according to your risk appetite.
Follow alert signals for early warning but always consider overall context.
Final Notes
This indicator synthesizes a variety of leading and lagging indicators to give a holistic view of market health. It is designed to provide early warnings, especially in volatile or stressed environments, helping traders avoid severe drawdowns or position ahead of major downturns.
Feel free to modify input parameters for your preferences, or integrate additional data sources for further refinement.
This detailed explanation can be directly included as a description or documentation within your TradingView script, helping users grasp its full capabilities and optimal usage.

Simulated Fear & Greed (CNN-calibrated v2)🧭 Fear & Greed Index — TradingView Version (Simulated CNN Model)
🔍 Purpose
The Fear & Greed Index is a sentiment indicator that quantifies market emotion on a scale from 0 to 100, where:
0 represents Extreme Fear (capitulation, oversold conditions), and
100 represents Extreme Greed (euphoria, overbought conditions).
It helps traders assess whether the market is driven by fear (risk aversion) or greed (risk appetite) — giving a high-level view of potential turning points in market sentiment.
⚙️ How It Works in TradingView
Because TradingView cannot directly access CNN’s or alternative external sentiment feeds, this indicator simulates the Fear & Greed Index by analyzing in-chart technical data that reflect investor psychology.
It uses a multi-factor model, converting price and volume signals into a composite sentiment score.
🧩 Components Used (Simulated Metrics)
Category Metric Emotional Interpretation
Volatility ATR (Average True Range) High ATR = Fear, Low ATR = Greed
Momentum RSI + MACD Histogram Rising momentum = Greed, Falling = Fear
Volume Activity Volume Z-Score High positive deviation = Greed, Low = Fear
Trend Context SMA Regime Bias (50/200) Downtrend adds Fear penalty, Uptrend supports Greed
These elements are normalized into a 0–100 scale using percentile ranks (like statistical scoring) and then combined using user-adjustable weights.
⚖️ CNN-Style Calibration
The script follows CNN’s five sentiment bands for clarity:
Range Zone Colour Description
0–25 Extreme Fear 🔴 Red Panic, forced selling, capitulation risk
25–45 Fear 🟠 Orange Uncertainty, hesitation, early accumulation phase
45–55 Neutral ⚪ Gray Balanced sentiment, indecision
55–75 Greed 🟢 Light Green Optimism, trend continuation
75–100 Extreme Greed 💚 Bright Green Euphoria, risk of reversal
This structure aligns visually with CNN’s public gauge, making it easy to interpret.

Central Limit Theorem Reversion IndicatorDear TV community, let me introduce you to the first-ever Central Limit Theorem indicator on TradingView.
The Central Limit Theorem is used in statistics and it can be quite useful in quant trading and understanding market behaviors.
In short, the CLT states: "When you take repeated samples from any population and calculate their averages, those averages will form a normal (bell curve) distribution—no matter what the original data looks like."
In this CLT indicator, I use statistical theory to identify high-probability mean reversion opportunities in the markets. It calculates statistical confidence bands and z-scores to identify when price movements deviate significantly from their expected distribution, signaling potential reversion opportunities with quantifiable probability levels.
Mathematical Foundation
The Central Limit Theorem (CLT) says that when you average many data points together, those averages will form a predictable bell-curve pattern, even if the original data is completely random and unpredictable (which often is in the markets). This works no matter what you're measuring, and it gets more reliable as you use more data points.
Why using it for trading?
Individual price movements seem random and chaotic, but when we look at the average of many price movements, we can actually predict how they should behave statistically. This lets us spot when prices have moved "too far" from what's normal—and those extreme moves tend to snap back (mean reversion).
Key Formula:
Z = (X̄ - μ) / (σ / √n)
Where:
- X̄ = Sample mean (average return over n periods)
- μ = Population mean (long-term expected return)
- σ = Population standard deviation (volatility)
- n = Sample size
- σ/√n = Standard error of the mean
How I Apply CLT
Step 1: Calculate Returns
Measures how much price changed from one bar to the next (using logarithms for better statistical properties)
Step 2: Average Recent Returns
Takes the average of the last n returns (e.g., last 100 bars). This is your "sample mean."
Step 3: Find What's "Normal"
Looks at historical data to determine: a) What the typical average return should be (the long-term mean) and b) How volatile the market usually is (standard deviation)
Step 4: Calculate Standard Error
Determines how much sample averages naturally vary. Larger samples = smaller expected variation.
Step 5: Calculate Z-Score
Measures how unusual the current situation is.
Step 6: Draw Confidence Bands
Converts these statistical boundaries into actual price levels on your chart, showing where price is statistically expected to stay 95% and 99% of the time.
Interpretation & Usage
The Z-Score:
The z-score tells you how statistically unusual the current price deviation is:
|Z| < 1.0 → Normal behavior, no action
|Z| = 1.0 to 1.96 → Moderate deviation, watch closely
|Z| = 1.96 to 2.58 → Significant deviation (95%+), consider entry
|Z| > 2.58 → Extreme deviation (99%+), high probability setup
The Confidence Bands
- Upper Red Bands: 95% and 99% overbought zones → Expect mean reversion downward as the price is not likely to cross these lines.
- Center Gray Line: Statistical expectation (fair value)
- Lower Blue Bands: 95% and 99% oversold zones → Expect mean reversion upward
Trading Logic:
- When price exceeds the upper 95% band (z-score > +1.96), there's only a 5% probability this is random noise → Strong sell/short signal
- When price falls below the lower 95% band (z-score < -1.96), there's a 95% statistical expectation of upward reversion → Strong buy/long signal
Background Gradient
The background color provides real-time visual feedback:
- Blue shades: Oversold conditions, expect upward reversion
- Red shades: Overbought conditions, expect downward reversion
- Intensity: Darker colors indicate stronger statistical significance
Trading Strategy Examples
Hypothetically, this is how the indicator could be used:
- Long: Z-score < -1.96 (below 95% confidence band)
- Short: Z-score > +1.96 (above 95% confidence band)
- Take profit when price returns to center line (Z ≈ 0)
Input Parameters
Sample Size (n) - Default: 100
Lookback Period (m) - Default: 100
You can also create alerts based on the indicator.
Final notes:
- The indicator uses logarithmic returns for better statistical properties
- Converts statistical bands back to price space for practical use
- Adaptive volatility: Bands automatically widen in high volatility, narrow in low volatility
- No repainting: yay! All calculations use historical data only
Feedback is more than welcome!
Henri

Order Blocks Zones with Signals█ OVERVIEW
“Order Blocks Zones with Signals” is a technical analysis tool that automatically identifies Order Blocks (OB) and optionally Fair Value Gaps (FVG) on the chart.
The script visualizes these zones as colored rectangles, offering full customization of style, transparency, and signal display.
It also generates entry and exit signals (Break & Exit) that can serve as confirmations in strategies based on price action and market structure.
Thanks to flexible candle size filters and rich visual options, the indicator maintains chart clarity and readability.
█ CONCEPTS
Order Blocks (OB) are key zones on the chart where significant price movements previously occurred — areas where large market participants (institutions, so-called smart money) initiated or closed positions.
An OB is the last candle that followed the prior trend before the market reversed (e.g., for a Bullish OB: the last bearish candle before a pivot low and a strong upward impulse).
The script detects these levels using local price pivots, analyzing candle direction to filter out less significant movements.
FVG (Fair Value Gaps) represent areas of imbalance between buyers and sellers — price gaps formed by a sharp impulse where full trading did not occur due to one-sided order dominance (e.g., excess buy or sell orders).
Why combine OB and FVG in one indicator?
Combining OB and FVG analysis is essential because these phenomena often occur sequentially in the institutional market cycle:
1. Order Block — institutions enter the market in the OB zone, absorbing orders and building positions.
2. Strong impulse — after smart money entry, a rapid price move creates an FVG (imbalance gap).
3. Retest — price naturally returns to these zones (OB or FVG), drawn by unfilled orders and the search for equilibrium.
Such areas strongly attract price, as they represent not only historical institutional levels but also open “holes” in the order book. Retests of OB and FVG are ideal entry opportunities with high reaction probability (rebound or breakout). The indicator combines these two interconnected elements, enabling comprehensive market structure analysis in a single tool.
Order Blocks are labeled as:
Bullish OB – demand zones, often accumulation areas before an upmove.
Bearish OB – supply zones, signaling potential impulse end or correction start.
█ FEATURES
Order Block Detection (OB Detection):
- Automatic identification of demand and supply zones based on pivots.
- OB is the last candle aligned with the prior trend, just before the market reversal — precisely identified through candle sequence analysis around the pivot.
- OB zones appear with a delay equal to Pivot Length (default 10 bars).
- Break signals trigger when a candle’s body (close) fully pierces the zone, causing the zone to disappear immediately (e.g., close < low of Bullish OB → Break Down and zone deletion).
- Minimum size filtering via OB Size Multiplier.
- Option to create OB without wicks (Include Wicks in OB): when disabled, OB zones are based solely on candle bodies (open/close), ignoring wicks (high/low).
Fair Value Gap Detection (FVG Detection):
- Optional, with enable/disable capability.
- FVG are detected without delay — immediately upon gap occurrence.
- Size filtering via Candle Size Period and FVG Size Multiplier.
Customizable Styling:
- Separate colors and border styles (Solid / Dashed / Dotted) for each zone type.
- Adjustable transparency and border thickness.
- Unified color for box, border, and signal of the same type.
Breakout and Exit Signals:
- Break Up – triggered when a candle’s close breaks above a Bearish OB, causing the zone to disappear.
- Break Down – triggered when a candle’s close breaks below a Bullish OB, causing the zone to disappear.
- Exit Up / Exit Down – temporary exit from the zone without full breakout (price leaves the zone but doesn’t close beyond it). Signal type selection: Break, Exit, or Both.
- Alerts: built-in alerts for all signal types — triggered automatically on candle close confirming breakout or exit from OB.
█ HOW TO USE
Adding to chart: import the code into Pine Editor and run the script on TradingView.
Settings configuration:
- Pivot Length: controls swing detection sensitivity and OB display delay (default 10).
- Include Wicks in OB: enabled (default) – OB includes wicks; disabled – OB uses bodies only.
- Size Filter: adjust Candle Size Period and OB/FVG Size Multiplier to filter out small zones.
- Colors & Styles: set colors, styles, and transparency for each zone type.
- Signal Type: choose which signals to display (Break, Exit, or Both).
Signal interpretation:
- OB Break Up: price closes above Bearish OB → zone disappears → potential bullish continuation.
- OB Break Down: price closes below Bullish OB → zone disappears → potential bearish continuation.
- Exit Signals: price leaves the zone temporarily without breakout — often signals impending reversal or pullback.
Tips:
- Use OB signals alongside other indicators like RSI, MACD, SMI, or trend filters.
- Order Blocks from higher timeframes (e.g., 4H, 1D) carry greater significance and reaction strength.
- Remember: FVG are detected immediately, OB with delay — a complementary approach!
█ APPLICATIONS
- Smart Money Concepts (SMC): use OB zones as dynamic support and resistance levels. In an uptrend, look for buy opportunities in bullish OBs, which price often retests before further gains. Combining with RSI, MACD, or Fibonacci levels enhances zone significance, confirming institutional demand.
- Breakout Trading: trade based on OB breakout signals. A buy signal after breaking a bearish OB may indicate a strong upward impulse, especially if supported by rising MACD or RSI above 50. Similarly for sell signals after Break Down.
- Reversal Zones: Exit signals may indicate the end of a move or correction. Safest to use in alignment with higher-timeframe trend and confirmed by another indicator (e.g., RSI divergence, Fibonacci levels).
- Confluence Analysis: combine OB and FVG for deeper market structure and equilibrium insight. When an Order Block overlaps or borders an FVG, we get confluence of two institutional phenomena — OB (smart money entry) + FVG (imbalance) — making these areas particularly strong price magnets, increasing retest and reaction probability.
█ NOTES
- FVG can be fully disabled for a cleaner chart view.
- In consolidation periods, signals may appear more frequently — always confirm with additional trend filters.
- Works on all markets and timeframes (crypto, forex, indices, stocks).

8x Heikin Ashi Streak (1m) by Bitcoin Benito🧭 Indicator Description: “8x Heikin Ashi Streak (1m) by Bitcoin Benito”
**Purpose:**
The *8x Heikin Ashi Streak* indicator helps traders quickly identify strong short-term momentum on the **1-minute timeframe**. It automatically tracks Heikin Ashi candles and alerts you whenever **8 consecutive bullish or bearish candles** appear — a visual cue that a strong intraday trend or exhaustion point might be forming.
---
🔍 **How It Works**
* The indicator continuously counts Heikin Ashi candles in real-time.
* When it detects **8 bullish (green)** or **8 bearish (red)** candles in a row:
* A green ▲ marker appears **below** the 8th candle for bullish streaks.
* A red ▼ marker appears **above** the 8th candle for bearish streaks.
* You can set alerts to automatically notify you when these streaks occur.
This makes it ideal for **momentum traders**, **scalpers**, and **trend-reversal spotters** who want to:
* Catch strong intraday moves early.
* Identify potential overextension zones before pullbacks.
* Automate alert signals for short-term trading setups.
IMPORTANT: Only trade when most of the 8 candles are below/above the EMA 8 Line respectively. Add an EMA 8 indicator to see if this is the case
---
⚙️ **How to Use**
1. **Apply to a 1-minute chart** (this script is optimized for 1m timeframes).
2. When the indicator plots a green or red triangle:
* **Green triangle (8 bullish candles):** Trend momentum is strong upward.
* **Red triangle (8 bearish candles):** Downward momentum is dominant.
3. Optionally, combine with volume or EMA filters to confirm breakouts or exhaustion.
---
🔔 **Setting Up Alerts**
* Click the **Alert (🔔)** icon on TradingView.
* Under *Condition*, select:
* “8x Heikin Ashi Streak (1m)” → “8 Bullish Heikin Ashi (1m)”
* OR “8x Heikin Ashi Streak (1m)” → “8 Bearish Heikin Ashi (1m)”
* Choose **Once per bar close** to trigger the alert when the 8th candle completes.
* Add your custom message, e.g.
> “🚀 8 bullish Heikin Ashi candles in a row on 1-minute chart!”
> “🔻 8 bearish Heikin Ashi candles in a row on 1-minute chart!”
---
📊 **Best Practices**
* Works best on **liquid assets** (major forex pairs, indices, BTC/USD, etc.).
* Pair with **RSI**, **EMA**, or **Volume** indicators for stronger confirmation.
* Not a standalone buy/sell signal — treat it as a **momentum or exhaustion alert**.
* Can be adapted to other timeframes by changing chart resolution.
---
⚠️ **Disclaimer**
This indicator is for **educational and analytical purposes only**.
Trading carries risk — always test on demo accounts and use proper risk management.
No indicator guarantees profit; this is a tool for insight and timing, not financial advice.

PriceAction & Economic StrategyThis indicator combines price-action logic with macroeconomic data to generate trading signals.
Features:
- Price-action signals: A bullish signal occurs when a candle closes above its open; a bearish signal occurs when a candle closes below its open.
- Signal gap: The indicator includes an input called "Signal Gap (bars)" that defines the minimum number of bars between signals. By default the gap is set to 3, but you can adjust this between 1 and 10 to control signal frequency.
- Alerts: The script defines alert conditions for long and short signals, allowing you to create TradingView alerts that notify you when a new signal occurs.
- Economic data: The script uses TradingView's built-in `request.economic()` function to request U.S. GDP data. The GDP series is plotted in the Data Window for additional macroeconomic context.
How to use:
1. Add the indicator to a chart.
2. Open the indicator's settings and adjust the "Signal Gap (bars)" input to set the minimum bar gap between signals.
3. Look for green triangles plotted below the bars (bullish signals) and red triangles plotted above the bars (bearish signals). These appear only when the gap criterion is met.
4. If you want alerts, click the Alert button in TradingView, select this indicator, and choose either the Long or Short alert conditions.
5. To view the GDP data, open the Data Window; the GDP value will be shown alongside other series for each bar.
6. Use these signals in combination with your own analysis; this indicator is for educational purposes and does not constitute financial advice.

Auto Fibonacci LevelsAuto Fibonacci Momentum Zones with Visible Range Table
Overview and Originality
The Auto Fibonacci Momentum Zones indicator offers a streamlined, static overlay of Fibonacci retracement levels inspired by extreme RSI momentum thresholds, enhanced with a dynamic table displaying the high and low of the currently visible chart range. This isn't a repackaged RSI oscillator or basic Fib drawer—common in TradingView's library—but a purposeful fusion of geometric harmony (Fibonacci ratios) with momentum psychology (RSI extremes at 35/85), projected as fixed horizontal reference lines on the price chart. The addition of the visible range table, powered by PineCoders' VisibleChart library, provides real-time context for the chart's current view, enabling traders to quickly assess range compression or expansion relative to these zones.
This script's originality stems from its "static momentum mapping": by hardcoding Fib levels on a dynamic chart, it creates universal psychological support/resistance lines that transcend specific assets or timeframes.
Unlike dynamic Fib tools that auto-adjust to price swings (risking noise in ranging markets) or standalone RSI plots (confined to panes), this delivers clean, bias-adjustable overlays for confluence analysis. The visible range table justifies the library integration—it's not a gratuitous add-on but a complementary tool that quantifies the "screen real estate" of price action, helping users correlate Fib touches with actual volatility. Drawn from original code (no auto-generation or public templates), it builds TradingView's body of knowledge by simplifying multi-tool workflows into one indicator, ideal for discretionary traders who value visual efficiency over algorithmic complexity.
How It Works: Underlying Concepts
Fibonacci retracements, derived from the Fibonacci sequence and the golden ratio (≈0.618), identify potential reversal points based on the idea that markets retrace prior moves in predictable proportions: shallow (23.6%, 38.2%), mid (50%), and deep (61.8%, 78.6%).
Adjustable Outputs
1. The "Invert Fibs" toggle (default: true) for bearish/topping bias, can be flipped aligning with trend context.
2. Fibonacci Levels: Seven semi-transparent horizontal lines are drawn using `hline()`:
- 0.0 at high (gray).
- 0.236: high - (range × 0.236) (light cyan, shallow pullback).
- 0.382: high - (range × 0.382) (teal, common retracement).
- 0.5: midpoint average (green, equilibrium).
- 0.618: high - (range × 0.618) (amber, golden pocket for reversals).
- 0.786: high - (range × 0.786) (orange, deep support).
- 1.0 at low (gray).
Colors progress from cool (shallow) to warm (deep) for intuitive scanning.
3. Optional Fib Labels: Right-edge text labels (e.g., "0.618") appear only if enabled, positioned at the last bar + offset for non-cluttering visibility.
4. Visible Range Table: Leveraging the VisibleChart library's `visible.high()` and `visible.low()` functions, a compact 2x2 table (top-right corner) updates on the last bar to show the extrema of bars currently in view. This mashup enhances utility: Fib zones provide fixed anchors, while the table's dynamic values reveal if price is "pinned" to a zone (e.g., visible high hugging 0.382 signals resistance). The library is invoked sparingly for performance, adding value by bridging static geometry with viewport-aware data—unavailable in built-ins without custom code.
How to Use It
1. Setup:
Add to any chart (e.g., 15M for scalps, Daily for swings). As an overlay, lines appear directly on price candles—adjust chart scaling if needed.
2. Input Tweaks:
Invert Fibs: Enable for downtrends (85 top), disable for uptrends (35 bottom).
Show Fibs: Toggle labels for ratio callouts (off for clean charts).
Show Table: Display/hide the visible high/low summary (red for high, green for low, formatted to 2 decimals).
3. Trading Application:
Zone Confluence: Seek price reactions at each fibonacci level—e.g., a doji at 0.618 + rising volume suggests entry; use 0.0/1.0 as invalidation.
Range Context: Check the table: If visible high/low spans <20% of the Fib arc (e.g., both near 0.5), anticipate breakout; wider spans signal consolidation.
Multi-Timeframe: Overlay on higher TF for bias, lower for precision—e.g., Daily Fibs guide 1H entries.
Enhancements: Pair with volume or candlesticks; set alerts on line crosses via TradingView's built-in tools. Backtest on your symbols to validate (e.g., equities favor 0.382, forex the 0.786).
This indicator automates advanced Fibonacci synthesis dynamically, eliminating manual measurement and calculations.
published by ozzy_livin

TI65**TI65 (Trend Intensity 65)** is a technical indicator designed to measure the strength and momentum of a trend over two distinct periods. It compares a short-term 7-period simple moving average (SMA) with a long-term 65-period SMA, producing a ratio that helps traders identify shifts in market momentum and trend direction.
- When the **TI65 value is greater than 1**, it indicates that the short-term moving average is above the long-term average, suggesting increasing momentum and a potentially bullish trend.
- When the **TI65 value drops below 1**, it signals weakening short-term momentum relative to the longer-term trend, often interpreted as a bearish or consolidating phase.
This indicator can be applied to both price and volume data, making it useful for identifying periods of strong volume surges or price movements. By observing changes in the TI65 ratio, traders can pinpoint low-risk entry points for trend-following strategies and quickly recognize periods of market transition.
TI65 is commonly used by momentum and breakout traders for screening strong candidates and confirming the sustainability of ongoing trends. It is simple, effective, and easily implemented via custom scripts on popular platforms like TradingView.