Turbo TriggerSome Words
This indicator is a collaboration between me and Himeyuri, i encourage you to check her profile and follow her www.tradingview.com
Introduction
A lot of indicators include a "trigger" line, it can be a smoothed version of another input, in this case the trigger will generate signals from his crosses with the input. The purpose of this indicator is to provide a fast trigger line to generate earlier signals as well as avoiding some whipsaw.
The Indicator
There are two lines, a bull line (blue) and the trigger (orange) , when the trigger cross over the bull line a buy signal is generated, when the trigger cross under the bull line a sell signal is generated. The trigger is made from the smoothed difference between the bull and bear line.
smooth control the smoothness of the output. The Bull/Bear Mode is an idea proposed by Himeyuri that involve plotting the bear line instead of the trigger.
Bull/Bear Mode, the lines are somewhat asymmetrical from each others.
Conclusion
We have showcased a new indicator who use a really fast trigger line to generate earlier signals, if some are way to earlier you can still increase smooth in order to correct reactivity. I hope you find a use to it.
Thanks for reading !
A big thanks to Himeyuri who is a great student and great pinescripter.
Tìm kiếm tập lệnh với "trigger"

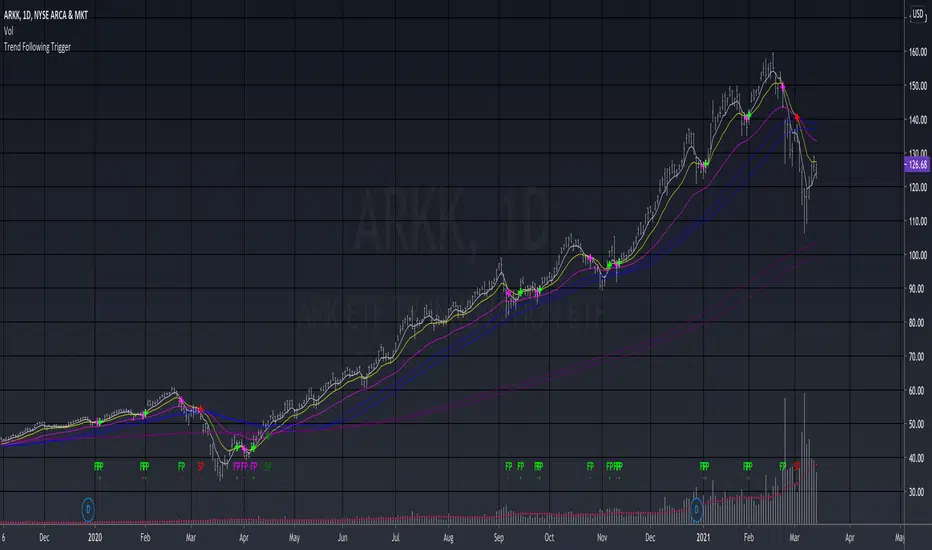
Trend Following TriggerThis is a basic trend following system that using 5, 13, 34 EMAs cross-overs as triggers.
The 5,13 EMA pair is tracking the short-term momentum , when 5 EMA crosses over 13 EMA up or down, the script will develop a bullish "fast pivot" point or "FP" , which can be used as the first entry of a position.
The 13, 34 EMA pair is tracking the mid-term trend , when the 13 EMA crosses over 34 EMA up or down, the script will develop a bullish "slow pivot" point or "SP" , which can be used as the second entry of a position.
And the exit would be when a bearish "Slow Pivot" is created.
Note that the basic assumption of trend following is that you should trade with the trend, not against the trend. Thus I added the 50, 60 MA pair, as well as 200, 220 MA pair for long-term trend reference, which is an idea that I learned from the Vegas Tunneling Trading System.
Example,
Forex Scalp Triggersthe triggers only work to tell you go back 5 candles on 5 min, take either lowest or highest plus 3 pips and make entry and go 3 pip over under trigger for stop loss. can take half profit at 1x and move stop to break even and go 1x more for take rest profit, or create a trailing stop loss on Take Profit level 2 and ride the trend.
1 Hour chart has to be over under the emas that are faned out nicely to move to 5 min chart to look for the signals if 1hr chart isnt over under the emas nicely then NO TRADE
ForexSignalTV helped create this strategy, just my first script so learning, want to take it to next level but kind of stuck for now. More knowledge coming...
Volatility Trigger IndexThe script allows to assess the volatility of an asset.
It works by calculating the rate of change and the standard deviation.
The index is useful to determine the lowest volatility periods (could be useful to look strategies) and also it determine the highest volatility periods (maybe for exits or partial closes).
It has 3 iputs:
Lenght.
Low volatility value.
High volatility value.
The low and high values are set after a visual inspection. The values changes in each time frame. Usually when the timeframe is higher the value of the index is higher as well. So the low and high levels must be changed after each time frame set.
As an idea could be used in combination with any moving average to determine the market direction and the index used as a trigger.

Run Up/Down TriggerTriggers for a sequential number of periods going up or down, with separate thresholds for up and down.

Joe's Ultimate MA Ribbon (w/ Crossover Triggers)Tired of having to add multiple moving average indicators to your chart? Well, stop doing that.
Here's a sweet moving average ribbon (with 1-10 moving average lines!) that will make your charts look much cooler 😎.
Not only that, it also includes triggers for MA crossovers. So, yeah...you can pick which MA crossovers trigger for longs and shorts separately. Yup, you read that right.
Options:
Show/Hide MA Lines: Only show the lines you wanna see. No more. No less.
MA Type (can be different for each line!): EMA, SMA, SMMA (RMA), WMA, VWMA
MA Source (for each line): open, close, high, low, hl2, hlc3, ohlc4, hlcc4
MA Length (for each line): any number between 1 and 4999
Line Colors: Ooh, pretty.
Triggers: On or Off
Crossover Long Triggers: When _______ crosses over _______ on timeframe _______
Crossover Short Triggers: When _______ crosses over _______ on timeframe _______
Trigger Characters and Location

Hurst Dual-Channel + ECDF Early Reentry (Single Trigger)Hello,
This indicator can be useful during ranging market phases, especially on short timeframes such as 5 minutes, within a statistically contrarian approach.
It combines two quantitative methodologies:
– Hurst-type adaptive channels, which measure short- and medium-term price deviations using the ATR (Average True Range);
– an Empirical Cumulative Distribution Function (ECDF), which locates the current price between its recent extremes (0 corresponding to the lower bound, 1 to the upper bound).
The goal is to identify relative overbought and oversold zones, where the price exceeds the channels and then begins to revert toward its statistical mean.
The indicator does not issue trading recommendations: it merely highlights specific statistical conditions for research and analytical purposes.
The “BUY” and “SELL” labels indicate such technical configurations:
– ECDF < 0.2 with price returning above the lower channels → bullish reentry.
– ECDF > 0.9 with price returning below the upper channels → bearish reentry.
The parameters (channel periods, ECDF window, smoothing) allow you to fine-tune the sensitivity of the analysis according to instrument volatility or chosen timeframe.
🟩 Buy Signal (BUY)
A buy signal is triggered when a strong downside deviation pushes the price below both channels, followed by a gradual reentry inside the bands.
More precisely:
– The low is below both channels (low < scb and low < mcb).
– The ECDF crosses back above 0.19 (exit from oversold).
– Both events occur within the last six bars.
– The price moves back above the lower channel (high > scb).
– No previous long signal is active.
This configuration represents a statistical reentry to the mean after an excessive drop.
🟥 Sell Signal (SELL)
Conversely, a sell signal appears when a strong upside deviation pushes the price above both channels, followed by a pullback below them:
– The high exceeds both channels (high > sct and high > mct).
– The ECDF crosses below 0.9 (exit from overbought).
– Both events occur within the last six bars.
– The price falls back below the upper channel (low < sct).
– No previous short signal is active.
This reflects a bearish reentry following a statistical overextension.
⚙️ Operating Logic
Each signal is triggered only once per cycle thanks to the variables triggered_long and triggered_short, preventing duplicates until a new extreme occurs.
The tool is designed for visual analysis and pattern research, not for automated execution.
🔍 ECDF Principle and Calculation
The ECDF is a non-parametric measure of a value’s position within its recent distribution:
ECDF(X)=number of values ≤XNECDF(X) = \frac{\text{number of values } \le X}{N}ECDF(X)=Nnumber of values ≤X
It expresses the empirical proportion of observations below the current value.
Example:
If, among the last 100 observations, 85 are below the current price, then
ECDF=0.85ECDF = 0.85ECDF=0.85
→ The price is at the 85th percentile, statistically high relative to recent history.
Strengths: robust, model-free, well-suited to asymmetric or non-normal market regimes.
Limitations: it does not measure amplitude and depends on the selected window size.
🌊 Intuitive Analogy: The River and the Gauge
Imagine a river with a depth gauge:
– The Z-Score tells you how many meters above the average level the water currently stands.
– The ECDF tells you in how many past cases the water level was lower than it is now.
The Z-Score assumes the river always follows the same symmetrical pattern.
The ECDF simply observes reality — adapting naturally, even when the current becomes unpredictable.
Final note:
This indicator is designed for visual and statistical exploration of price behavior.
The signals represent statistical states, not trade instructions.
Entering long or short positions based on them is entirely at your own discretion and risk.

Multi-Functional Fisher Transform MTF with MACDL TRIGGERWhat this indicator gives you is a true signal when price is exhausted and ready for a fast turnaround. Fisher Transform is set for multi-time frame and also allows the user to change the length. This way a user can compare two or more time spans and lengths to look for these MACDL divergent triggers after a Fisher exhaustion. With so many indicators, it's probably best to merge these indicators and change the Fisher and Trigger colors so you can still have a look at price action (remember to scale right after merger). I've noticed from time to time when you have Fisher 34 100 and 300 up and running on two different time frames such as 5 and 15 min charts, with MACDL triggers on the 100/300 or 34/100 you get a high probability trade trigger. However, there are rare exceptions such as when price moves in a parabolic state up or down for a long period where this indication does not work. Ideally this indicator works best in a sideways market or slow rising/descending moving market.
This indicator was worked on by Glaz, nmike and myself
LazyBear also introduced the MACDL indicator

SMI Base-Trigger Bullish Re-acceleration (Higher High)Description
What it does
This indicator highlights a two-step bullish pattern using Stochastic Momentum Index (SMI) plus an ATR distance filter:
1. Base (orange) – Marks a momentum “reset.” A base prints when SMI %K crosses up through %D while %K is below the Base level (default -70). The base stores the base price and starts a waiting window.
2. Trigger (green) – Confirms momentum and price strength. A trigger prints only if, before the timeout window ends:
• SMI %K crosses up through %D again,
• %K is above the Trigger level (default -60),
• Close > Base Price, and
• Price has advanced at least Min ATR multiple (default 1.0× the 14-period ATR) above the base price.
A dashed green line connects the base to the trigger.
Why it’s useful
It seeks a bullish divergence / reacceleration: momentum recovers from deeply negative territory, then price reclaims and exceeds the base by a volatility-aware margin. This helps filter out weak “oversold bounces.”
Signals
• Base ▲ (orange): Potential setup begins.
• Trigger ▲ (green): Confirmation—momentum and price agree.
Inputs (key ones)
• %K Length / EMA Smoothing / %D Length: SMI construction.
• Base when %K < (default -70): depth required for a valid reset.
• Trigger when %K > (default -60): strength required on confirmation.
• Base timeout (days) (default 100): maximum look-ahead window.
• ATR Length (default 14) and Min ATR multiple (default 1.0): price must exceed the base by this ATR-scaled distance.
How traders use it (example rules)
• Entry: On the Trigger.
• Risk: A common approach is a stop somewhere between the base price and a multiple of ATR below trigger; or use your system’s volatility stop.
• Exits: Your choice—trend MA cross, fixed R multiple, or structure-based levels.
Notes & tips
• Works best on liquid symbols and mid-to-higher timeframes (reduce noise).
• Increase Min ATR multiple to demand stronger price confirmation; tighten or widen Base/Trigger levels to fit your market.
• This script plots signals only; convert to a strategy to backtest entries/exits.

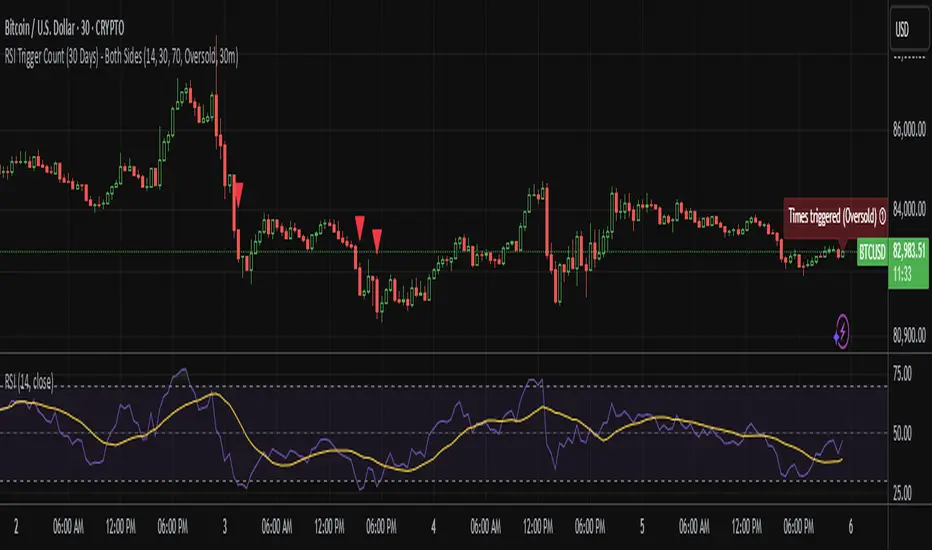
RSI Trigger Count (30 Days) - Both SidesRSI Dual Trigger Counter (30 Days)
This indicator tracks both oversold ( crossunder ) and overbought ( crossover ) RSI events on a 30-minute chart, featuring:
Dual-Mode Selector:
Counts either RSI < 30 (oversold) or RSI > 70 (overbought) crossings
Toggle between modes via input menu
30-Day Rolling Count:
Displays total triggers in the last 30 days (e.g., "Times triggered (Oversold) ① 19")
Visual Alerts:
Red triangles ↓ for oversold crossunders
Green triangles ↑ for overbought crossovers
Customizable:
Adjustable RSI length (2-100) and thresholds (1-100)
Works on any timeframe (auto-scales calculations)
Purpose: Identifies frequent reversal signals for both buying dips (oversold) and selling rallies (overbought).
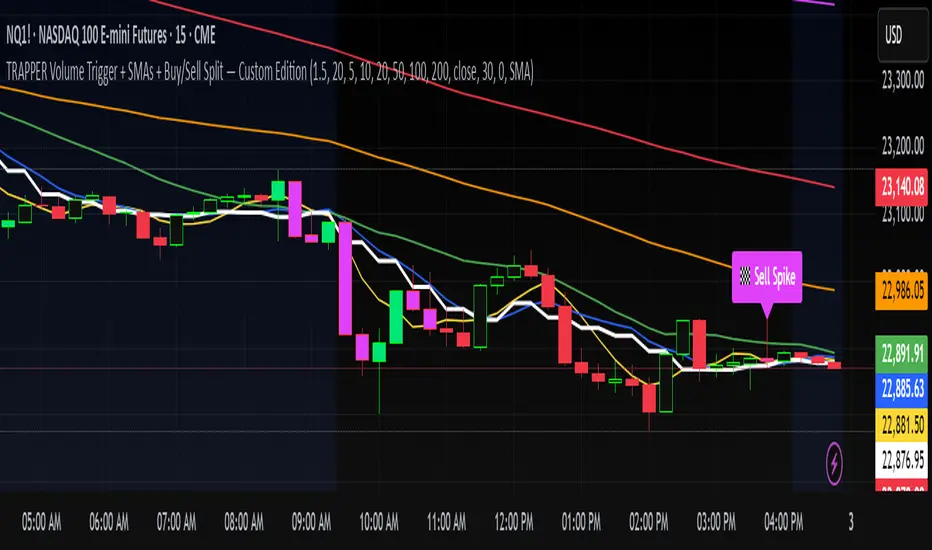
TRAPPER Volume Trigger + SMAs + Buy/Sell SplitThe TRAPPER TRIGGER is a precision-based volume spike indicator designed for intraday traders, scalpers, and swing traders who rely on key volume activity to anticipate sharp market movements. It operates on volume delta logic, detecting disproportionate buying or selling activity that signifies potential market reversals or breakouts.
How It Works:
Volume Spike Logic (Delta-Based)
The script calculates a dynamic volume threshold using a moving average of historical volume data.
It identifies a delta spike by comparing current volume against this threshold—when volume exceeds it significantly, it suggests abnormal activity.
If the candle closes higher than it opens (bullish), the script registers it as a Buy Spike ⚖️.
If the candle closes lower than it opens (bearish), it marks a Sell Spike 🏁.
These are not based on the candle’s body size but the volume differential (delta) between buy/sell pressure inferred from candle direction.
Trigger Labels
Only the most recent buy/sell spike is labeled for clarity, avoiding clutter.
Labels are color-coded to match the candle body (e.g., bright green for bullish, magenta for bearish).
Label style: ⚖️ for Buy Spikes, 🏁 for Sell Spikes.
SMA Suite (Fully Customizable):
Six SMAs: 5 (yellow), 10 (blue), 20 (green), 50 (orange), 100 (red), 200 (white).
Each can be toggled and customized in the script settings for visibility and styling.
Key Benefits
Clean, minimalistic charting — focuses only on high-probability events.
Provides delta-driven insights without requiring access to full L2 order book data.
Works across any timeframe — logic recalculates and resets zones per timeframe switch.
Designed for sniper-style entries—ideal for traders who prefer minimal noise and maximum signal clarity.
Easily extendable with SR zones, AVWAP, liquidity levels, or alerts if desired in future updates.
Who It’s For
Scalpers and intraday traders looking for clean triggers.
Swing traders wanting confirmation of institutional moves.
Volume profile enthusiasts who need a trigger alert system.
Developers who want a base volume framework to build more advanced tools on.
Disclaimer
This script is provided as-is and is intended for educational and informational purposes only. It does not constitute financial advice, investment recommendations, or a solicitation to buy or sell any security or asset.
All trading involves risk. Users should perform their own due diligence and consult with a qualified financial advisor before making any trading decisions. The author of this script assumes no liability for any losses or damages arising from the use or reliance on this tool.
By using this script, you acknowledge and agree that you are solely responsible for your own trading decisions and outcomes.
Z-Score Triggered VWAP# Z-Score Triggered VWAP Indicator
This custom indicator combines Volume-Weighted Average Price (VWAP) with Z-Score analysis to create a dynamic, volume-sensitive trading tool. It's designed to identify significant volume events and adjust the VWAP calculation accordingly, providing traders with a more responsive and adaptive price average.
## Key Features:
1. **Z-Score Triggered VWAP**: The indicator calculates a new VWAP when the volume Z-Score crosses above a user-defined threshold, allowing it to adapt to significant volume events.
2. **Customizable Timeframes**: Users can set different timeframes for Z-Score calculation and VWAP plotting, enabling multi-timeframe analysis.
3. **Dynamic Bands**: The indicator plots two sets of bands around the VWAP, calculated using standard deviation multipliers, which can be customized by the user.
4. **Visual Cues**: New VWAP start points are marked with yellow circles, helping traders identify where calculations reset.
5. **Real-time Information**: The current Z-Score and VWAP start information are displayed on the chart, providing immediate context.
6. **Flexible Appearance**: Users can customize colors and choose whether to display bands, enhancing chart readability.
7. **Multiple Alert Conditions**: The indicator includes alert conditions for price crossovers of the VWAP and all band levels.
## How It Works:
1. The indicator calculates the volume Z-Score on a user-specified timeframe, comparing current volume to historical volume over a lookback period.
2. When the volume Z-Score exceeds the threshold, a new VWAP calculation is triggered, resetting the cumulative values used in the VWAP formula.
3. The VWAP is continuously calculated and plotted on the chart, along with upper and lower bands based on price deviation from the VWAP.
4. Traders can use the VWAP line and bands to identify potential support/resistance levels and overbought/oversold conditions.
5. The Z-Score trigger helps ensure that the VWAP remains relevant by adapting to significant changes in trading volume.
## Trading Applications:
- **Dynamic Support/Resistance**: Use the VWAP and bands as potential support and resistance levels that adapt to changing market conditions.
- **Trend Identification**: The slope of the VWAP can help identify the overall trend direction.
- **Mean Reversion**: Look for potential reversals when price reaches the outer bands.
- **Volume Analysis**: The Z-Score trigger points highlight periods of unusual volume, which may precede significant price moves.
- **Risk Management**: Use the bands as potential stop-loss or take-profit levels.
This indicator is suitable for traders who want a more dynamic alternative to traditional VWAP indicators, especially those trading in markets with variable volume patterns. It combines volume analysis with price action, providing a comprehensive view of market behaviour
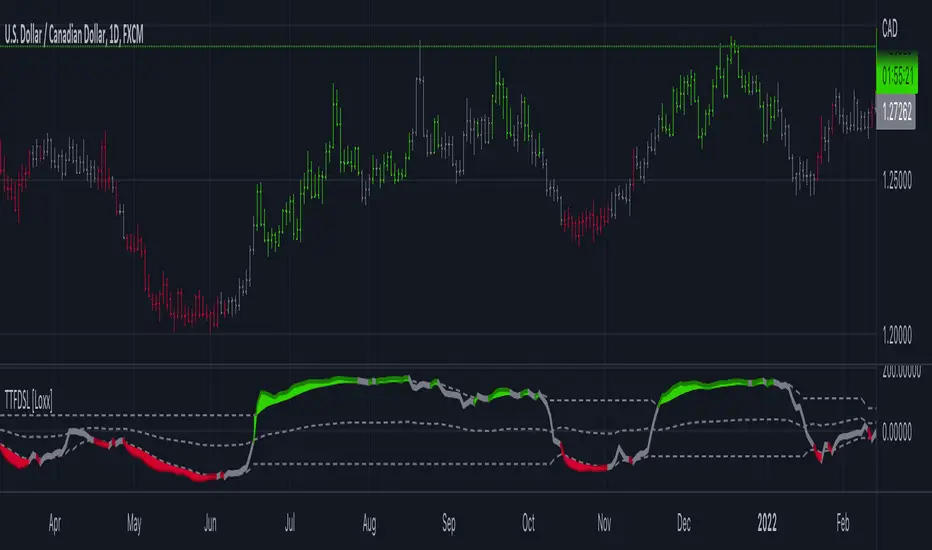
Trend Trigger Factor w/ Discontinued Signal Lines [Loxx]Trend Trigger Factor w/ Discontinued Signal Lines is a Trend Trigger Factor indicator with floating boundary lines to identify trends earlier
What is the Trend Trigger Factor?
Designed by M.H. Pee, the Trend Trigger Factors role is to help traders detect uptrends and downtrends and thus allow them to better position themselves in a with-trend manner. Its creator argues that the markets are mostly random but have a small trend component, which is the most crucial part of trading success. Being able to determine whether the market is in a bull or bear trend and how strong that trend is will allow you to be on the right side of the market for longer, capitalizing as much as possible on its trending behavior.
In his article, M.H. Pee used a 15-period trackback span to explain the calculations. The TTF formula is based on the so-called Buy Power and Sell Power. In his example, Pee labeled today as day 1, yesterday as day 2, the preceding day as day 3 and so on
What's new in this indicator?
Averages filter out prices prior to being used in calculation. That way the lag added is smaller than when the smoothing is used on the calculated result.
Unlike the original which uses levels +100 and -100 as significant levels for signal triggering, this version is using discontinued signal lines for trend filtering. That way it makes it a bit more responsive to market conditions
How do I use this?
The Trend Trigger Factor is similar in interpretation to the Relative Strength Index. It is plotted on a scale with most prominent levels at +100 and -100, crosses of which logically signal possible trade entries. The difference here, however, is that the upper and lower boundary flex with price movements so the upper and lower boundary shift dynamically. Crosses above the top line signify bullish sentiment, crossed below the the bottom line signify bearish sentiment.
Harmonic Sniper Trigger [Fisher] - PyraTime**Concept: Precision Momentum**
The Harmonic Sniper Trigger is a custom-tuned implementation of the Fisher Transform, designed specifically to identify sharp market reversals with zero lag. Unlike standard moving averages that react slowly to price changes, the Fisher Transform uses Gaussian probability to convert price into a normal distribution, creating clear, sharp turning points.
This indicator serves as the *Trigger* component of the PyraTime system. While Time Cycles tell you *when* to look, this indicator tells you *what* to do.
Key Features
Visual Signal Markers : Prints clear "B" (Buy) and "S" (Sell) labels on the oscillator pane for instant recognition.
Trend Fills : Dynamic Green/Red shading between the signal lines makes it easy to identify trend direction at a glance.
Integrated Alerts: Fully compatible with TradingView alerts, allowing you to be notified the second momentum flips.
How to Use This Indicator
This tool is designed to filter out noise and identify the exact moment a trend reverses.
1. Wait for the Setup: Do not trade every signal. This indicator is most powerful when price is approaching a key support/resistance level or a specific Time Pivot.
2. The Trigger: When the Fisher line crosses the Signal line (changing from Red to Green or vice versa), it confirms that momentum has mathematically shifted.
3. The Execution: Use this crossover as your entry signal *only* if it aligns with your broader market thesis.
Best Practice:
Use this in conjunction with a Time-Cycle indicator (such as the GPM Architecture).
Scenario: Price hits a Vertical Time Line.
Action: Wait for this Fisher indicator to print a "B" or "S".
Result: You enter exactly at the pivot, minimizing drawdown.
Disclaimer: This tool is for technical analysis purposes only. Past performance does not guarantee future results.

Morning ORB FVG Trigger✅ Overview
Morning ORB FVG Trigger is a complete intraday trading framework built around:
A Morning Opening Range Breakout (ORB)
The first Fair Value Gap (FVG) after that breakout
Strict risk management and position sizing
Optional HTF trend filter (Daily / Weekly / Monthly)
Optional Daily ATR filter to avoid extreme days
The script is designed for futures / indices / FX on intraday charts up to 15 minutes and for traders who want a clean, mechanical entry framework with clear risk.
🧠 Core idea
Define a morning opening range (e.g. 09:30–09:45).
Wait for a clean breakout above/below that range.
After the breakout, wait for the first FVG in breakout direction,
confirmed by the next candle (no immediate full reclaim).
Use a chosen stop logic + R:R factor to build risk/reward boxes.
Calculate position size based on your account risk.
(Optional) Only take trades:
In the direction of the HTF EMA trend (D/W/M).
On days where the morning range is within a band of the Daily ATR.
You can also disable all signals/boxes and use the script just as a visual ORB tool.
⏰ 1. ORB / Morning Range
Inputs (Main section)
Morning Range Session
Time window of the opening range in exchange time
Example: 09:30–09:45 for a 15-minute ORB.
You can type custom ranges (e.g. 09:30–09:35 for a 5-minute ORB).
Risk/Reward (TP factor)
Multiplier for the take-profit distance relative to the stop.
2.0 = TP is 2× the stop distance
1.5 = TP is 1.5× the stop distance
Show ORB range
If enabled, draws:
ORB high/low lines
ORB labels (e.g. 15min ORB high / low)
Optional midline
Extend ORB lines to the right (bars)
How many bars to extend the ORB high/low horizontally beyond the ORB itself.
Trade box width (bars)
Horizontal width (in bars) of:
Red risk box (entry–stop)
Green reward box (entry–TP)
Implementation details
The ORB is always calculated on 1-minute data internally, so it stays precise even on 5m/15m charts.
The script only works on intraday timeframes up to 15 minutes.
📦 2. FVG Block
Group: “FVG”
Threshold %
Minimum size of an FVG in % of price.
0 = every FVG
Higher values = only larger gaps
Auto threshold (from volatility)
If enabled, the minimum FVG size is derived from historical volatility
instead of a fixed percentage.
Allow breakout FVG partly inside ORB
Off (default): the FVG must lie fully outside the ORB.
On: the breakout FVG itself may still overlap the ORB a bit,
as long as it is the first one attached to the breakout move.
Enable FVG entry signals, boxes & alerts
On: full system – FVG detection, entry labels, risk/TP boxes, alerts.
Off: no entries, no risk/TP boxes, no alerts.
You only get the ORB and (optionally) the HTF dashboard, so you can trade your own setups.
Entry mode
Entry mode (Mid / Edge / NextOpen)
Mid – Entry at the midpoint of the FVG.
Edge – Long at the upper FVG edge, short at the lower FVG edge.
NextOpen – No limit order in the gap. Entry is placed at the next bar open after FVG confirmation.
Edge offset (ticks)
Additional offset for Edge entries:
Long:
+ticks = a bit above the FVG (more conservative)
-ticks = deeper into the FVG (more aggressive)
Short:
+ticks = a bit below the FVG
-ticks = deeper into the FVG
FVG detection logic
Uses a LuxAlgo-style 3-candle FVG pattern (gap between candle 1 and 3).
Only one FVG is taken: the first valid FVG after the ORB breakout in breakup direction.
The FVG candle is the middle bar; the script:
Detects the FVG on the previous bar.
Waits for the current bar to confirm it:
Bullish: current low must stay above the lower FVG boundary
Bearish: current high must stay below the upper FVG boundary
Only then an entry signal is generated.
🛑 3. Stop Logic
Group: “Stop Logic”
Stop mode (PrevBar / Pivot / FVG Candle)
PrevBar – Stop at the low/high of the candle before the FVG
(tight/aggressive).
FVG Candle – Stop at the low/high of the FVG candle itself
(medium).
Pivot – Stop at the most recent swing high/low
using pivotLeft / pivotRight pivots (more conservative).
Ticks (stop buffer)
Offset (in ticks) from the selected stop level.
> 0 = further away (more room, more risk)
< 0 = closer (tighter stop)
Pivot left / Pivot right
Number of candles left/right to define a swing high/low
when using Pivot stop mode.
Typical intraday values: 2–3.
The script also sanity-checks the stop:
if the calculated stop would be invalid (e.g. above entry in a long), it moves it by a minimal distance (2 ticks) to keep a valid risk.
📈 4. HTF Trend Filter (Daily / Weekly / Monthly)
Group: “HTF Trend Filter”
Enable HTF trend filter
If enabled, trades are only allowed:
Long when at least 2 of D/W/M closes are above their EMA
Short when at least 2 of D/W/M closes are below their EMA
EMA length (D/W/M)
EMA length for all three higher timeframes (Daily, Weekly, Monthly).
This helps focus entries in the direction of the dominant higher-timeframe trend.
📊 5. ATR Filter (Daily)
Group: “ATR Filter (Daily)”
Use daily ATR filter
If enabled, the height of the ORB (ORB high – ORB low) must be within
a band of the Daily ATR to allow any signals.
Daily ATR length
ATR period on the Daily timeframe.
Min ORB size vs ATR
Lower bound:
Example: 0.3 → ORB must be at least 0.3 × Daily ATR
0.0 = no minimum.
Max ORB size vs ATR
Upper bound:
Example: 1.5 → ORB must be ≤ 1.5 × Daily ATR
0.0 = no maximum.
If the ORB is too small (choppy) or too large (exhausted move), no breakout or FVG signal will be generated on that day.
🧭 6. HTF Dashboard & Signal Labels
Group: “HTF Trend Dashboard”
Show HTF dashboard
Draws a small label at the top of the chart showing:
HTF Trend (EMA X)
D: UP/FLAT/DOWN
W: UP/FLAT/DOWN
M: UP/FLAT/DOWN
Dashboard position
Top Right, Top Center, Top Left – places the dashboard at the top.
Over Risk Info – no top dashboard; instead, the HTF trend info is shown as a label near the risk box when a new signal appears.
Lookback (bars) for top anchor
How many bars to use to determine the top price level for dashboard placement.
Show HTF trend above risk box on signal
Only relevant if Dashboard position = Over Risk Info.
When enabled, a small HTF label appears near the risk box for each new trade.
Signal label vertical offset (ticks)
Vertical spacing between risk info label and HTF label.
Minimum spacing HTF/Risk (ticks)
Ensures a minimum vertical distance so the two labels don’t overlap.
HTF signal label X offset (bars)
Horizontal offset (left/right) relative to the risk info label.
⏳ 7. ORB–FVG Filters (Session & Time Window)
Group: “ORB FVG Filter”
Only same session day
If enabled, FVG entries are only allowed on the same calendar day
as the ORB. When the date changes, all state & drawings are reset.
Limit hours after ORB
Enables a time window after the ORB end.
Trading window after ORB (hours)
Length of that window in hours.
Example: 2.0 → FVG signals only in the first 2 hours after ORB end.
💰 8. Risk Management & Position Sizing
Group: “Risk Management”
Calculate position size
If enabled, the script computes suggested mini and micro contract size for you.
Account size
Your trading account size (in account currency).
Risk mode
Percent – risk is a % of account size (Account risk %).
Fixed amount – risk is a fixed dollar amount (Fixed risk ($)).
Account risk %
Risk per trade as a percentage of account size (e.g. 1.0 for 1%).
Fixed risk ($)
Fixed risk per trade in dollars when using Fixed amount mode.
Micro factor (vs mini)
How much a micro contract is worth relative to a mini.
Example:
0.1 → one micro moves 1/10 of one mini.
Risk Info label
For each new trade, a label is shown above the boxes with:
Stop distance in price and $ risk per mini
Max risk allowed for the trade
Suggested mini and micro size
Text like:
Suggested: 2 mini
Suggested: 5 micro
or Suggested: no trade
This makes the script especially useful for prop-firm rules or strict risk discipline.
🎨 9. Visual Style (Boxes, Labels, ORB Lines)
Group: “Box & Label Style (Trade)”
Label font size (Very small, Small, Normal, Large)
Entry label BG / text color
Stop label BG / text color
TP label BG / text color
Risk info BG / text color
Risk box color (entry–stop zone)
Reward box color (entry–TP zone)
Group: “ORB Style”
ORB high line color
ORB low line color
ORB line width
ORB label font size
ORB label background color
ORB label text color
Show ORB midline
ORB midline color / width / style (Solid / Dashed / Dotted)
⚠️ 10. Alerts
Group: “Alerts”
The script defines three alert conditions:
Long entry FVG breakout
Triggered when a new long signal appears.
Short entry FVG breakout
Triggered when a new short signal appears.
FVG entry (long/short)
Generic alert for any new signal (long or short).
To use them:
Add the indicator to the chart.
Open the Alerts dialog → “Condition”.
Select this script and one of the alert conditions.
Set your preferred expiration and notification settings.
Alerts only fire when Enable FVG entry signals, boxes & alerts is on.
🧩 11. How the trading logic flows (summary)
Build ORB on 1-minute data during the selected session.
Optionally reject the day if ORB is outside the ATR bounds.
Wait for a breakout (close above high or below low), respecting HTF trend filter.
After breakout, look for the first valid FVG in that direction:
Outside the ORB (unless breakout FVG allowed inside)
Confirmed by the next candle (no full reclaim)
Once confirmed:
Compute entry, stop, target.
Draw risk/reward boxes and all labels.
Optionally show HTF signal label over the risk info.
Trigger alerts if enabled.
If you disable FVG signals, only steps 1–3 (plus dashboard) are effectively active.
⚠️ 12. Notes & Disclaimer
Script is intended for intraday trading up to 15-minute timeframes.
All signals are mechanical and do not guarantee profitability.
Always backtest and forward-test on your own data before risking real money.
This script is for educational purposes only and is not financial advice.
🚀 Quick-start guide
Add the script to your chart
Use an intraday timeframe ≤ 15 minutes (1m, 3m, 5m, 15m).
Works best on liquid indices, futures, FX and large-cap stocks.
Set the Morning Range
In “Morning Range Session” choose the exchange’s opening window.
Examples
US index futures (CME): 08:30–08:45 or 08:30–08:35
US stocks (NYSE/Nasdaq): 09:30–09:45 or 09:30–09:35
The ORB is always calculated on 1-minute data internally, so the range stays accurate on higher intraday charts.
Keep the default filters at first
HTF Trend Filter: ON
EMA length = 20
This will only allow trades in the direction of the dominant D/W/M trend.
ATR Filter: OFF (optional; you can enable later once you’re comfortable).
Use the full trade system
In the FVG group leave
“Enable FVG entry signals, boxes & alerts” = ON
Entry mode: Mid
Stop mode: FVG Candle or PrevBar
Risk/Reward: 2.0 as a starting point.
Set your risk
Turn on “Calculate position size”.
Enter your Account size and choose either:
Risk mode = Percent (e.g. 1.0 = 1% per trade), or
Risk mode = Fixed amount (e.g. $250 per trade).
The risk info label will show:
Stop distance in price and $/contract
Max allowed risk
Suggested mini and micro contract size.
Enable alerts (optional)
Open the Alerts dialog → Condition: this script.
Choose one of:
Long entry FVG breakout
Short entry FVG breakout
FVG entry (long/short)
Choose “Once per bar” or “Once per bar close”, and your preferred notification type.
Replay & journal
Use the TradingView bar replay tool to step through past days.
Focus on:
How the ORB defines the structure.
How the first confirmed FVG outside the ORB behaves.
Whether the risk/TP levels fit your own style and product.
🎛 Recommended settings & profiles
These are starting points, not rules. Always adapt to the instrument and your own risk tolerance.
1. Conservative / Trend-following
Timeframe: 5m or 15m
Morning Range Session: 15-minute ORB around the cash or futures open
FVG
Threshold %: 0.05–0.1 (filter out very small gaps)
Auto threshold: OFF (keep it simple)
Allow breakout FVG partly inside ORB: OFF
Enable FVG entry signals/boxes/alerts: ON
Entry mode: Mid
Stop Logic
Stop mode: Pivot
Pivot left/right: 2–3
Stop buffer: +1–2 ticks
HTF Trend Filter
Enabled: ON
EMA length: 20
ATR Filter
Enabled: ON
Daily ATR length: 14
Min ORB vs ATR: 0.3–0.4
Max ORB vs ATR: 1.2–1.5
Risk Management
Risk mode: Percent
Account risk: 0.5–1.0%
Idea: Only trade when the higher-timeframe trend supports the move and the opening range is of a “normal” size for the current volatility.
2. Balanced / Intraday directional
Timeframe: 3m or 5m
FVG
Threshold %: 0.02–0.05
Auto threshold: ON (lets the script adapt to volatility)
Allow breakout FVG partly inside ORB: ON
(first breakout FVG may partly sit inside the ORB)
Entry mode: Edge
Edge offset (ticks): 0 or +1
Stop Logic
Stop mode: FVG Candle
Stop buffer: 0–1 ticks
HTF Trend Filter
Enabled: ON
ATR Filter
Enabled: OFF (optional)
Risk Management
Risk mode: Percent
Account risk: 1.0–1.5% (if this fits your plan)
Idea: Slightly more aggressive entries at the gap edge, still aligned with HTF trend, but with more flexibility on ATR.
3. Aggressive / Scalping around the ORB
Timeframe: 1m or 3m
FVG
Threshold %: 0.0–0.02
Auto threshold: ON
Allow breakout FVG partly inside ORB: ON
Entry mode: NextOpen or Edge with a negative offset (deeper into the gap)
Stop Logic
Stop mode: PrevBar
Stop buffer: 0 or -1 tick
HTF Trend Filter
Enabled: OFF (or ON but treat as soft guidance)
ATR Filter
Enabled: OFF
Risk Management
Risk mode: Percent
Account risk: lower, e.g. 0.25–0.5% per trade
Idea: More trades and tighter stops. Best for experienced traders who understand the limitations of scalping and whipsaw risk.
Final reminder
All of these are templates, not guarantees:
Always check how the system behaves on your market and session.
Start on replay and demo before trading real money.
Adjust filters (HTF, ATR, thresholds) until the signals fit your personal approach.

Filter EMA200 (HTF) + Trigger HMA (with HTF)Trend Filter: EMA200 calculated on the 5-minute timeframe, plotted on the current chart. It acts as the main directional filter.
Trigger: Hull Moving Average (HMA) with adjustable length and selectable source timeframe (default HMA24 on 1-minute). It provides faster entries and exits.
Trading logic is simple:
Only take long signals when price closes above both the filter EMA and the trigger HMA.
Only take short signals when price closes below both lines.
This combination helps reduce false breakouts while keeping entries fast and responsive.

Daily Buy/Sell Triggers + ATR TargetsThis tool gives you a once-per-day, objective ATR map: Buy Trigger above the open, Sell Trigger below the open, clean ATR targets, and FULL ATR extremes. It’s designed for clarity, precision, and zero intraday repainting so you can plan the session and execute with confidence.
This indicator prints a new, static grid of intraday levels every New York 18:00 (end of the NY trading day). The grid is anchored at the day’s open and spaced by the Daily ATR so you get tick-precise Buy Trigger, Sell Trigger, intermediate ATR targets, and the FULL ATR bounds for the session.
The levels act as objective support/resistance and intraday measuring sticks for continuation, mean-reversion, and range expansion trades.
What you see on the chart
A thin midline at the Daily Open (anchor).
Green lines above, red lines below, spaced at your chosen ATR multiples.
Text at the far right for:
Buy trigger
Sell trigger
FULL ATR (both sides)
Intermediate targets are unlabeled to keep the chart clean (they’re still tradable S/R).
Bullish Divergence SMI Base & Trigger with ATR FilterDescription:
A bullish divergence indicator combining the Stochastic Momentum Index (SMI) and Average True Range (ATR) to pinpoint high-probability entries:
1. Base Arrow (Orange ▲):
• Marks every SMI %K / %D bullish crossover where %K < –70 (deep oversold)—the first half of the divergence setup.
• Each new qualifying crossover replaces the previous base, continuously “arming” the divergence signal.
• Configurable SMI lookbacks, oversold threshold, and a base timeout (default 100 days) to clear stale bases.
2. Trigger Arrow (Green ▲):
• Completes the bullish divergence: fires on the next SMI bullish crossover where %K > –60 and price has dropped below the base arrow’s close by at least N × ATR (default 1 × 14-day ATR).
• A dashed green line links the base and trigger to visually confirm the divergence.
• Resets after triggering, ready for a new divergence cycle.
Inputs:
• SMI %K Length, EMA Smoothing, %D Length
• Oversold Base Level (–70), Trigger Level (–60)
• ATR Length (14), ATR Multiplier (1.0)
• Base Timeout (100 days)
Ideal for any market, this study highlights genuine bullish divergences—oversold momentum crossovers that coincide with significant price reactions—before entering long trades.

Scalping The BullNome: Scalping The Bull (Indicatore)
Categoria: Scalping, Trend Following, Mean Reversion.
Timeframe: 1M, 5M, 30M, 1D, secondo la conformazione specifica.
(follow description in english)
Analisi tecnica: l’indicatore supporta le operatività descritte nei video di YouTube del canale “Scalping The Bull”. Di norma si basa su price action e medie mobili esponenziali.
Le varie tecniche che possono essere usate insieme all’indicatore sono sintetizzate nei settaggi dell’indicatore e si può fare riferimento ai video specifici per la spiegazione completa.
Utilizzo consigliato: Altcoin che presentano forti trend per scalping e operazioni intra-day.
Configurazione: È possibile configurare lo strumento in maniera semplice e completa.
Medie:
Medie per mercato: e’ possibile utilizzare le medie mobili esponenziali (EMA) esclusivamente per il mercato Crypto (5/10/60/223).
Media addizionale: e’ possibile visualizzare una media aggiuntiva, e.g. a 20 periodi.
Elementi del grafico:
Sfondo: segnala con lo sfondo del grafico in verde una situazione di uptrend ( EMA 60 > EMA 223) e in rosso sfondo rosso una situazione di downtrend (EMA 60 < EMA 223).
Separatori di sessioni: indica l’inizio della sessione corrente.
Punti Trigger:
Massimi e minimi di oggi: disegna sul grafico il prezzo di apertura della candela daily e i massimi e i minimi di giornata.
Massimi minimi di ieri: disegna sul grafico il prezzo di apertura della candela daily, i massimi e i minimi del giorno prima.
(English description)
Name: Scalping The Bull (Indicator)
Category: Scalping, Trend Following, Mean Reversion.
Timeframe: 1M, 5M, 30M, 1D depending on the specific signal.
Technical Analysis: The indicator supports the operations described in the YouTube videos of the channel "Scalping The Bull". Usually it is based on price action and exponential moving averages.
The various techniques that can be used in conjunction with the indicator are summarized in the indicator settings and you can refer to the specific videos for the full explanation.
Suggested usage: Altcoin showing strong trends for scalping and intra-day trades.
Configuration:
Exponential Moving Averages
Per market: you can display averages exclusively for the Crypto market (5/10/60/223).
Additional Average: You can display an additional average, e.g. 20-period average.
Chart elements:
Session Separators: indicates the beginning of the current session.
Background: signals with the background in green an uptrend situation ( 60 > 223) and in red background a downtrend situation (60 < 223).
Trigger points:
Today's highs and lows: draw on the chart the opening price of the daily candle and the highs and lows of the day.
Yesterday's highs and lows: draw on the chart the opening price of the daily candle, the highs and lows of the previous day.

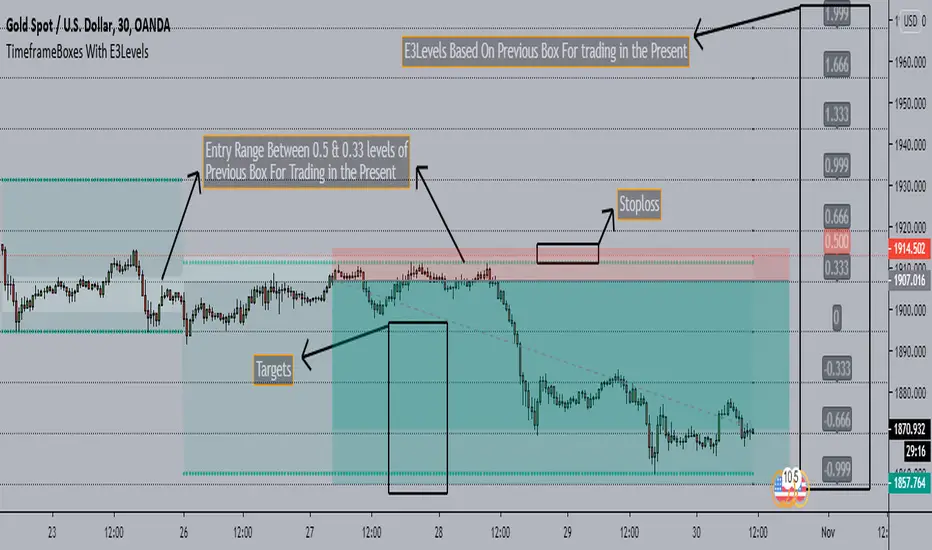
TimeframeBoxes(DailyBox) With E3Levels - SaeedKhakestar Method*** This is a Repaint Indicator that uses HIGH & LOW of Previous Range in the Custom Period(12H,1D,2D,3D & Weekly) for Trading In the Present with E3 Levels
TimeframeBoxes(DailyBox) With E3Levels - SaeedKhakestar Method
Version 1.00
Created by TWA_TradeWithAmir(TWA_PriceActionTips)
Updated 10/29/2020
Based On SaeedKhakestar Method(Trigger Price Action)
*With Entry Range
*With E3 Levels
*12H,1D,2D,3D & Weekly Boxes
*Entry Range & E3 Levels Belongs to Previous Box
*TRex Method
Adaptive Bandpass Trigger Oscillator Ver 2.0This is an improvement of the Adaptive Bandpass Trigger Oscillator. It normalizes the values to 0-100 to allow the addition of overbought and oversold levels. An aggressive trigger would be an inflection point of the trigger line while overbought/oversold and the phase line above/below the midline.
Feel free to message me if you would like development work or would just like to donate ; )
This is based off of Ehlers' Bandpass Filter system (link below slides 15-17). I then used Ehlers' methods for finding the dominant cycle to automatically input the dominant cycle to the length. Essentially Ehlers runs a band pass with a given period to detrend the price data and highlight a cycle with the given frequency(length). This represents the In phase cycle. Ehlers then creates the trigger line by taking the one bar momentum of the In Phase line, multiplying by 2Pi and then using this to create a 60 degree leading signal. The triggers are crossovers of the In Phase and Lead lines. You can also use conservative signals by waiting for the In Phase line to trend in the direction of the trigger crossover as well.
Delta represents how much to influence the oscillator by the price (Delta 0 is a perfect wave)
Alpha represents how quickly to adapt between the dominant cycle changes in the price.
Thanks to LazyBear for implementing Ehlers' original adaptive code, which I used for this system
Thanks to HPotter for the BandPass Filter code, which I used as a base for implementing the rest of the system
www.mesasoftware.com

Breakout Range LS alert 893 popup trigger ver For Japanese major donchain breakout bot's logic.
it's trigger are price range and highest/lowest price.
this script put on symbol/text in chart when price reach on trigger:)
recommend to use on 1h chart.
include alertcondition for TV alert.

Liquidity Entry Triggers (4-Model System) | WarRoomXYZLiquidity Entry Triggers is an open-source, price-action-based analytical framework designed to highlight recurring institutional liquidity behaviors that appear across all liquid markets.
The script focuses on how and where liquidity is taken, rather than attempting to predict direction using oscillators or lagging indicators.
It is optimized for XAUUSD, FX pairs, indices, and crypto , particularly on 1m–15m timeframes where session behavior and liquidity reactions are most visible.
This tool is not a buy/sell signal generator .
It provides contextual entry zones based on structural liquidity logic, allowing traders to apply their own execution rules.
Core Philosophy
Markets move because of:
•Trapped traders
•Forced liquidations
•Session-based liquidity cycles
•Reactions at prior institutional participation zones
This script visualizes four repeatable entry triggers that emerge from those mechanisms.
🔹 1. Failed Breakout / Trapped Trader Model
When price breaks a clearly defined range high or low, breakout traders often enter expecting continuation.
If price fails to hold outside the range and closes back inside, those traders become trapped.
The script detects:
•Breaks beyond recent highs/lows
•Immediate rejection back into the range
•Structural failure of momentum
These conditions frequently lead to mean reversion or reversal moves as trapped traders exit and fuel movement in the opposite direction.
Markers are plotted at the point of failure to highlight potential trap zones.
🔹 2. Liquidation Flush Detection
Sharp impulsive candles with abnormally large wicks often represent liquidation cascades rather than healthy trend continuation.
The script identifies liquidation behavior by measuring:
•Wick-to-body imbalance
•Sudden expansion followed by rejection
•Temporary price inefficiencies
These flushes commonly occur near:
•Session highs/lows
•Range extremes
•Trend exhaustion points
Such events often lead to rebalance moves , where price partially or fully fills the wick.
🔹 3. Orderblock Reaction Zones
Orderblocks represent areas where heavy participation occurred before a strong displacement move.
The script highlights:
•Clean bullish and bearish orderblock structures
•Zones formed during consolidation prior to expansion
•Areas likely to be defended when revisited
Orderblocks with minimal noise and clean departure are prioritized, as they often reflect institutional positioning rather than retail activity.
These zones are intended as reaction areas , not automatic entry signals.
🔹 4. London Session Liquidity Sweep Model
The London session frequently establishes the initial daily high or low.
Later in the session or during New York, price often:
•Sweeps internal liquidity around that level
•Rejects after the sweep
•Continues with the higher-timeframe bias
The script monitors London session behavior and marks:
•Liquidity runs above/below London highs and lows
•Rejections back inside the prior structure
This model is especially effective when combined with broader daily context.
🔹4. How the Components Work Together
The framework is designed as a context stack , not a checklist of signals:
Liquidity Event → Location → Timing → Trader Execution
Each model reinforces the others:
•Failed breakouts often occur after liquidity sweeps
•Liquidation wicks frequently form near orderblocks
•London sweeps often trigger failed momentum moves
•Confluence increases probability, not certainty
🔹 Practical Usage Guide
✔ Identify context
Determine whether price is approaching a range extreme, session level, or prior participation zone.
✔ Wait for a liquidity event
Look for a sweep, failed breakout, or liquidation wick.
✔ Observe reaction
Rejection, displacement, or reclaim behavior provides confirmation.
✔ Execute manually
Stops are commonly placed beyond the liquidity extreme.
Targets are typically internal liquidity, prior highs/lows, or imbalance zones.
The indicator does not manage trades or enforce rules.
Execution and risk management remain the trader’s responsibility.
🔹 5. Originality & Design Notes
This script does not replicate or bundle existing indicators.
It introduces:
•A multi-model liquidity entry framework
•Structural failed breakout detection
•Wick-based liquidation imbalance logic
•Session-aware liquidity sweep visualization
•A unified, minimal, non-lagging design
All concepts are based on observable market behavior and integrated into a single analytical tool.
🔹 6. Suitable Markets & Timeframes
Works best on:
•XAUUSD
•Major FX pairs
•Indices
•Liquid crypto markets
Recommended timeframes:
•1m
•5m
•15m
•30m
🔹7. Limitations & Notes
•This is an analytical framework , not a trading system
•All markings are confirmed at candle close (non-repainting)
•No open interest or order flow data is used
•Results depend on user interpretation and execution
•Best used alongside session bias and higher-timeframe structure
Disclaimer
This script is provided for educational and informational purposes only.
It does not constitute financial advice, investment advice, or a recommendation to buy or sell any instrument.
Trading involves risk, and losses can exceed initial deposits.
The author assumes no responsibility for trading decisions made using this tool.
Users are strongly encouraged to test this script in demo or simulation environments and to apply proper risk management, position sizing, and personal discretion at all times.
By using this script, you acknowledge and accept all associated risks.
