Power RSI Segment Runner [CHE] Power RSI Segment Runner — Tracks RSI momentum across higher timeframe segments to detect directional switches for trend confirmation.
Summary
This indicator calculates a running Relative Strength Index adapted to segments defined by changes in a higher timeframe, such as daily closes, providing a smoothed view of momentum within each period. It distinguishes between completed segments, which fix the final RSI value, and ongoing ones, which update in real time with an exponential moving average filter. Directional switches between bullish and bearish momentum trigger visual alerts, including overlay lines and emojis, while a compact table displays current trend strength as a progress bar. This segmented approach reduces noise from intra-period fluctuations, offering clearer signals for trend persistence compared to standard RSI on lower timeframes.
Motivation: Why this design?
Standard RSI often generates erratic signals in choppy markets due to constant recalculation over fixed lookback periods, leading to false reversals that mislead traders during range-bound or volatile phases. By resetting the RSI accumulation at higher timeframe boundaries, this indicator aligns momentum assessment with broader market cycles, capturing sustained directional bias more reliably. It addresses the gap between short-term noise and long-term trends, helping users filter entries without over-relying on absolute overbought or oversold thresholds.
What’s different vs. standard approaches?
- Baseline Reference: Diverges from the classic Wilder RSI, which uses a fixed-length exponential moving average of gains and losses across all bars.
- Architecture Differences:
- Segments momentum resets at higher timeframe changes, isolating calculations per period instead of continuous history.
- Employs persistent sums for ups and downs within segments, with on-the-fly RSI derivation and EMA smoothing.
- Integrates switch detection logic that clears prior visuals on reversal, preventing clutter from outdated alerts.
- Adds overlay projections like horizontal price lines and dynamic percent change trackers for immediate trade context.
- Practical Effect: Charts show discrete RSI endpoints for past segments alongside a curved running trace, making momentum evolution visually intuitive. Switches appear as clean, extendable overlays, reducing alert fatigue and highlighting only confirmed directional shifts, which aids in avoiding whipsaws during minor pullbacks.
How it works (technical)
The indicator begins by detecting changes in the specified higher timeframe, such as a new daily bar, to define segment boundaries. At each boundary, it finalizes the prior segment's RSI by summing positive and negative price changes over that period and derives the value from the ratio of those sums, then applies an exponential moving average for smoothing. Within the active segment, it accumulates ongoing ups and downs from price changes relative to the source, recalculating the running RSI similarly and smoothing it with the same EMA length.
Points for the running RSI are collected into an array starting from the segment's onset, forming a curved polyline once sufficient bars accumulate. Comparisons between the running RSI and the last completed segment's value determine the current direction as long, short, or neutral, with switches triggering deletions of old visuals and creation of new ones: a label at the RSI pane, a vertical dashed line across the RSI range, an emoji positioned via ATR offset on the price chart, a solid horizontal line at the switch price, a dashed line tracking current close, and a midpoint label for percent change from the switch.
Initialization occurs on the first bar by resetting accumulators, and visualization gates behind a minimum bar count since the segment start to avoid early instability. The trend strength table builds vertically with filled cells proportional to the rounded RSI value, colored by direction. All drawing objects update or extend on subsequent bars to reflect live progress.
Parameter Guide
EMA Length — Controls the smoothing applied to the running RSI; higher values increase lag but reduce noise. Default: 10. Trade-offs: Shorter settings heighten sensitivity for fast markets but risk more false switches; longer ones suit trending conditions for stability.
Source — Selects the price data for change calculations, typically close for standard momentum. Default: close. Trade-offs: Open or high/low may emphasize gaps, altering segment intensity.
Segment Timeframe — Defines the higher timeframe for segment resets, like daily for intraday charts. Default: D. Trade-offs: Shorter frames create more frequent but shorter segments; longer ones align with major cycles but delay resets.
Overbought Level — Sets the upper threshold for potential overbought conditions (currently unused in visuals). Default: 70. Trade-offs: Adjust for asset volatility; higher values delay bearish warnings.
Oversold Level — Sets the lower threshold for potential oversold conditions (currently unused in visuals). Default: 30. Trade-offs: Lower values permit deeper dips before signaling bullish potential.
Show Completed Label — Toggles labels at segment ends displaying final RSI. Default: true. Trade-offs: Enables historical review but can crowd charts on dense timeframes.
Plot Running Segment — Enables the curved polyline for live RSI trace. Default: true. Trade-offs: Visualizes intra-segment flow; disable for cleaner panes.
Running RSI as Label — Displays current running RSI as a forward-projected label on the last bar. Default: false. Trade-offs: Useful for quick reads; may overlap in tight scales.
Show Switch Label — Activates RSI pane labels on directional switches. Default: true. Trade-offs: Provides context; omit to minimize pane clutter.
Show Switch Line (RSI) — Draws vertical dashed lines across the RSI range at switches. Default: true. Trade-offs: Marks reversal bars clearly; extends both ways for reference.
Show Solid Overlay Line — Projects a horizontal line from switch price forward. Default: true. Trade-offs: Acts as dynamic support/resistance; wider lines enhance visibility.
Show Dashed Overlay Line — Tracks a dashed line from switch to current close. Default: true. Trade-offs: Shows price deviation; thinner for subtlety.
Show Percent Change Label — Midpoint label tracking percent move from switch. Default: true. Trade-offs: Quantifies progress; centers dynamically.
Show Trend Strength Table — Displays right-side table with direction header and RSI bar. Default: true. Trade-offs: Instant strength gauge; fixed position avoids overlap.
Activate Visualization After N Bars — Delays signals until this many bars into a segment. Default: 3. Trade-offs: Filters immature readings; higher values miss early momentum.
Segment End Label — Color for completed RSI labels. Default: 7E57C2. Trade-offs: Purple tones for finality.
Running RSI — Color for polyline and running elements. Default: yellow. Trade-offs: Bright for live tracking.
Long — Color for bullish switch visuals. Default: green. Trade-offs: Standard for uptrends.
Short — Color for bearish switch visuals. Default: red. Trade-offs: Standard for downtrends.
Solid Line Width — Thickness of horizontal overlay line. Default: 2. Trade-offs: Bolder for emphasis on key levels.
Dashed Line Width — Thickness of tracking and vertical lines. Default: 1. Trade-offs: Finer to avoid dominance.
Reading & Interpretation
Completed segment RSIs appear as static points or labels in purple, indicating the fixed momentum at period close—values drifting toward the upper half suggest building strength, while lower half implies weakness. The yellow curved polyline traces the live smoothed RSI within the current segment, rising for accumulating gains and falling for losses. Directional labels and lines in green or red flag switches: green for running momentum exceeding the prior segment's, signaling potential uptrend continuation; red for the opposite.
The right table's header colors green for long, red for short, or gray for neutral/wait, with filled purple bars scaling from bottom (low RSI) to top (high), topped by the numeric value. Overlay elements project from switch bars: the solid green/red line as a price anchor, dashed tracker showing pullback extent, and percent label quantifying deviation—positive for alignment with direction, negative for counter-moves. Emojis (up arrow for long, down for short) float above/below price via ATR spacing for quick chart scans.
Practical Workflows & Combinations
- Trend Following: Enter long on green switch confirmation after a higher high in structure; filter with table strength above midpoint for conviction. Pair with volume surge for added weight.
- Exits/Stops: Trail stops to the solid overlay line on pullbacks; exit if percent change reverses beyond 2 percent against direction. Use wait bars to confirm without chasing.
- Multi-Asset/Multi-TF: Defaults suit forex/stocks on 1H-4H with daily segments; for crypto, shorten EMA to 5 for volatility. Scale segment TF to weekly for daily charts across indices.
- Combinations: Overlay on EMA clouds for confluence—switch aligning with cloud break strengthens signal. Add volatility filters like ATR bands to debounce in low-volume regimes.
Behavior, Constraints & Performance
Signals confirm on bar close within segments, with running polyline updating live but gated by minimum bars to prevent flicker. Higher timeframe changes may introduce minor repaints on timeframe switches, mitigated by relying on confirmed HTF closes rather than intrabar peeks. Resource limits cap at 500 labels/lines and 50 polylines, pruning old objects on switches to stay efficient; no explicit loops, but array growth ties to segment length—suitable for up to 500-bar histories without lag.
Known limits include delayed visualization in short segments and insensitivity to overbought/oversold levels, as thresholds are inputted but not actively visualized. Gaps in source data reset accumulators prematurely, potentially skewing early RSI.
Sensible Defaults & Quick Tuning
Start with EMA length 10, daily segments, and 3-bar wait for balanced responsiveness on hourly charts. For excessive switches in ranging markets, increase wait bars to 5 or EMA to 14 to dampen noise. If signals lag in trends, drop EMA to 5 and use 1H segments. For stable assets like indices, widen to weekly segments; tune colors for dark/light themes without altering logic.
What this indicator is—and isn’t
This tool serves as a momentum visualization and switch detector layered over price action, aiding trend identification and confirmation in segmented contexts. It is not a standalone trading system, predictive model, or risk calculator—always integrate with broader analysis, position sizing, and stop-loss discipline. View it as an enhancement for discretionary setups, not automated alerts without validation.
Disclaimer
The content provided, including all code and materials, is strictly for educational and informational purposes only. It is not intended as, and should not be interpreted as, financial advice, a recommendation to buy or sell any financial instrument, or an offer of any financial product or service. All strategies, tools, and examples discussed are provided for illustrative purposes to demonstrate coding techniques and the functionality of Pine Script within a trading context.
Any results from strategies or tools provided are hypothetical, and past performance is not indicative of future results. Trading and investing involve high risk, including the potential loss of principal, and may not be suitable for all individuals. Before making any trading decisions, please consult with a qualified financial professional to understand the risks involved.
By using this script, you acknowledge and agree that any trading decisions are made solely at your discretion and risk.
Do not use this indicator on Heikin-Ashi, Renko, Kagi, Point-and-Figure, or Range charts, as these chart types can produce unrealistic results for signal markers and alerts.
Best regards and happy trading
Chervolino
Tìm kiếm tập lệnh với "trigger"

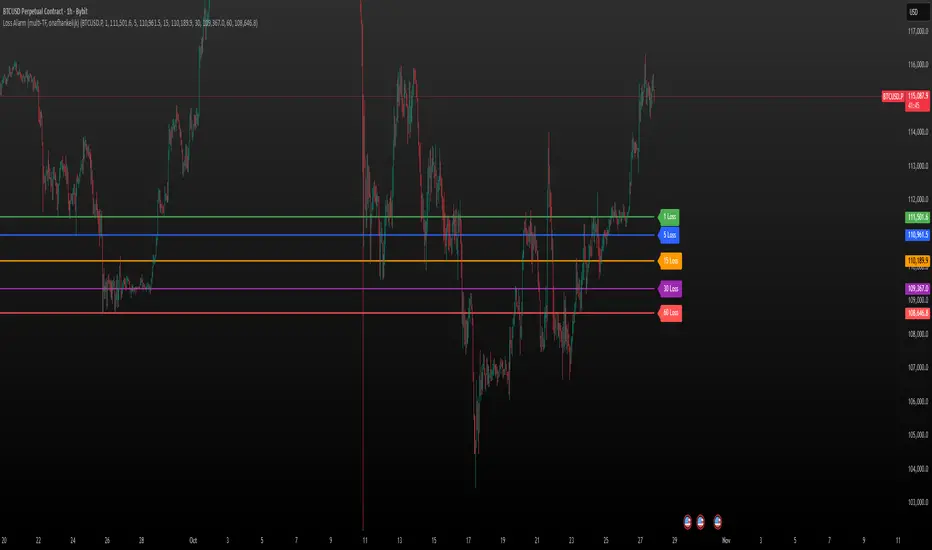
Loss Alarm (multi-TF)Loss Alarm (multi-TF)
This script triggers an alert once the price candel body stays fully under a chosen line for a predefined period of time.
Select your own ticker, timeframe, and price level.
The alert is triggered only once per session.
A line is plotted on the chart with a label showing the selected timeframe, so you know which alert is active.
⚠️ Note: you must manually create a separate TradingView alert using the condition provided by the script.
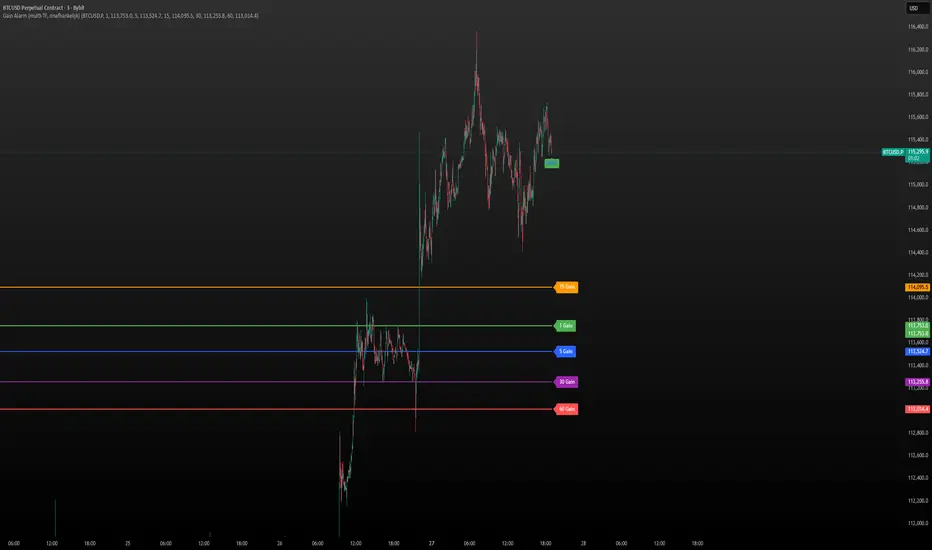
Gain Alarm (multi-TF )369
Gain Alarm (multi-TF)
This script triggers an alert once the price candel body stays fully above a chosen line for a predefined period of time.
Select your own ticker, timeframe, and price level.
The alert is triggered only once per session.
A line is plotted on the chart with a label showing the selected timeframe, so you know which alert is active.
⚠️ Note: you must manually create a separate TradingView alert using the condition provided by the script.
Luxy Adaptive MA Cloud - Trend Strength & Signal Tracker V2Luxy Adaptive MA Cloud - Professional Trend Strength & Signal Tracker
Next-generation moving average cloud indicator combining ultra-smooth gradient visualization with intelligent momentum detection. Built for traders who demand clarity, precision, and actionable insights.
═══════════════════════════════════════════════
WHAT MAKES THIS INDICATOR SPECIAL?
═══════════════════════════════════════════════
Unlike traditional MA indicators that show static lines, Luxy Adaptive MA Cloud creates a living, breathing visualization of market momentum. Here's what sets it apart:
Exponential Gradient Technology
This isn't just a simple fill between two lines. It's a professionally engineered gradient system with 26 precision layers using exponential density distribution. The result? An organic, cloud-like appearance where the center is dramatically darker (15% transparency - where crossovers and price action occur), while edges fade gracefully (75% transparency). Think of it as a visual "heat map" of trend strength.
Dynamic Momentum Intelligence
Most MA clouds only show structure (which MA is on top). This indicator shows momentum strength in real-time through four intelligent states:
- 🟢 Bright Green = Explosive bullish momentum (both MAs rising strongly)
- 🔵 Blue = Weakening bullish (structure intact, but momentum fading)
- 🟠 Orange = Caution zone (bearish structure forming, weak momentum)
- 🔴 Deep Red = Strong bearish momentum (both MAs falling)
The cloud literally tells you when trends are accelerating or losing steam.
Conditional Performance Architecture
Every calculation is optimized for speed. Disable a feature? It stops calculating entirely—not just hidden, but not computed . The 26-layer gradient only renders when enabled. Toggle signals off? Those crossover checks don't run. This makes it one of the most efficient cloud indicators available, even with its advanced visual system.
Zero Repaint Guarantee
All signals and momentum states are based on confirmed bar data only . What you see in historical data is exactly what you would have seen trading live. No lookahead bias. No repainting tricks. No signals that "magically" appear perfect in hindsight. If a signal shows in history, it would have triggered in real-time at that exact moment.
Educational by Design
Every single input includes comprehensive tooltips with:
- Clear explanations of what each parameter does
- Practical examples of when to use different settings
- Recommended configurations for scalping, day trading, and swing trading
- Real-world trading impact ("This affects entry timing" vs "This is visual only")
You're not just getting an indicator—you're learning how to use it effectively .
═══════════════════════════════════════════════
THE GRADIENT CLOUD - TECHNICAL DETAILS
═══════════════════════════════════════════════
Architecture:
26 precision layers for silk-smooth transitions
Exponential density curve - layers packed tightly near center (where crossovers happen), spread wider at edges
75%-15% transparency range - center is highly opaque (15%), edges fade gracefully (75%)
V-Gradient design - emphasizes the action zone between Fast and Medium MAs
The Four Momentum States:
🟢 GREEN - Strong Bullish
Fast MA above Medium MA
Both MAs rising with momentum > 0.02%
Action: Enter/hold LONG positions, strong uptrend confirmed
🔵 BLUE - Weak Bullish
Fast MA above Medium MA
Weak or flat momentum
Action: Caution - bullish structure but losing strength, consider trailing stops
🟠 ORANGE - Weak Bearish
Medium MA above Fast MA
Weak or flat momentum
Action: Warning - bearish structure developing, consider exits
🔴 RED - Strong Bearish
Medium MA above Fast MA
Both MAs falling with momentum < -0.02%
Action: Enter/hold SHORT positions, strong downtrend confirmed
Smooth Transitions: The momentum score is smoothed using an 8-bar EMA to eliminate noise and prevent whipsaws. You see the true trend , not every minor fluctuation.
═══════════════════════════════════════════════
FLEXIBLE MOVING AVERAGE SYSTEM
═══════════════════════════════════════════════
Three Customizable MAs:
Fast MA (default: EMA 10) - Reacts quickly to price changes, defines short-term momentum
Medium MA (default: EMA 20) - Balances responsiveness with stability, core trend reference
Slow MA (default: SMA 200, optional) - Long-term trend filter, major support/resistance
Six MA Types Available:
EMA - Exponential; faster response, ideal for momentum and day trading
SMA - Simple; smooth and stable, best for swing trading and trend following
WMA - Weighted; middle ground between EMA and SMA
VWMA - Volume-weighted; reflects market participation, useful for liquid markets
RMA - Wilder's smoothing; used in RSI/ADX, excellent for trend filters
HMA - Hull; extremely responsive with minimal lag, aggressive option
Recommended Settings by Trading Style:
Scalping (1m-5m):
Fast: EMA(5-8)
Medium: EMA(10-15)
Slow: Not needed or EMA(50)
Day Trading (5m-1h):
Fast: EMA(10-12)
Medium: EMA(20-21)
Slow: SMA(200) for bias
Swing Trading (4h-1D):
Fast: EMA(10-20)
Medium: EMA(34-50)
Slow: SMA(200)
Pro Tip: Start with Fast < Medium < Slow lengths. The gradient works best when there's clear separation between Fast and Medium MAs.
═══════════════════════════════════════════════
CROSSOVER SIGNALS - CLEAN & RELIABLE
═══════════════════════════════════════════════
Golden Cross ⬆ LONG Signal
Fast MA crosses above Medium MA
Classic bullish reversal or trend continuation signal
Most reliable when accompanied by GREEN cloud (strong momentum)
Death Cross ⬇ SHORT Signal
Fast MA crosses below Medium MA
Classic bearish reversal or trend continuation signal
Most reliable when accompanied by RED cloud (strong momentum)
Signal Intelligence:
Anti-spam filter - Minimum 5 bars between signals prevents noise
Clean labels - Placed precisely at crossover points
Alert-ready - Built-in ALERTS for automated trading systems
No repainting - Signals based on confirmed bars only
Signal Quality Assessment:
High-Quality Entry:
Golden Cross + GREEN cloud + Price above both MAs
= Strong bullish setup ✓
Low-Quality Entry (skip or wait):
Golden Cross + ORANGE cloud + Choppy price action
= Weak bullish setup, likely whipsaw ✗
═══════════════════════════════════════════════
REAL-TIME INFO PANEL
═══════════════════════════════════════════════
An at-a-glance dashboard showing:
Trend Strength Indicator:
Visual display of current momentum state
Color-coded header matching cloud color
Instant recognition of market bias
MA Distance Table:
Shows percentage distance of price from each enabled MA:
Green rows : Price ABOVE MA (bullish)
Red rows : Price BELOW MA (bearish)
Gray rows : Price AT MA (rare, decision point)
Distance Interpretation:
+2% to +5%: Healthy uptrend
+5% to +10%: Getting extended, caution
+10%+: Overextended, expect pullback
-2% to -5%: Testing support
-5% to -10%: Oversold zone
-10%+: Deep correction or downtrend
Customization:
4 corner positions
5 font sizes (Tiny to Huge)
Toggle visibility on/off
═══════════════════════════════════════════════
HOW TO USE - PRACTICAL TRADING GUIDE
═══════════════════════════════════════════════
STRATEGY 1: Trend Following
Identify trend : Wait for GREEN (bullish) or RED (bearish) cloud
Enter on signal : Golden Cross in GREEN cloud = LONG, Death Cross in RED cloud = SHORT
Hold position : While cloud maintains color
Exit signals :
• Cloud turns ORANGE/BLUE = momentum weakening, tighten stops
• Opposite crossover = close position
• Cloud turns opposite color = full reversal
STRATEGY 2: Pullback Entries
Confirm trend : GREEN cloud established (bullish bias)
Wait for pullback : Price touches or crosses below Fast MA
Enter when : Price rebounds back above Fast MA with cloud still GREEN
Stop loss : Below Medium MA or recent swing low
Target : Previous high or when cloud weakens
STRATEGY 3: Momentum Confirmation
Your setup triggers : (e.g., chart pattern, support/resistance)
Check cloud color :
• GREEN = proceed with LONG
• RED = proceed with SHORT
• BLUE/ORANGE = skip or reduce size
Use gradient as confluence : Not as primary signal, but as momentum filter
Risk Management Tips:
Never enter against the cloud color (don't LONG in RED cloud)
Reduce position size during BLUE/ORANGE (transition periods)
Place stops beyond Medium MA for swing trades
Use Slow MA (200) as final trend filter - don't SHORT above it in uptrends
═══════════════════════════════════════════════
PERFORMANCE & OPTIMIZATION
═══════════════════════════════════════════════
Tested On:
Crypto: BTC, ETH, major altcoins
Stocks: SPY, AAPL, TSLA, QQQ
Forex: EUR/USD, GBP/USD, USD/JPY
Indices: S&P 500, NASDAQ, DJI
═══════════════════════════════════════════════
TRANSPARENCY & RELIABILITY
═══════════════════════════════════════════════
Educational Focus:
Detailed tooltips on every input
Clear documentation of methodology
Practical examples in descriptions
Teaches you why , not just what
Open Logic:
Momentum calculation: (Fast slope + Medium slope) / 2
Smoothing: 8-bar EMA to reduce noise
Thresholds: ±0.02% for strong momentum classification
Everything is transparent and explainable
═══════════════════════════════════════════════
COMPLETE FEATURE LIST
═══════════════════════════════════════════════
Visual Components:
26-layer exponential gradient cloud
3 customizable moving average lines
Golden Cross / Death Cross labels
Real-time info panel with trend strength
MA distance table
Calculation Features:
6 MA types (EMA, SMA, WMA, VWMA, RMA, HMA)
Momentum-based cloud coloring
Smoothed trend strength scoring
Conditional performance optimization
Customization Options:
All MA lengths adjustable
All colors customizable (when gradient disabled)
Panel position (4 corners)
Font sizes (5 options)
Toggle any feature on/off
Signal Features:
Anti-spam filter (configurable gap)
Clean, non-overlapping labels
Built-in alert conditions
No repainting guarantee
═══════════════════════════════════════════════
IMPORTANT DISCLAIMERS
═══════════════════════════════════════════════
This indicator is for educational and informational purposes only
Not financial advice - always do your own research
Past performance does not guarantee future results
Use proper risk management - never risk more than you can afford to lose
Test on paper/demo accounts before using with real money
Combine with other analysis methods - no single indicator is perfect
Works best in trending markets; less effective in choppy/sideways conditions
Signals may perform differently in different timeframes and market conditions
The indicator uses historical data for MA calculations - allow sufficient lookback period
═══════════════════════════════════════════════
CREDITS & TECHNICAL INFO
═══════════════════════════════════════════════
Version: 2.0
Release: October 2025
Special Thanks:
TradingView community for feedback and testing
Pine Script documentation for technical reference
═══════════════════════════════════════════════
SUPPORT & UPDATES
═══════════════════════════════════════════════
Found a bug? Comment below with:
Ticker symbol
Timeframe
Screenshot if possible
Steps to reproduce
Feature requests? I'm always looking to improve! Share your ideas in the comments.
Questions? Check the tooltips first (hover over any input) - most answers are there. If still stuck, ask in comments.
═══════════════════════════════════════════════
Happy Trading!
Remember: The best indicator is the one you understand and use consistently. Take time to learn how the cloud behaves in different market conditions. Practice on paper before going live. Trade smart, manage risk, and may the trends be with you! 🚀

Liquidations Aggregated (Lite)Liquidations Aggregated (Lite)
The Liquidations Aggregated (Lite) script provides a unified cross-exchange visualization of short and long liquidation volumes, allowing traders to identify high-impact market events and sentiment reversals driven by forced position closures. It aggregates normalized liquidation data from Binance, Bybit, and OKX into a single coherent output, offering a consolidated perspective of derivative market stress across major venues.
Core Concept
Liquidations are involuntary closures of leveraged positions when margin requirements are breached. They represent points of structural orderflow imbalance, often triggering localized volatility spikes and price pivots. This indicator isolates and aggregates those liquidation volumes by direction (short vs. long), allowing traders to map where leveraged traders are being forced out and whether current market movement is driven by short covering or long capitulation.
Underlying Methodology
Each connected exchange provides liquidation feeds via standardized symbols (e.g., BTCUSDT.P_LQBUY or BTCUSD.P_LQSELL).
The script differentiates between:
Short Liquidations → Buy Volume: Forced covering of shorts, representing upward pressure.
Long Liquidations → Sell Volume: Forced selling of longs, representing downward pressure.
Bybit’s inverse data is normalized to align directional logic with Binance and OKX. Data is drawn through the request.security() function per symbol and per exchange, with per-exchange scaling adjustments applied to compensate for differences in reported nominal sizes (USD vs. coin-margined). The script is meant to match the calculation methods of professional-grade data sources (e.g., Velodata, Coinalyze). The value is denominated in the base currency at all times.
Computation Logic
Liquidation volumes are fetched separately for USD- and USDT-margined pairs on each exchange.
Exchange-specific magnitude adjustments are applied to account for nominal denomination differences.
Normalized liquidation buy and sell volumes are summed into two global aggregates:
combinedBuyVolumeLiquidationsShort → aggregated buy volume from forced short positions closes (Short Liquidations)
combinedSellVolumeLiquidationsLong → aggregated sell pressure from forced long position closes (Long Liquidations)
Final series are plotted as mirrored column charts around a zero baseline for direct comparison.
How to Use
Apply the script to any crypto perpetual futures symbol (e.g., BTCUSDT, ETHUSDT).
Observe teal bars (Buy Volume from Short Liquidations) for short squeezes and red bars (Sell Volume from Long Liquidations) for long wipes.
Strong teal spikes during downtrends often indicate aggressive short liquidations leading to short-term bounces.
Strong red spikes during uptrends often mark long unwinds that can trigger sharp retracements.
Sustained asymmetry in either direction suggests systemic imbalance across leveraged positioning.

TwinPulse Q Lead SPY x QQQ Intermarket Pulse 1HTwinPulse Q Lead is a concise one hour indicator for SPY and QQQ that converts three sources of market information into a single pulse line, a mode readout with BUY SELL WAIT, and compact alerts. It blends intermarket leadership between QQQ and SPY, intraday flow from the slope of session VWAP, and where the current price sits inside the regular trading hours range. The three components are normalized, fused, compressed to a stable range, and smoothed for clear thresholds. The aim is a readable intraday regime signal that helps you decide when to participate and when to stand aside.
The script is built with Pine v6, uses request security with lookahead off, and does not repaint. It is an indicator, not a strategy. It does not contain any solicitation, links, or outside references. The description is self contained and explains both logic and use so that any trader can understand the design without reading code.
What makes this original and useful
Intermarket leadership is measured directly from QQQ and SPY on your working timeframe using a Z score of the return spread. When growth is leading value heavy large caps, leadership turns positive. When it lags, leadership turns negative. This gives a real time read of the Nasdaq versus S and P tug of war that most day traders watch informally.
Intraday flow is taken from the slope of the session VWAP. A linear regression of VWAP over a short window captures whether value is rising or falling inside the day. Dividing by ATR normalizes slope by typical movement so that the signal is comparable across weeks.
Session position places price inside the current regular hours high to low. It answers whether the day is trading in the top half, the bottom half, or the middle. This is a simple but powerful context filter for breakouts and fades.
The three components are fused into one pulse, compressed with either hyperbolic tangent or softsign to keep values bounded, and then smoothed by a short EMA. This yields a stable range with a zero line so the eye can read shifts quickly.
The panel shows a human readable mode with reasons and a strength score. Traders who do not want to read lines can rely on a simple state and a compact justification that explains why the state is set.
This is not a mashup that simply overlays unrelated indicators. Each component was chosen to answer a distinct question that is common to SPY and QQQ intraday decision making. Leadership answers who is in charge, flow answers whether value inside the session is building or leaking, and position answers if price is pressing the extremes or circling the middle. The pulse ties the three together and prevents any single component from dominating.
How the calculations work
Leadership. Compute a short rate of change for SPY and QQQ. Subtract SPY from QQQ to get spread returns, then compute a rolling Z score over a longer window. Positive values mean QQQ is leading. Negative values mean SPY is leading.
Flow. Compute session VWAP on the active symbol. Regress VWAP over a short window to obtain a slope estimate. Divide by ATR to scale slope by current volatility so that a small rise on a quiet day is not treated the same as a small rise on a wild day.
Position. Track the highest high and lowest low since the start of regular hours. Place the current close inside that range on a zero to one scale, then recenter to a minus one to plus one scale. Positive means the top half of the day, negative means the bottom half.
Fusion. Multiply each component by a weight so users can emphasize or de emphasize leadership, flow, or position. Sum to a raw pulse.
Compression. Pass the raw pulse through a bounded function. Hyperbolic tangent is smooth and has natural saturation near the extremes. Softsign is faster and behaves like a smoother version of sign near zero. Compression avoids unbounded excursions and makes thresholds meaningful across days.
Smoothing. Apply a short EMA to the compressed pulse to reduce noise. This creates the main line called TwinPulse in the plot.
Thresholds. You can use static symmetric levels or adaptive levels. The adaptive option computes a mean and a standard deviation of the smoothed pulse over a user window, then sets upper and lower thresholds as mean plus or minus sigma times standard deviation. This allows thresholds to adjust across regimes. Static levels are still available for traders who want repeatable levels.
Events and mode. A long event fires when the smoothed pulse crosses the upper threshold with positive flow and any optional filters agree. A short event fires on the symmetric condition. The mode reads the current state rather than fire and forget. It returns BUY when the smoothed pulse is above the upper threshold with positive flow, SELL when the smoothed pulse is below the lower threshold with negative flow, otherwise WAIT. A cooldown controls how often events can fire so alerts do not spam during choppy periods.
Inputs and default values
The script ships with defaults chosen for SPY and QQQ on one hour charts.
Symbols. SPY and QQQ by default. You can switch to any pair. Many users may test IWM versus SPY for small cap reads.
Regular hours selector. On by default. This restricts the position factor to New York regular hours. Turn it off if you prefer full session behavior.
ROC length is three bars. Z score length is fifty bars. VWAP slope window is ten bars. ATR length is fourteen bars. Pulse smoothing length is three bars.
Compression mode. Choose hyperbolic tangent or softsign. Hyperbolic tangent is default.
Weights. Leadership and flow are one by default. Position is set to zero point seven to give a modest influence to where price sits inside the day.
Thresholds. Adaptive thresholds are on by default with a lookback of one hundred bars and a sigma width of zero point eight. Static levels at plus or minus zero point six are ready if you disable adaptive mode.
Filters. ADX filter is off by default. If you enable it, the script requires ADX above a user minimum before it will signal. Higher time frame confirmation is off by default. When enabled it compares the smoothed pulse on the confirm timeframe to zero and requires alignment for longs or shorts.
Cooldown. Three bars by default so that alerts do not trigger too frequently.
UI. Bar coloring is on by default. The panel is on by default and sits at the top right.
All request security calls use lookahead off and will not request future data. All persistent state variables are assigned in a way that prevents repainting. The indicator does not use non standard chart types in its logic.
How to use the indicator
Load a one hour chart of SPY or QQQ. Keep a clean chart so that the script output is easy to read.
Turn on regular hours if you want the session position to reflect the cash session. This is recommended for SPY and QQQ.
Watch the panel. Mode reads BUY or SELL or WAIT. The strength value is a simple vote based score that ranges from zero to one hundred. It counts leadership, flow, ADX if enabled, and higher time frame confirmation if enabled. You can use strength to filter weak states.
Consider action only when mode is BUY or SELL and the signal has not just fired on the last bar. The triangles mark where an event fired. Alerts use the same logic as the events. WAIT means stand aside.
To slow the system, enable ADX and set a higher minimum or enable higher time frame confirmation. To speed it up, disable the filters, disable adaptive thresholds, or tighten the sigma width.
When publishing, use a clean chart with only this indicator. Show the symbol and timeframe clearly and make sure the plot legend is visible. If you add drawings on the chart, only include ones that help readers understand the output.
Publication notes and compliance
This description is written in English. The title uses ASCII and only uses capital letters for common abbreviations. The script is original and explains how and why the components work together. There are no links or promotional material. The script does not claim performance. It does not use lookahead. The panel and alerts exist to help a human read and act with discipline. The indicator can be published as open source or as protected. If you choose protected, the description still allows readers to understand how the logic works without access to the code.
If you later convert the logic into a strategy for publication, use realistic commission and slippage, risk no more than a small share of equity per trade, and choose a dataset that yields a large enough sample. Explain any deviations from these default recommendations in your strategy description. Do not publish results from non standard chart types since they can mislead readers on signal timing.
Limitations and risks
Intermarket leadership is a relative measure. There are hours when both SPY and QQQ fall while leadership remains positive. Treat leadership as a context, not a stand alone trigger.
VWAP slope is a path measure inside the session. It can flip several times on a choppy day. That is why the script uses a short smoothing and an optional cooldown. Use ADX or higher time frame confirmation to avoid the worst chop.
Session position assumes a meaningful regular hours range. On half days or around openings with gaps the position factor can be less informative. If this bothers you, reduce the weight of position or turn it off.
Compression and smoothing introduce lag by design. The goal is stability and clarity. If you want earlier but noisier signals, reduce smoothing and weights, and use static thresholds.
No indicator guarantees future results. TwinPulse Q Lead is a decision aid. It should be combined with your risk rules, position size policy, and a clear exit plan. Past behavior is not a promise for the future.
Frequently asked questions
What symbols are supported. Any symbol can be used as the chart symbol. Leadership uses the two user symbols which default to SPY and QQQ. Many traders may try IWM versus SPY or DIA versus SPY.
Can I change the timeframe. Yes, but the design target is one hour. On very short timeframes the VWAP slope becomes very sensitive and you should consider stronger filters.
Does the script repaint. No. It uses request security with lookahead off and the panel updates on the last bar only. Events are based on bar close conditions unless you attach alerts on any alert function call which will still respect the logic without looking into the future.
How are the strength numbers built. The strength score is the share of aligned votes across leadership, flow, ADX if enabled, and higher time frame confirmation if enabled. A value near one hundred means many filters agree. A value near fifty means partial alignment. It is not a probability or an accuracy number.
Can I use non standard chart types. You can view the indicator on them but do not publish signals from non standard chart types because that can mislead readers about timing. Use classic candles or bars when you publish and when you test.
Why do I sometimes see BUY but the price is not moving. A BUY mode requires pulse above the upper threshold and positive flow. It does not require higher highs immediately. Treat BUY as a permission to look for entries using your own execution rules.

Volume-Confirmed Reversal Engine [AlgoPoint]Volume-Confirmed Reversal Engine v2.0
Overview
A price pattern alone is not enough to signal a high-probability reversal. True market turning points—moments of capitulation or euphoria—are almost always confirmed by a significant spike in volume.
The Volume-Confirmed Reversal Engine is designed to identify these exact moments. It filters out low-conviction price movements and focuses only on reversal patterns that are backed by meaningful volume activity.
How It Works
The indicator's logic is based on a sequential confirmation process:
- High-Volume Anchor Candle: The engine first scans for an "Anchor Candle"—a candle that makes a new high or low over a user-defined look_back period. Critically, this candle's volume must also be significantly higher than the recent average. Low-volume breakouts are ignored.
- Setup Activation & Visualization: When a valid Anchor Candle is detected, the indicator enters a "setup" phase. It visually marks this on your chart by drawing a Setup Box around the high and low of the Anchor Candle, extending it forward for the duration of the confirm_in window.
- Confirmation & Signal: A final signal is only triggered if the price breaks out of the opposite side of the Setup Box within the confirmation window. This action, combined with the initial volume spike, confirms the reversal.
- Setup Box Visualization: See exactly which candle the indicator is watching and the key price levels (the box boundaries) that need to be broken for a signal.
Signal Strength Score (1-4): Every signal now comes with a score, providing insight into its quality based on four factors:
- The base price pattern is met.
- The initial Anchor Candle had high volume.
- The final Confirmation Candle also had high volume.
- The signal is aligned with the long-term macro trend (e.g., a BUY signal above the 200 EMA).
Status Dashboard: A simple panel on your chart tells you what the indicator is doing in real-time ("Scanning for Setups," "Watching Bullish Setup," etc.) and displays a countdown for how many bars are left for a confirmation.
How to Interpret & Use
- The Box: When a colored box appears, it's an early warning that a reversal setup is active. Watch the boundaries of the box for a potential breakout.
- The Score: Use the score to gauge the quality of a signal. A 3/4 or 4/4 score represents a very high-conviction setup where multiple technical factors are aligned.
- The Dashboard: Use the panel to understand the indicator's current state and the time-sensitivity of an active setup.
- The BUY/SELL Labels: These are the final, actionable triggers, appearing only after the full price and volume confirmation process is complete.

DTM 444 BANDS 🚀DTM 444 BANDS 🚀:
The DTM 444 BANDS 🚀 is a powerful, multi-purpose trading indicator combining Supertrend, Dynamic Band Levels, Breakout Signals, and Volume Confirmation to help traders identify high-probability trade setups across different timeframes.
🔧 Key Features
✅ Multi-Timeframe Support
Analyze price action across any timeframe using the Timeframe input.
All band calculations (High, Low, Midline, and Supertrend) are pulled from a higher timeframe for clearer context.
✅ Dynamic Bands Based on Supertrend
High Band: Rolling highest of Supertrend over hiLen period.
Low Band: Rolling lowest of Supertrend over loLen period.
Midline: Midpoint of the above.
Acts like dynamic support/resistance, ideal for trend-following and breakout strategies.
✅ Dual Signal System
Breakout Signals (Buy and Sell): Triggered when price breaks the bands with volume confirmation.
Supertrend Crossover Signals (Buy1 and Sell1): Classic momentum entries with a confirmation twist.
Exit Signals: Optional take-profit/neutral indicators when price reverses.
✅ Volume Confirmation Filter (Optional)
Only triggers signals if the volume exceeds its 20-period SMA.
Helps filter out false breakouts and weak trends in low-liquidity periods.
✅ Visual Enhancements
Color-coded candles based on band positioning (e.g., red = weak, green = strong, etc.)
On-chart labels for each signal for quick reference.
Real-time Signal Dashboard using Pine Script tables showing:
Current signal
Volume filter status
Live volume vs volume SMA
🧪 Practical Use Cases
Trend Traders: Use the Supertrend cross and band breakouts to ride trends early.
Breakout Traders: Catch high-probability moves outside established ranges.
Swing Traders: Time entries and exits using color-coded bars and exit labels.
Volume-Sensitive Traders: Focus on trades with strong volume backing.
📊 Backtest Snapshot
Based on the example chart for Reliance Industries (RELIANCE.NS) on the weekly timeframe:
Several profitable buy and breakout signals during uptrends.
Timely exits and breakdown alerts before reversals.
Volume filter keeps trades clean and avoids noise.
⚙️ Customizable Parameters
High Length and Low Length (default: 19)
Supertrend Multiplier and ATR Length
Volume Filter: Toggle ON/OFF
Volume SMA Length: Default 20
Custom Timeframe: Choose any higher timeframe for multi-timeframe analysis
📢 Alerts Ready
Fully integrated with TradingView alerts:
Breakout & Breakdown
Supertrend crossovers
All alerts respect the volume filter setting
🏁 Final Thoughts
DTM 444 BANDS 🚀 is a versatile and adaptive trading system that blends trend analysis, volatility bands, and volume validation. Whether you're a trend trader, breakout hunter, or swing trader — this tool gives you a structured edge with clear visual cues and real-time alerts.

RSI MA Cross + Divergence Signal (V2) Core Logic
RSI + Moving Average
The script calculates a standard RSI (default 14).
It then overlays a moving average (SMA/EMA/WMA, default 9).
When RSI crosses above its MA → bullish momentum.
When RSI crosses below its MA → bearish momentum.
Divergence Filter
Signals are only valid if there’s confirmed divergence:
Bullish divergence: Price makes a lower low, RSI makes a higher low.
Bearish divergence: Price makes a higher high, RSI makes a lower high.
Overbought / Oversold Filter
Optional extra:
Bullish signals only valid if RSI ≤ 30 (oversold).
Bearish signals only valid if RSI ≥ 70 (overbought).
This ensures signals happen in “stretched” conditions.
Risk & Trade Management
Entries taken only when all conditions align.
Exits can be managed with ATR stops, partial take-profits, breakeven moves, and trailing stops (we coded these in the strategy version).
Cooldown, session filters, and daily loss guard to keep risk tight.
🔹 Strengths
✅ High selectivity: Combining RSI cross + divergence + OB/OS means signals are rare but higher quality.
✅ Great at catching reversals: Divergence highlights where price may be running out of steam.
✅ Risk management baked in: ATR stops + partial exits smooth out equity curve.
✅ Works across markets: ES, FX, crypto — anywhere RSI divergences are respected.
✅ Flexible: You can loosen/tighten filters depending on aggressiveness.
🔹 Weaknesses
❌ Lag from pivots: Divergence only confirms after a few bars → you enter late sometimes.
❌ Choppy in ranges: In sideways markets, RSI divergences appear often and whipsaw.
❌ Filters reduce signals: With all filters ON (divergence + OB/OS + trend + session), signals can be very rare — may under-trade.
❌ Not standalone: Needs higher-timeframe context (trend, liquidity pools) to avoid counter-trend entries.
🔹 Best Ways to Trade It
Use Higher Timeframe Bias
Run the strategy on 15m/1H, but only trade in direction of higher timeframe trend (e.g., 4H EMA).
Example: If daily is bullish → only take bullish divergences.
Pair With Structure
Look for signals at key zones: HTF support/resistance, VWAP, or FVGs.
Divergence + RSI cross inside an FVG is a strong entry trigger.
Adjust OB/OS for Volatility
For crypto/FX: use 35/65 instead of 30/70 (markets trend harder).
For ES/S&P: 30/70 works fine.
Risk Management Is King
Use partial exits: take profit at 1R, trail rest.
Size by % of equity (we coded this into the strategy).
Avoid News Spikes
Divergences break down around CPI, NFP, Fed announcements — stay flat.
🔹 When It Shines
Trending markets that make extended pushes → clean divergences.
Reversal zones (oversold → bullish bounce, overbought → bearish fade).
Swing trading (15m–4H) — less noise than 1m/5m scalping.
🔹 When to Avoid
Low volatility chop → lots of false divergences.
During high-impact news → RSI swings wildly.
In strong one-way trends without pullbacks — divergence keeps calling tops/bottoms too early.
✅ Summary:
This is a reversal-focused RSI divergence strategy with strict filters. It’s powerful when combined with higher-timeframe bias + structure confluence, but weak if traded blindly in choppy or news-driven conditions. Best to treat it as a precision entry trigger, not a full system — layer it on top of your FVG/ORB framework for maximum edge.

Gain Alarm (tijd + prijs gain)Gain Alarm (time + price)
This script triggers an alert once the price stays fully above a chosen line for a predefined period of time.
Select your own ticker, timeframe, and price level.
The alert is triggered only once per session.
A line is plotted on the chart with a label showing the selected timeframe, so you know which alert is active.
⚠️ Note: you must manually create a separate TradingView alert using the condition provided by the script.

Trend Score with Dynamic Stop Loss HTF
How the Trend Score System Works
This indicator uses a Trend Score (TS) to measure price momentum over time. It tracks whether price is breaking higher or lower, then sums these moves into a cumulative score to define trend direction.
⸻
1. Trend Score (+1 / -1 Mechanism)
On each new bar:
• +1 point: if the current bar breaks the previous bar’s high.
• −1 point: if the current bar breaks the previous bar’s low.
• If both happen in the same bar, they cancel each other out.
• If neither happens, the score does not change.
This creates a simple running measure of bullish vs bearish pressure.
⸻
2. Cumulative Trend Score
The Trend Score is cumulative, meaning each new +1 or -1 is added to the total score, building a continuous count.
• Rising scores = buyers are consistently pushing price to higher highs.
• Falling scores = sellers are consistently pushing price to lower lows.
This smooths out noise and helps identify persistent momentum rather than single-bar spikes.
⸻
3. Trend Flip Trigger (default = 3)
A trend flip occurs when the cumulative Trend Score changes by 3 points (default setting) in the opposite direction of the current trend.
• Bullish Flip:
• Cumulative TS rises 3 points from its most recent low pivot.
• Marks a potential start of a new uptrend.
• A bullish stop-loss (SL) is set at the most recent swing low.
• Bearish Flip:
• Cumulative TS falls 3 points from its most recent high pivot.
• Marks a potential start of a new downtrend.
• A bearish SL is set at the most recent swing high.
Example:
• TS is at -2, then climbs to +1.
• That’s a +3 change, triggering a bullish flip.
⸻
4. Visual Summary
• Green background: Active bullish trend.
• Red background: Active bearish trend.
• ▲ Triangle Up: A bullish flip occurred this bar.
• Stop Loss Line: Shows the structural low used for risk management.
⸻
Why This Matters
The Trend Score measures trend pressure simply and objectively:
• +1 / -1 mechanics track real price behavior (breakouts of highs and lows).
• Cumulative changes of 3 points act like a momentum filter, ignoring small reversals.
• This helps you see true regime shifts on higher timeframes, which is especially useful for swing trades and investing decisions.
⸻
Key Takeaways
• Only flips after meaningful swings: prevents overreacting to single-bar noise.
• SL shows invalidation point: helps you know where a trend thesis fails.
• Works best on Daily or Weekly charts: for smoother, more reliable signals. Using Trend Score for Long-Term Investing
This indicator is designed to support decision-making for higher timeframe investing, such as swing trades, multi-month positions, or even multi-year holds.
It helps you:
• Identify major bullish regimes.
• Decide when to add to winning positions (DCA up).
• Know when to pause buying or consider trimming during weak periods.
• Stay disciplined while holding long-term winners.
Important Note:
These are suggestions for context. Always combine them with your own analysis, portfolio allocation rules, and risk tolerance.
⸻
1. Start With the Higher Timeframe
• Use Weekly charts for a broad investing view.
• Use Daily charts only for fine-tuning entry points or deciding when to add.
• A Bullish Flip on Weekly suggests the market may be entering a major uptrend.
• If Weekly is bullish and Daily also turns bullish, it’s extra confirmation of strength.
⸻
2. Building a Position with DCA
Goal: Grow your position gradually during strong bullish regimes while staying aware of risk.
A. Initial Buy
• Start with a small initial allocation when a Bullish Flip appears on Weekly or Daily.
• This is just a starter position to get exposure while the new trend develops.
B. Adding Through Strength (DCA Up)
• Consider adding during pullbacks, as long as price stays above the active SL line.
• Each add should be smaller or equal to your first buy.
• Spread out adds over time or price levels, instead of going all-in at once.
C. Pause Buying When:
• Price approaches or touches the SL level (trend invalidation).
• A Bearish Flip appears on Weekly or Daily — this signals potential weakness.
• Your total position size reaches your maximum allocation limit for that asset.
⸻
3. Holding Winners
When a position grows in profit:
• Stay in the trend as long as the Weekly regime remains bullish.
• The indicator’s green background acts as a reminder to hold, not panic sell.
• Use the SL bubble to monitor where the trend could potentially break.
• Avoid selling just because of small pullbacks — focus on big-picture trend health.
⸻
4. Taking Partial Profits
While this tool is designed to help hold long-term winners, there may be times to lighten risk:
• After large, rapid moves far above the SL, consider trimming a small portion of your position.
• When MFE (Maximum Favorable Excursion) in the table reaches unusually high levels, it may signal overextension.
• If the Weekly chart turns Neutral or Bearish, you can gradually reduce exposure while waiting for the next Bullish Flip.
⸻
5. Using the Stop Loss Line for Awareness
The Dynamic SL line represents a structural level that, if broken, may suggest the bullish trend is weakening.
How to think about it:
• Above SL: Market remains structurally healthy — continue holding or adding gradually.
• Close to SL: Pause adds. Be cautious and consider tightening your risk.
• Below SL: Treat this as a potential signal to reassess your position, especially if the break is confirmed on Weekly.
The SL is not a hard stop — it’s a visual guide to help you manage expectations.
⸻
6. Example Use Case
Imagine you are investing in a growth stock:
• Weekly Bullish Flip: You open a small starter position.
• Price pulls back slightly but stays above SL: You add a second, smaller tranche.
• Trend continues up for months: You hold and stop adding once your desired allocation is reached.
• Price doubles: You trim 10–20% to lock some profits, but continue holding the majority.
• Price later dips below SL: You slow down, reassess, and decide whether to reduce exposure.
This keeps you:
• Participating in major uptrends.
• Avoiding overcommitment during weak phases.
• Making adjustments gradually, not emotionally.
⸻
7. Suggested Workflow
1. Check Weekly chart → is it Bullish?
2. If yes, review Daily chart to fine-tune entry or adds.
3. Build exposure gradually while Weekly remains bullish.
4. Watch SL bubbles as awareness points for risk management.
5. Use partial trims during big rallies, but avoid exiting entirely too soon.
6. Reassess if Weekly turns Neutral or Bearish.
⸻
Key Takeaways
• Use this as a compass, not a command system.
• Weekly flips = big picture direction.
• Daily flips = timing and precision.
• Add gradually (DCA) while above SL, pause near SL, reassess below SL.
• Hold winners as long as Weekly remains bullish.

Multi-TF Trend Table (Configurable)1) What this tool does (in one minute)
A compact, multi‑timeframe dashboard that stacks eight timeframes and tells you:
Trend (fast MA vs slow MA)
Where price sits relative to those MAs
How far price is from the fast MA in ATR terms
MA slope (rising, falling, flat)
Stochastic %K (with overbought/oversold heat)
MACD momentum (up or down)
A single score (0%–100%) per timeframe
Alignment tick when trend, structure, slope and momentum all agree
Use it to:
Frame bias top‑down (M→W→D→…→15m)
Time entries on your execution timeframe when the higher‑TF stack is aligned
Avoid counter‑trend traps when the table is mixed
2) Table anatomy (each column explained)
The table renders 9 columns × 8 rows (one row per timeframe label you define).
TF — The label you chose for that row (e.g., Month, Week, 4H). Cosmetic; helps you read the stack.
Trend — Arrow from fast MA vs slow MA: ↑ if fastMA > slowMA (up‑trend), ↓ otherwise (down‑trend). Cell is green for up, red for down.
Price Pos — One‑character structure cue:
🔼 if price is above both fast and slow MAs (bullish structure)
🔽 if price is below both (bearish structure)
– otherwise (between MAs / mixed)
MA Dist — Distance of price from the fast MA measured in ATR multiples:
XS < S < M < L < XL according to your thresholds (see §3.3). Useful for judging stretch/mean‑reversion risk and stop sizing.
MA Slope — The fast MA one‑bar slope:
↑ if fastMA - fastMA > 0
↓ if < 0
→ if = 0
Stoch %K — Rounded %K value (default 14‑1‑3). Background highlights when it aligns with the trend:
Green heat when trend up and %K ≤ oversold
Red heat when trend down and %K ≥ overbought Tooltip shows K and D values precisely.
Trend % — Composite score (0–100%), the dashboard’s confidence for that timeframe:
+20 if trendUp (fast>slow)
+20 if fast MA slope > 0
+20 if MACD up (signal definition in §2.8)
+20 if price above fast MA
+20 if price above slow MA
Background colours:
≥80 lime (strong alignment)
≥60 green (good)
≥40 orange (mixed)
<40 grey (weak/contrary)
MACD — 🟢 if EMA(12)−EMA(26) > its EMA(9), else 🔴. It’s a simple “momentum up/down” proxy.
Align — ✔ when everything is in gear for that trend direction:
For up: trendUp and price above both MAs and slope>0 and MACD up
For down: trendDown and price below both MAs and slope<0 and MACD down Tooltip spells this out.
3) Settings & how to tune them
3.1 Timeframes (TF1–TF8)
Inputs: TF1..TF8 hold the resolution strings used by request.security().
Defaults: M, W, D, 720, 480, 240, 60, 15 with display labels Month, Week, Day, 12H, 8H, 4H, 1H, 15m.
Tips
Keep a top‑down funnel (e.g., Month→Week→Day→H4→H1→M15) so you can cascade bias into entries.
If you scalp, consider D, 240, 120, 60, 30, 15, 5, 1.
Crypto weekends: consider 2D in place of W to reflect continuous trading.
3.2 Moving Average (MA) group
Type: EMA, SMA, WMA, RMA, HMA. Changes both fast & slow MA computations everywhere.
Fast Length: default 20. Shorten for snappier trend/slope & tighter “price above fast” signals.
Slow Length: default 200. Controls the structural trend and part of the score.
When to change
Swing FX/equities: EMA 20/200 is a solid baseline.
Mean‑reversion style: consider SMA 20/100 so trend flips slower.
Crypto/indices momentum: HMA 21 / EMA 200 will read slope more responsively.
3.3 ATR / Distance group
ATR Length: default 14; longer makes distance less jumpy.
XS/S/M/L thresholds: define the labels in column MA Dist. They are compared to |close − fastMA| / ATR.
Defaults: XS 0.25×, S 0.75×, M 1.5×, L 2.5×; anything ≥L is XL.
Usage
Entries late in a move often occur at L/XL; consider waiting for a pullback unless you are trading breakouts.
For stops, an initial SL around 0.75–1.5 ATR from fast MA often sits behind nearby noise; use your plan.
3.4 Stochastic group
%K Length / Smoothing / %D Smoothing: defaults 14 / 1 / 3.
Overbought / Oversold: defaults 70 / 30 (adjust to 80/20 for trendier assets).
Heat logic (column Stoch %K): highlights when a pullback aligns with the dominant trend (oversold in an uptrend, overbought in a downtrend).
3.5 View
Full Screen Table Mode: centers and enlarges the table (position.middle_center). Great for clean screenshots or multi‑monitor setups.
4) Signal logic (how each datapoint is computed)
Per‑TF data (via a single request.security()):
fastMA, slowMA → based on your MA Type and lengths
%K, %D → Stoch(High,Low,Close,kLen) smoothed by kSmooth, then %D smoothed by dSmooth
close, ATR(atrLen) → for structure and distance
MACD up → (EMA12−EMA26) > EMA9(EMA12−EMA26)
fastMA_prev → yesterday/previous‑bar fast MA for slope
TrendUp → fastMA > slowMA
Price Position → compares close to both MAs
MA Distance Label → thresholds on abs(close − fastMA)/ATR
Slope → fastMA − fastMA
Score (0–100) → sum of the five 20‑point checks listed in §2.7
Align tick → conjunction of trend, price vs both MAs, slope and MACD (see §2.9)
Important behaviour
HTF values are sampled at the execution chart’s bar close using Pine v6 defaults (no lookahead). So the daily row updates only when a daily bar actually closes.
5) How to trade with it (playbooks)
The table is a framework. Entries/exits still follow your plan (e.g., S/D zones, price action, risk rules). Use the table to know when to be aggressive vs patient.
Playbook A — Trend continuation (pullback entry)
Look for Align ✔ on your anchor TFs (e.g., Week+Day both ≥80 and green, Trend ↑, MACD 🟢).
On your execution TF (e.g., H1/H4), wait for Stoch heat with the trend (oversold in uptrend or overbought in downtrend), and MA Dist not at XL.
Enter on your trigger (break of pullback high/low, engulfing, retest of fast MA, or S/D first touch per your plan).
Risk: consider ATR‑based SL beyond structure; size so 0.25–0.5% account risk fits your rules.
Trail or scale at M/L distances or when score deteriorates (<60).
Playbook B — Breakout with confirmation
Mixed stack turns into broad green: Trend % jumps to ≥80 on Day and H4; MACD flips 🟢.
Price Pos shows 🔼 across H4/H1 (above both MAs). Slope arrows ↑.
Enter on the first clean base‑break with volume/impulse; avoid if MA Dist already XL.
Playbook C — Mean‑reversion fade (advanced)
Use only when higher TFs are not aligned and the row you trade shows XL distance against the higher‑TF context. Take quick targets back to fast MA. Lower win‑rate, faster management.
Playbook D — Top‑down filter for Supply/Demand strategy
Trade first retests only in the direction where anchor TFs (Week/Day) have Align ✔ and Trend % ≥60. Skip counter‑trend zones when the stack is red/green against you.
6) Reading examples
Strong bullish stack
Week: ↑, 🔼, S/M, slope ↑, %K=32 (green heat), Trend 100%, MACD 🟢, Align ✔
Day: ↑, 🔼, XS/S, slope ↑, %K=45, Trend 80%, MACD 🟢, Align ✔
Action: Look for H4/H1 pullback into demand or fast MA; buy continuation.
Late‑stage thrust
H1: ↑, 🔼, XL, slope ↑, %K=88
Day/H4: only 60–80%
Action: Likely overextended on H1; wait for mean reversion or multi‑TF alignment before chasing.
Bearish transition
Day flips from 60%→40%, Trend ↓, MACD turns 🔴, Price Pos “–” (between MAs)
Action: Stand aside for longs; watch for lower‑high + Align ✔ on H4/H1 to join shorts.
7) Practical tips & pitfalls
HTF closure: Don’t assume a daily row changed mid‑day; it won’t settle until the daily bar closes. For intraday anticipation, watch H4/H1 rows.
MA Type consistency: Changing MA Type changes slope/structure everywhere. If you compare screenshots, keep the same type.
ATR thresholds: Calibrate per asset class. FX may suit defaults; indices/crypto might need wider S/M/L.
Score ≠ signal: 100% does not mean “must buy now.” It means the environment is favourable. Still execute your trigger.
Mixed stacks: When rows disagree, reduce size or skip. The tool is telling you the market lacks consensus.
8) Customisation ideas
Timeframe presets: Save layouts (e.g., Swing, Intraday, Scalper) as indicator templates in TradingView.
Alternative momentum: Replace the MACD condition with RSI(>50/<50) if desired (would require code edit).
Alerts: You can add alert conditions for (a) Align ✔ changes, (b) Trend % crossing 60/80, (c) Stoch heat events. (Not shipped in this script, but easy to add.)
9) FAQ
Q: Why do I sometimes see a dash in Price Pos? A: Price is between fast and slow MAs. Structure is mixed; seek clarity before acting.
Q: Does it repaint? A: No, higher‑TF values update on the close of their own bars (standard request.security behaviour without lookahead). Intra‑bar they can fluctuate; decisions should be made at your bar close per your plan.
Q: Which columns matter most? A: For trend‑following: Trend, Price Pos, Slope, MACD, then Stoch heat for entries. The Score summarises, and Align enforces discipline.
Q: How do I integrate with ATR‑based risk? A: Use the MA Dist label to avoid chasing at extremes and to size stops in ATR terms (e.g., SL behind structure at ~1–1.5 ATR).

Machine Learning BBPct [BackQuant]Machine Learning BBPct
What this is (in one line)
A Bollinger Band %B oscillator enhanced with a simplified K-Nearest Neighbors (KNN) pattern matcher. The model compares today’s context (volatility, momentum, volume, and position inside the bands) to similar situations in recent history and blends that historical consensus back into the raw %B to reduce noise and improve context awareness. It is informational and diagnostic—designed to describe market state, not to sell a trading system.
Background: %B in plain terms
Bollinger %B measures where price sits inside its dynamic envelope: 0 at the lower band, 1 at the upper band, ~ 0.5 near the basis (the moving average). Readings toward 1 indicate pressure near the envelope’s upper edge (often strength or stretch), while readings toward 0 indicate pressure near the lower edge (often weakness or stretch). Because bands adapt to volatility, %B is naturally comparable across regimes.
Why add (simplified) KNN?
Classic %B is reactive and can be whippy in fast regimes. The simplified KNN layer builds a “nearest-neighbor memory” of recent market states and asks: “When the market looked like this before, where did %B tend to be next bar?” It then blends that estimate with the current %B. Key ideas:
• Feature vector . Each bar is summarized by up to five normalized features:
– %B itself (normalized)
– Band width (volatility proxy)
– Price momentum (ROC)
– Volume momentum (ROC of volume)
– Price position within the bands
• Distance metric . Euclidean distance ranks the most similar recent bars.
• Prediction . Average the neighbors’ prior %B (lagged to avoid lookahead), inverse-weighted by distance.
• Blend . Linearly combine raw %B and KNN-predicted %B with a configurable weight; optional filtering then adapts to confidence.
This remains “simplified” KNN: no training/validation split, no KD-trees, no scaling beyond windowed min-max, and no probabilistic calibration.
How the script is organized (by input groups)
1) BBPct Settings
• Price Source – Which price to evaluate (%B is computed from this).
• Calculation Period – Lookback for SMA basis and standard deviation.
• Multiplier – Standard deviation width (e.g., 2.0).
• Apply Smoothing / Type / Length – Optional smoothing of the %B stream before ML (EMA, RMA, DEMA, TEMA, LINREG, HMA, etc.). Turning this off gives you the raw %B.
2) Thresholds
• Overbought/Oversold – Default 0.8 / 0.2 (inside ).
• Extreme OB/OS – Stricter zones (e.g., 0.95 / 0.05) to flag stretch conditions.
3) KNN Machine Learning
• Enable KNN – Switch between pure %B and hybrid.
• K (neighbors) – How many historical analogs to blend (default 8).
• Historical Period – Size of the search window for neighbors.
• ML Weight – Blend between raw %B and KNN estimate.
• Number of Features – Use 2–5 features; higher counts add context but raise the risk of overfitting in short windows.
4) Filtering
• Method – None, Adaptive, Kalman-style (first-order),
or Hull smoothing.
• Strength – How aggressively to smooth. “Adaptive” uses model confidence to modulate its alpha: higher confidence → stronger reliance on the ML estimate.
5) Performance Tracking
• Win-rate Period – Simple running score of past signal outcomes based on target/stop/time-out logic (informational, not a robust backtest).
• Early Entry Lookback – Horizon for forecasting a potential threshold cross.
• Profit Target / Stop Loss – Used only by the internal win-rate heuristic.
6) Self-Optimization
• Enable Self-Optimization – Lightweight, rolling comparison of a few canned settings (K = 8/14/21 via simple rules on %B extremes).
• Optimization Window & Stability Threshold – Governs how quickly preferred K changes and how sensitive the overfitting alarm is.
• Adaptive Thresholds – Adjust the OB/OS lines with volatility regime (ATR ratio), widening in calm markets and tightening in turbulent ones (bounded 0.7–0.9 and 0.1–0.3).
7) UI Settings
• Show Table / Zones / ML Prediction / Early Signals – Toggle informational overlays.
• Signal Line Width, Candle Painting, Colors – Visual preferences.
Step-by-step logic
A) Compute %B
Basis = SMA(source, len); dev = stdev(source, len) × multiplier; Upper/Lower = Basis ± dev.
%B = (price − Lower) / (Upper − Lower). Optional smoothing yields standardBB .
B) Build the feature vector
All features are min-max normalized over the KNN window so distances are in comparable units. Features include normalized %B, normalized band width, normalized price ROC, normalized volume ROC, and normalized position within bands. You can limit to the first N features (2–5).
C) Find nearest neighbors
For each bar inside the lookback window, compute the Euclidean distance between current features and that bar’s features. Sort by distance, keep the top K .
D) Predict and blend
Use inverse-distance weights (with a strong cap for near-zero distances) to average neighbors’ prior %B (lagged by one bar). This becomes the KNN estimate. Blend it with raw %B via the ML weight. A variance of neighbor %B around the prediction becomes an uncertainty proxy ; combined with a stability score (how long parameters remain unchanged), it forms mlConfidence ∈ . The Adaptive filter optionally transforms that confidence into a smoothing coefficient.
E) Adaptive thresholds
Volatility regime (ATR(14) divided by its 50-bar SMA) nudges OB/OS thresholds wider or narrower within fixed bounds. The aim: comparable extremeness across regimes.
F) Early entry heuristic
A tiny two-step slope/acceleration probe extrapolates finalBB forward a few bars. If it is on track to cross OB/OS soon (and slope/acceleration agree), it flags an EARLY_BUY/SELL candidate with an internal confidence score. This is explicitly a heuristic—use as an attention cue, not a signal by itself.
G) Informational win-rate
The script keeps a rolling array of trade outcomes derived from signal transitions + rudimentary exits (target/stop/time). The percentage shown is a rough diagnostic , not a validated backtest.
Outputs and visual language
• ML Bollinger %B (finalBB) – The main line after KNN blending and optional filtering.
• Gradient fill – Greenish tones above 0.5, reddish below, with intensity following distance from the midline.
• Adaptive zones – Overbought/oversold and extreme bands; shaded backgrounds appear at extremes.
• ML Prediction (dots) – The KNN estimate plotted as faint circles; becomes bright white when confidence > 0.7.
• Early arrows – Optional small triangles for approaching OB/OS.
• Candle painting – Light green above the midline, light red below (optional).
• Info panel – Current value, signal classification, ML confidence, optimized K, stability, volatility regime, adaptive thresholds, overfitting flag, early-entry status, and total signals processed.
Signal classification (informational)
The indicator does not fire trade commands; it labels state:
• STRONG_BUY / STRONG_SELL – finalBB beyond extreme OS/OB thresholds.
• BUY / SELL – finalBB beyond adaptive OS/OB.
• EARLY_BUY / EARLY_SELL – forecast suggests a near-term cross with decent internal confidence.
• NEUTRAL – between adaptive bands.
Alerts (what you can automate)
• Entering adaptive OB/OS and extreme OB/OS.
• Midline cross (0.5).
• Overfitting detected (frequent parameter flipping).
• Early signals when early confidence > 0.7.
These are purely descriptive triggers around the indicator’s state.
Practical interpretation
• Mean-reversion context – In range markets, adaptive OS/OB with ML smoothing can reduce whipsaws relative to raw %B.
• Trend context – In persistent trends, the KNN blend can keep finalBB nearer the mid/upper region during healthy pullbacks if history supports similar contexts.
• Regime awareness – Watch the volatility regime and adaptive thresholds. If thresholds compress (high vol), “OB/OS” comes sooner; if thresholds widen (calm), it takes more stretch to flag.
• Confidence as a weight – High mlConfidence implies neighbors agree; you may rely more on the ML curve. Low confidence argues for de-emphasizing ML and leaning on raw %B or other tools.
• Stability score – Rising stability indicates consistent parameter selection and fewer flips; dropping stability hints at a shifting backdrop.
Methodological notes
• Normalization uses rolling min-max over the KNN window. This is simple and scale-agnostic but sensitive to outliers; the distance metric will reflect that.
• Distance is unweighted Euclidean. If you raise featureCount, you increase dimensionality; consider keeping K larger and lookback ample to avoid sparse-neighbor artifacts.
• Lag handling intentionally uses neighbors’ previous %B for prediction to avoid lookahead bias.
• Self-optimization is deliberately modest: it only compares a few canned K/threshold choices using simple “did an extreme anticipate movement?” scoring, then enforces a stability regime and an overfitting guard. It is not a grid search or GA.
• Kalman option is a first-order recursive filter (fixed gain), not a full state-space estimator.
• Hull option derives a dynamic length from 1/strength; it is a convenience smoothing alternative.
Limitations and cautions
• Non-stationarity – Nearest neighbors from the recent window may not represent the future under structural breaks (policy shifts, liquidity shocks).
• Curse of dimensionality – Adding features without sufficient lookback can make genuine neighbors rare.
• Overfitting risk – The script includes a crude overfitting detector (frequent parameter flips) and will fall back to defaults when triggered, but this is only a guardrail.
• Win-rate display – The internal score is illustrative; it does not constitute a tradable backtest.
• Latency vs. smoothness – Smoothing and ML blending reduce noise but add lag; tune to your timeframe and objectives.
Tuning guide
• Short-term scalping – Lower len (10–14), slightly lower multiplier (1.8–2.0), small K (5–8), featureCount 3–4, Adaptive filter ON, moderate strength.
• Swing trading – len (20–30), multiplier ~2.0, K (8–14), featureCount 4–5, Adaptive thresholds ON, filter modest.
• Strong trends – Consider higher adaptive_upper/lower bounds (or let volatility regime do it), keep ML weight moderate so raw %B still reflects surges.
• Chop – Higher ML weight and stronger Adaptive filtering; accept lag in exchange for fewer false extremes.
How to use it responsibly
Treat this as a state descriptor and context filter. Pair it with your execution signals (structure breaks, volume footprints, higher-timeframe bias) and risk management. If mlConfidence is low or stability is falling, lean less on the ML line and more on raw %B or external confirmation.
Summary
Machine Learning BBPct augments a familiar oscillator with a transparent, simplified KNN memory of recent conditions. By blending neighbors’ behavior into %B and adapting thresholds to volatility regime—while exposing confidence, stability, and a plain early-entry heuristic—it provides an informational, probability-minded view of stretch and reversion that you can interpret alongside your own process.

Ichimoku Cloud Signals [sgbpulse] Ichimoku Cloud Signals – Your Advanced Trading Tool
Meet Ichimoku Cloud Signals, the enhanced and interactive version of the classic Ichimoku Cloud indicator, designed specifically for TradingView traders seeking precision and flexibility in their trading decisions. This indicator allows you to maximize the Ichimoku's potential by customizing trend criteria, receiving clear visual signals for entering and exiting positions, and getting alerts to keep you informed.
Introduction to the Ichimoku Cloud
The Ichimoku Cloud, also known as Ichimoku Kinko Hyo, is a comprehensive technical analysis tool developed in Japan. It provides a broad view of the market: trend direction, momentum, and support and resistance levels. "Ichimoku Cloud Signals" takes this power and amplifies it with advanced features.
Key Components of the Ichimoku Cloud
The indicator displays all five familiar Ichimoku lines, along with the "Cloud" (Kumo):
Tenkan-sen (Conversion Line): Calculated as the average of the highest high and lowest low over the past 9 periods. A fast, short-term indicator used as a measure of immediate momentum.
Kijun-sen (Base Line): Calculated as the average of the highest high and lowest low over the past 26 periods. A medium-term reference line serving as a significant support/resistance level.
Senkou Span A (Leading Span A): The average of the Tenkan-sen and Kijun-sen, shifted 26 periods forward into the future.
Senkou Span B (Leading Span B): The average of the highest high and lowest low over the past 52 periods, also shifted 26 periods forward into the future.
Kumo (Cloud): The area between Senkou Span A and Senkou Span B. Its color changes: green for an uptrend (when Senkou Span A is above Senkou Span B) and red for a downtrend (when Senkou Span B is above Senkou Span A). The Cloud serves as a dynamic area of support/resistance and a tool for forecasting future trends.
Chikou Span (Lagging Span): The current closing price, shifted 26 periods backward into the past. It serves as a powerful trend confirmation tool.
How the Ichimoku Cloud Works and How to Interpret It
Trend Identification :
- Uptrend (Bullish): The price is above the Cloud. The higher the price is above the Cloud, the stronger the trend.
- Downtrend (Bearish): The price is below the Cloud. The lower the price is below the Cloud, the stronger the trend.
- Range/Consolidation: The price is within the Cloud. This indicates a market without a clear direction or one that is consolidating.
Support and Resistance:
- The Cloud itself acts as a dynamic area of support and resistance. In an uptrend, the Cloud serves as support. In a downtrend, it serves as resistance.
- A thick Cloud indicates stronger support/resistance levels, while a thin Cloud indicates weaker levels.
The Cloud as a Predictive Indicator:
The uniqueness of the Kumo (Cloud) lies in its ability to be shifted 26 periods forward. This part of the Cloud provides forecasts for future support and resistance levels and even suggests expected trend changes (like a "Kumo Twist" – a change in Cloud color), giving you a planning advantage.
Unique Advantages of Ichimoku Cloud Signals:
Ichimoku Cloud Signals takes the classic Ichimoku principles and gives you unprecedented control:
Focused Trend Selection:
Choose whether you want to analyze a bullish (uptrend) or bearish (downtrend) trend. The indicator will focus on the relevant criteria for your selection.
Customizable Trend Confirmation Criteria (8 Criteria):
The indicator relies on 8 key criteria for clear trend confirmation. You can enable or disable each criterion individually based on your trading strategy and desired risk level. Each criterion plays a vital role in confirming the strength of the trend:
- Price position relative to the Cloud (Kumo) (Default: true): Determines the main trend direction and whether it's bullish or bearish.
- Price position relative to Kijun-sen (Base Line) (Default: true): Indicates the medium-term trend and acts as a critical equilibrium level.
- Price position relative to Tenkan-sen (Conversion Line) (Default: false): Provides quick confirmation of current momentum and short-term market changes.
- Tenkan-sen (Conversion Line) / Kijun-sen (Base Line) Crossover (Default: true): A classic signal for momentum change, crucial for identifying entry points.
- Current Cloud trend (Kumo) (Default: false): Cloud color confirms the main trend direction in real-time.
- Projected Future Cloud trend (Kumo) (Default: true): Indicates an expected future change in the Cloud's trend, providing strong visual insight.
- Chikou Span (Lagging Span) position relative to the Cloud (Kumo) (Default: true): Confirms the current trend strength by comparing the price to the Ichimoku 26 periods ago.
- Chikou Span (Lagging Span) position relative to the Price (Default: false): Additional confirmation of trend strength, indicating buyer/seller dominance.
Full Customization of Ichimoku Parameters:
You can change the period lengths for each Ichimoku component, depending on your strategy:
- Conversion Line Length (Default: 9)
- Base Line Length (Default: 26)
- Leading Span Length (Default: 52)
- Cloud Lagging Length (Default: 26)
- Lagging Span Length (Default: 26)
Visual Criteria Table on the Chart:
Get immediate and clear feedback! A visual table is placed on the chart, showing in real-time which of the 8 criteria you have defined are met for your chosen trend. Criteria you have enabled will be highlighted with a blue color and a "➤" symbol, while disabled criteria will appear in a subtle gray shade. For each criterion, the table shows its real-time status with a "✔" symbol if the condition is met and an "✘" symbol if it is not met. This powerful visual tool provides a quick assessment, helps with learning, and allows for strategy optimization at the click of a button.
Precise Criteria Details in the Data Window:
Beyond the visual table, the indicator provides an additional critical layer of detail: for any point on the chart, you can hover over a candle and see in TradingView's Data Window the precise status and values of all eight criteria. For each criterion, you'll see a clear numerical value (1 or 0) indicating whether it's fully met (1) or not met (0). Additionally, you can inspect the exact numerical values of the Ichimoku lines (Tenkan-sen, Kijun-sen, etc.) at that specific moment. This comprehensive data supports in-depth analysis, strategy debugging, and long-term optimization, providing complete transparency regarding every component of the signal.
Smart and Customizable Alerts:
Ichimoku Cloud Signals provides a powerful alert system to keep you informed of key market movements, so you never miss an opportunity. There are eight unique alerts you can enable in TradingView's alert panel:
Uptrend Entry Alert: Triggers when all of your selected criteria for an uptrend are met on a new candle.
Uptrend Exit Alert: Triggers when one of your selected uptrend criteria is no longer met, signaling a potential exit point.
Downtrend Entry Alert: Triggers when all of your selected criteria for a downtrend are met on a new candle.
Downtrend Exit Alert: Triggers when one of your selected downtrend criteria is no longer met, signaling a potential exit point.
Bullish Crossover Alert: Triggers when the Conversion Line (Tenkan-sen) crosses above the Base Line (Kijun-sen), a classic signal for an upward momentum shift.
Bearish Crossover Alert: Triggers when the Conversion Line (Tenkan-sen) crosses below the Base Line (Kijun-sen), signaling a potential shift to downward momentum.
Bullish Cloud Breakout Alert: Triggers when the price closes above the Ichimoku Cloud (Kumo), indicating a strong bullish trend.
Bearish Cloud Breakout Alert: Triggers when the price closes below the Ichimoku Cloud (Kumo), indicating a strong bearish trend.
Each alert can be independently configured in TradingView's alert panel, allowing you to tailor your notifications to fit your exact trading strategy and risk management preferences.
Summary:
Ichimoku Cloud Signals is an essential tool for TradingView traders seeking control, clarity, and precision. It combines the power of the classic Ichimoku Cloud indicator with advanced customization capabilities, a convenient visual table, and clear signals, empowering you to make informed trading decisions and stay focused on managing your positions.
Important Note: Trading Risk
This indicator is intended for educational and informational purposes only and does not constitute investment advice or a recommendation for trading in any form whatsoever.
Trading in financial markets involves significant risk of capital loss. It is important to remember that past performance is not indicative of future results. All trading decisions are your sole responsibility. Never trade with money you cannot afford to lose.

RSI Momentum Divergence Zones [ChartPrime]⯁ OVERVIEW
RSI Momentum Divergence Zones is a hybrid oscillator and chart overlay tool that detects RSI-based momentum divergences and projects them as key zones on the chart. By combining RSI divergence logic with horizontal level plotting, this indicator reveals high-probability support and resistance areas where price has historically reacted to hidden or classic divergences.
⯁ KEY FEATURES
Momentum-Based RSI Source:
Instead of the classic RSI input, this tool uses the momentum of price as the RSI source:
rsiSrc = ta.mom(close, 10)
This emphasizes acceleration and deceleration of price moves, sharpening divergence signals and making them more responsive to early shifts in momentum.
Automatic Divergence Detection (Optional):
When enabled, the indicator continuously scans for:
— Bullish Divergence : Price makes a Lower Low while RSI forms a Higher Low
— Bearish Divergence : Price makes a Higher High while RSI forms a Lower High
It ensures divergence is valid by checking the spacing between pivots (min 5, max 50 bars).
Divergence Labels & Markers (RSI Pane + Chart):
When a valid divergence is detected:
— On RSI pane:
Labels appear at HL/LH points (“Bull” / “Bear”)
Colored lines show pivot structures
— On price chart:
Labels (“▲ Bull” / “Bear ▼”) mark price pivot that triggered the divergence
Lines highlight the exact price level at the divergence origin
Divergence Zones / Levels (Toggleable):
The indicator projects horizontal zones across the chart based on confirmed divergence points.
These levels dynamically extend as long as price respects them, and auto-expire once broken.
They act as S/R levels created by market imbalance caused by divergence reactions.
Dynamic Zone Extension Logic:
Once plotted, divergence levels will extend to the right:
— If price respects the level, the zone keeps growing
— If broken in the opposite direction, the level stops extending and turns dashed (visually showing break)
Zone Layering and Limit Control:
You can limit the number of simultaneous zones shown on the chart (e.g., 10 most recent).
Old zones automatically expire and are removed to keep the chart clean and focused.
Color Customization and Intensity:
Different colors for bullish and bearish zones let you easily distinguish trend direction.
Background fill, line width, and transparency are all adjustable.
Clean Zone Management with Arrays:
Behind the scenes, the script uses custom divLevel type arrays to manage plotted levels, ensuring they stay up-to-date, extend correctly, and delete once invalidated.
⯁ USAGE
Use bullish divergence zones as potential demand areas and bearish ones as supply zones.
Combine RSI pane labels with price-level zones to confirm strength of reversal.
Watch for price approaching a divergence level to anticipate reactions or breakouts.
Use divergence levels as trade triggers, stop-loss guides, or take-profit markers.
Limit signal count using the “Qty Divergence Zones” setting to reduce chart clutter.
Enable divergence detection only when you want to focus on key structural zones — ideal for swing or positional setups.
⯁ CONCLUSION
RSI Momentum Divergence Zones blends oscillator divergence logic with price action structure to uncover hidden strength or weakness in the market. With flexible zone plotting and clean visual signals, this tool empowers traders to identify where momentum turns into structure — turning hidden signals into tradable edges.

Canonical Momenta Indicator [T1][T69]📌 Overview
The Canonical Momenta Indicator models trend pressure using a Lagrangian-based momentum engine combined with reflexivity theory to detect bursts in price movement influenced by herd behavior and volume acceleration.
🧠 Features
Lagrangian-based kinetic model combining velocity and acceleration
Reflexivity burst detection with directional scoring
Adaptive momentum-weighted output (adaptiveCMI)
Buy 🐋 / Sell 🐻 labels when reflexivity confirms direction
Fully parameterized for customization
⚙️ How to Use
This indicator helps traders:
Detect reflexive bursts in market activity driven by sharp price movement + volume spikes
Capture herd-driven directional moves early.
Gauge market pressure using a kinetic-potential energy model.
Suggested signals:
🐋 Reflexive Up: Strong bullish momentum spike confirmed by volume and positive lagrangian pressure
🐻 Reflexive Down: Strong bearish dump confirmed by volume and negative lagrangian burst
🔧 Configuration
MA Lookback Length - Smoothing for baseline price & energy calculation
Reflexivity Momentum Threshold - Price momentum trigger for burst detection
Reflexivity Lookback - Period over which bursts are counted
Reflexivity Window - Minimum burst sum to trigger signal label
Volume Spike Threshold - % above average volume to qualify as burst
📊 Behavior Description
The indicator computes a Lagrangian energy:
Kinetic Energy = (velocity² + 0.5 * acceleration²)
Potential Energy = deviation from moving average (distance²)
Lagrangian = Potential − Kinetic (higher = overextension)
Then, reflexive bursts are triggered when:
Price is rising or falling over short window (burstMvmnt)
Volume is above average by a user-defined multiple
Each bar gets a burst score:
+1 for up-burst
−1 for down-burst
0 otherwise
⚠️ Risk Profile Based on Lookback Settings
Risk Level | Description | Recommended Lookback
🟥 High | Extremely sensitive to bursts, prone to false signals | 7–10
🟨 Moderate | Balanced reflexivity with trend confirmation | 11–20
🟩 Low | Filters out most noise, slower to react | 21+
🧪 Advanced Tips
Combine with moving average slope for trend filtering
Use divergence between adaptiveCMI and price to detect exhaustion
Works well in crypto, commodities, and volatile assets
⚠️ Limitations
Sensitive to high volatility noise if volMult is too low
Designed for higher timeframes (1H, 4H, Daily) for reliability
Doesn’t confirm direction in sideways markets — pair with other filters
📝 Disclaimer
This tool is provided for educational and informational purposes. Always do your own backtesting and use proper risk management.

Drawdown Distribution Analysis (DDA) ACADEMIC FOUNDATION AND RESEARCH BACKGROUND
The Drawdown Distribution Analysis indicator implements quantitative risk management principles, drawing upon decades of academic research in portfolio theory, behavioral finance, and statistical risk modeling. This tool provides risk assessment capabilities for traders and portfolio managers seeking to understand their current position within historical drawdown patterns.
The theoretical foundation of this indicator rests on modern portfolio theory as established by Markowitz (1952), who introduced the fundamental concepts of risk-return optimization that continue to underpin contemporary portfolio management. Sharpe (1966) later expanded this framework by developing risk-adjusted performance measures, most notably the Sharpe ratio, which remains a cornerstone of performance evaluation in financial markets.
The specific focus on drawdown analysis builds upon the work of Chekhlov, Uryasev and Zabarankin (2005), who provided the mathematical framework for incorporating drawdown measures into portfolio optimization. Their research demonstrated that traditional mean-variance optimization often fails to capture the full risk profile of investment strategies, particularly regarding sequential losses. More recent work by Goldberg and Mahmoud (2017) has brought these theoretical concepts into practical application within institutional risk management frameworks.
Value at Risk methodology, as comprehensively outlined by Jorion (2007), provides the statistical foundation for the risk measurement components of this indicator. The coherent risk measures framework developed by Artzner et al. (1999) ensures that the risk metrics employed satisfy the mathematical properties required for sound risk management decisions. Additionally, the focus on downside risk follows the framework established by Sortino and Price (1994), while the drawdown-adjusted performance measures implement concepts introduced by Young (1991).
MATHEMATICAL METHODOLOGY
The core calculation methodology centers on a peak-tracking algorithm that continuously monitors the maximum price level achieved and calculates the percentage decline from this peak. The drawdown at any time t is defined as DD(t) = (P(t) - Peak(t)) / Peak(t) × 100, where P(t) represents the asset price at time t and Peak(t) represents the running maximum price observed up to time t.
Statistical distribution analysis forms the analytical backbone of the indicator. The system calculates key percentiles using the ta.percentile_nearest_rank() function to establish the 5th, 10th, 25th, 50th, 75th, 90th, and 95th percentiles of the historical drawdown distribution. This approach provides a complete picture of how the current drawdown compares to historical patterns.
Statistical significance assessment employs standard deviation bands at one, two, and three standard deviations from the mean, following the conventional approach where the upper band equals μ + nσ and the lower band equals μ - nσ. The Z-score calculation, defined as Z = (DD - μ) / σ, enables the identification of statistically extreme events, with thresholds set at |Z| > 2.5 for extreme drawdowns and |Z| > 3.0 for severe drawdowns, corresponding to confidence levels exceeding 99.4% and 99.7% respectively.
ADVANCED RISK METRICS
The indicator incorporates several risk-adjusted performance measures that extend beyond basic drawdown analysis. The Sharpe ratio calculation follows the standard formula Sharpe = (R - Rf) / σ, where R represents the annualized return, Rf represents the risk-free rate, and σ represents the annualized volatility. The system supports dynamic sourcing of the risk-free rate from the US 10-year Treasury yield or allows for manual specification.
The Sortino ratio addresses the limitation of the Sharpe ratio by focusing exclusively on downside risk, calculated as Sortino = (R - Rf) / σd, where σd represents the downside deviation computed using only negative returns. This measure provides a more accurate assessment of risk-adjusted performance for strategies that exhibit asymmetric return distributions.
The Calmar ratio, defined as Annual Return divided by the absolute value of Maximum Drawdown, offers a direct measure of return per unit of drawdown risk. This metric proves particularly valuable for comparing strategies or assets with different risk profiles, as it directly relates performance to the maximum historical loss experienced.
Value at Risk calculations provide quantitative estimates of potential losses at specified confidence levels. The 95% VaR corresponds to the 5th percentile of the drawdown distribution, while the 99% VaR corresponds to the 1st percentile. Conditional VaR, also known as Expected Shortfall, estimates the average loss in the worst 5% of scenarios, providing insight into tail risk that standard VaR measures may not capture.
To enable fair comparison across assets with different volatility characteristics, the indicator calculates volatility-adjusted drawdowns using the formula Adjusted DD = Raw DD / (Volatility / 20%). This normalization allows for meaningful comparison between high-volatility assets like cryptocurrencies and lower-volatility instruments like government bonds.
The Risk Efficiency Score represents a composite measure ranging from 0 to 100 that combines the Sharpe ratio and current percentile rank to provide a single metric for quick asset assessment. Higher scores indicate superior risk-adjusted performance relative to historical patterns.
COLOR SCHEMES AND VISUALIZATION
The indicator implements eight distinct color themes designed to accommodate different analytical preferences and market contexts. The EdgeTools theme employs a corporate blue palette that matches the design system used throughout the edgetools.org platform, ensuring visual consistency across analytical tools.
The Gold theme specifically targets precious metals analysis with warm tones that complement gold chart analysis, while the Quant theme provides a grayscale scheme suitable for analytical environments that prioritize clarity over aesthetic appeal. The Behavioral theme incorporates psychology-based color coding, using green to represent greed-driven market conditions and red to indicate fear-driven environments.
Additional themes include Ocean, Fire, Matrix, and Arctic schemes, each designed for specific market conditions or user preferences. All themes function effectively with both dark and light mode trading platforms, ensuring accessibility across different user interface configurations.
PRACTICAL APPLICATIONS
Asset allocation and portfolio construction represent primary use cases for this analytical framework. When comparing multiple assets such as Bitcoin, gold, and the S&P 500, traders can examine Risk Efficiency Scores to identify instruments offering superior risk-adjusted performance. The 95% VaR provides worst-case scenario comparisons, while volatility-adjusted drawdowns enable fair comparison despite varying volatility profiles.
The practical decision framework suggests that assets with Risk Efficiency Scores above 70 may be suitable for aggressive portfolio allocations, scores between 40 and 70 indicate moderate allocation potential, and scores below 40 suggest defensive positioning or avoidance. These thresholds should be adjusted based on individual risk tolerance and market conditions.
Risk management and position sizing applications utilize the current percentile rank to guide allocation decisions. When the current drawdown ranks above the 75th percentile of historical data, indicating that current conditions are better than 75% of historical periods, position increases may be warranted. Conversely, when percentile rankings fall below the 25th percentile, indicating elevated risk conditions, position reductions become advisable.
Institutional portfolio monitoring applications include hedge fund risk dashboard implementations where multiple strategies can be monitored simultaneously. Sharpe ratio tracking identifies deteriorating risk-adjusted performance across strategies, VaR monitoring ensures portfolios remain within established risk limits, and drawdown duration tracking provides valuable information for investor reporting requirements.
Market timing applications combine the statistical analysis with trend identification techniques. Strong buy signals may emerge when risk levels register as "Low" in conjunction with established uptrends, while extreme risk levels combined with downtrends may indicate exit or hedging opportunities. Z-scores exceeding 3.0 often signal statistically oversold conditions that may precede trend reversals.
STATISTICAL SIGNIFICANCE AND VALIDATION
The indicator provides 95% confidence intervals around current drawdown levels using the standard formula CI = μ ± 1.96σ. This statistical framework enables users to assess whether current conditions fall within normal market variation or represent statistically significant departures from historical patterns.
Risk level classification employs a dynamic assessment system based on percentile ranking within the historical distribution. Low risk designation applies when current drawdowns perform better than 50% of historical data, moderate risk encompasses the 25th to 50th percentile range, high risk covers the 10th to 25th percentile range, and extreme risk applies to the worst 10% of historical drawdowns.
Sample size considerations play a crucial role in statistical reliability. For daily data, the system requires a minimum of 252 trading days (approximately one year) but performs better with 500 or more observations. Weekly data analysis benefits from at least 104 weeks (two years) of history, while monthly data requires a minimum of 60 months (five years) for reliable statistical inference.
IMPLEMENTATION BEST PRACTICES
Parameter optimization should consider the specific characteristics of different asset classes. Equity analysis typically benefits from 500-day lookback periods with 21-day smoothing, while cryptocurrency analysis may employ 365-day lookback periods with 14-day smoothing to account for higher volatility patterns. Fixed income analysis often requires longer lookback periods of 756 days with 34-day smoothing to capture the lower volatility environment.
Multi-timeframe analysis provides hierarchical risk assessment capabilities. Daily timeframe analysis supports tactical risk management decisions, weekly analysis informs strategic positioning choices, and monthly analysis guides long-term allocation decisions. This hierarchical approach ensures that risk assessment occurs at appropriate temporal scales for different investment objectives.
Integration with complementary indicators enhances the analytical framework. Trend indicators such as RSI and moving averages provide directional bias context, volume analysis helps confirm the severity of drawdown conditions, and volatility measures like VIX or ATR assist in market regime identification.
ALERT SYSTEM AND AUTOMATION
The automated alert system monitors five distinct categories of risk events. Risk level changes trigger notifications when drawdowns move between risk categories, enabling proactive risk management responses. Statistical significance alerts activate when Z-scores exceed established threshold levels of 2.5 or 3.0 standard deviations.
New maximum drawdown alerts notify users when historical maximum levels are exceeded, indicating entry into uncharted risk territory. Poor risk efficiency alerts trigger when the composite risk efficiency score falls below 30, suggesting deteriorating risk-adjusted performance. Sharpe ratio decline alerts activate when risk-adjusted performance turns negative, indicating that returns no longer compensate for the risk undertaken.
TRADING STRATEGIES
Conservative risk parity strategies can be implemented by monitoring Risk Efficiency Scores across a diversified asset portfolio. Monthly rebalancing maintains equal risk contribution from each asset, with allocation reductions triggered when risk levels reach "High" status and complete exits executed when "Extreme" risk levels emerge. This approach typically results in lower overall portfolio volatility, improved risk-adjusted returns, and reduced maximum drawdown periods.
Tactical asset rotation strategies compare Risk Efficiency Scores across different asset classes to guide allocation decisions. Assets with scores exceeding 60 receive overweight allocations, while assets scoring below 40 receive underweight positions. Percentile rankings provide timing guidance for allocation adjustments, creating a systematic approach to asset allocation that responds to changing risk-return profiles.
Market timing strategies with statistical edges can be constructed by entering positions when Z-scores fall below -2.5, indicating statistically oversold conditions, and scaling out when Z-scores exceed 2.5, suggesting overbought conditions. The 95% VaR serves as a stop-loss reference point, while trend confirmation indicators provide additional validation for position entry and exit decisions.
LIMITATIONS AND CONSIDERATIONS
Several statistical limitations affect the interpretation and application of these risk measures. Historical bias represents a fundamental challenge, as past drawdown patterns may not accurately predict future risk characteristics, particularly during structural market changes or regime shifts. Sample dependence means that results can be sensitive to the selected lookback period, with shorter periods providing more responsive but potentially less stable estimates.
Market regime changes can significantly alter the statistical parameters underlying the analysis. During periods of structural market evolution, historical distributions may provide poor guidance for future expectations. Additionally, many financial assets exhibit return distributions with fat tails that deviate from normal distribution assumptions, potentially leading to underestimation of extreme event probabilities.
Practical limitations include execution risk, where theoretical signals may not translate directly into actual trading results due to factors such as slippage, timing delays, and market impact. Liquidity constraints mean that risk metrics assume perfect liquidity, which may not hold during stressed market conditions when risk management becomes most critical.
Transaction costs are not incorporated into risk-adjusted return calculations, potentially overstating the attractiveness of strategies that require frequent trading. Behavioral factors represent another limitation, as human psychology may override statistical signals, particularly during periods of extreme market stress when disciplined risk management becomes most challenging.
TECHNICAL IMPLEMENTATION
Performance optimization ensures reliable operation across different market conditions and timeframes. All technical analysis functions are extracted from conditional statements to maintain Pine Script compliance and ensure consistent execution. Memory efficiency is achieved through optimized variable scoping and array usage, while computational speed benefits from vectorized calculations where possible.
Data quality requirements include clean price data without gaps or errors that could distort distribution analysis. Sufficient historical data is essential, with a minimum of 100 bars required and 500 or more preferred for reliable statistical inference. Time alignment across related assets ensures meaningful comparison when conducting multi-asset analysis.
The configuration parameters are organized into logical groups to enhance usability. Core settings include the Distribution Analysis Period (100-2000 bars), Drawdown Smoothing Period (1-50 bars), and Price Source selection. Advanced metrics settings control risk-free rate sourcing, either from live market data or fixed rate specification, along with toggles for various risk-adjusted metric calculations.
Display options provide flexibility in visual presentation, including color theme selection from eight available schemes, automatic dark mode optimization, and control over table display, position lines, percentile bands, and standard deviation overlays. These options ensure that the indicator can be adapted to different analytical workflows and visual preferences.
CONCLUSION
The Drawdown Distribution Analysis indicator provides risk management tools for traders seeking to understand their current position within historical risk patterns. By combining established statistical methodology with practical usability features, the tool enables evidence-based risk assessment and portfolio optimization decisions.
The implementation draws upon established academic research while providing practical features that address real-world trading requirements. Dynamic risk-free rate integration ensures accurate risk-adjusted performance calculations, while multiple color schemes accommodate different analytical preferences and use cases.
Academic compliance is maintained through transparent methodology and acknowledgment of limitations. The tool implements peer-reviewed statistical techniques while clearly communicating the constraints and assumptions underlying the analysis. This approach ensures that users can make informed decisions about the appropriate application of the risk assessment framework within their broader trading and investment processes.
BIBLIOGRAPHY
Artzner, P., Delbaen, F., Eber, J.M. and Heath, D. (1999) 'Coherent Measures of Risk', Mathematical Finance, 9(3), pp. 203-228.
Chekhlov, A., Uryasev, S. and Zabarankin, M. (2005) 'Drawdown Measure in Portfolio Optimization', International Journal of Theoretical and Applied Finance, 8(1), pp. 13-58.
Goldberg, L.R. and Mahmoud, O. (2017) 'Drawdown: From Practice to Theory and Back Again', Journal of Risk Management in Financial Institutions, 10(2), pp. 140-152.
Jorion, P. (2007) Value at Risk: The New Benchmark for Managing Financial Risk. 3rd edn. New York: McGraw-Hill.
Markowitz, H. (1952) 'Portfolio Selection', Journal of Finance, 7(1), pp. 77-91.
Sharpe, W.F. (1966) 'Mutual Fund Performance', Journal of Business, 39(1), pp. 119-138.
Sortino, F.A. and Price, L.N. (1994) 'Performance Measurement in a Downside Risk Framework', Journal of Investing, 3(3), pp. 59-64.
Young, T.W. (1991) 'Calmar Ratio: A Smoother Tool', Futures, 20(1), pp. 40-42.

MA Signal IndicatorMA Signal Indicator
The MA Signal Indicator is a customizable designed to identify potential trading opportunities based on price interactions with a Simple Moving Average (SMA). It incorporates risk management features such as stop-loss (SL), take-profit (TP), and breakeven levels, calculated using the Average True Range (ATR). The indicator is visually intuitive, overlaying trade signals, price levels, and colored zones directly on the chart.
Key Features:
1. Moving Average-Based Signals:
• Generates buy (long) signals when the price crosses above a user-defined SMA (default: 55 periods).
• Generates sell (short) signals when the price crosses below the SMA.
• Long and short trades can be independently enabled or disabled via input settings.
2. Risk Management:
• Stop-Loss (SL): Set as a multiple of the ATR (default: 1x ATR) below the entry price for long trades or above for short trades.
• Take-Profit (TP): Set as a multiple of the ATR (default: 5x ATR) above the entry price for long trades or below for short trades.
• Breakeven Level: A trigger level (default: 2x ATR) where traders may choose to move their stop-loss to breakeven, optionally displayed on the chart.
3. Visual Feedback:
• SMA Line: Plotted in orange (default: 55-period SMA) for trend reference.
• Trade Zone: Highlights the area between the stop-loss and take-profit levels with a semi-transparent green (long) or red (short) background.
• Price Lines: Displays entry price (white), stop-loss (red), take-profit (green), and breakeven level (gray, optional) as horizontal lines during active trades.
• Signal Markers: Triangular markers indicate entry points (green triangle up for long, red triangle down for short).
• Exit Markers: Labels show when a trade hits the take-profit (green checkmark) or stop-loss (red cross).
4. Trade Logic:
• Only one trade is active at a time (long or short).
• Trades are exited when either the stop-loss or take-profit is hit, resetting the indicator for the next signal.
• Ensures signals are only triggered when not already in a trade, avoiding duplicate entries.
Inputs:
• MA Period: Length of the SMA (default: 55).
• ATR Period: Period for ATR calculation (default: 5).
• SL Multiplier: ATR multiplier for stop-loss (default: 1.0).
• TP Multiplier: ATR multiplier for take-profit (default: 5.0).
• Move to Breakeven After: ATR multiplier for breakeven trigger (default: 2.0).
• Show Break Even Line: Option to display the breakeven level (default: true).
• Allow Long Trades: Enable/disable long signals (default: true).
• Allow Short Trades: Enable/disable short signals (default: true).
Use Case:
This indicator is ideal for trend-following traders who want a clear, visual system for entering and exiting trades based on SMA crossovers, with predefined risk and reward levels. It suits both manual and automated trading strategies, providing flexibility to adjust parameters for different markets or timeframes.
Notes:
• The indicator is overlaid on the price chart for easy integration with other analysis tools.
• Users should test and adjust parameters (e.g., MA length, ATR multipliers) to suit their trading style and market conditions.
• The breakeven line is a visual guide; manual adjustment of stops is required as the indicator does not automatically modify trade positions.
This indicator provides a robust framework for disciplined trading with clear entry, exit, and risk management visuals.
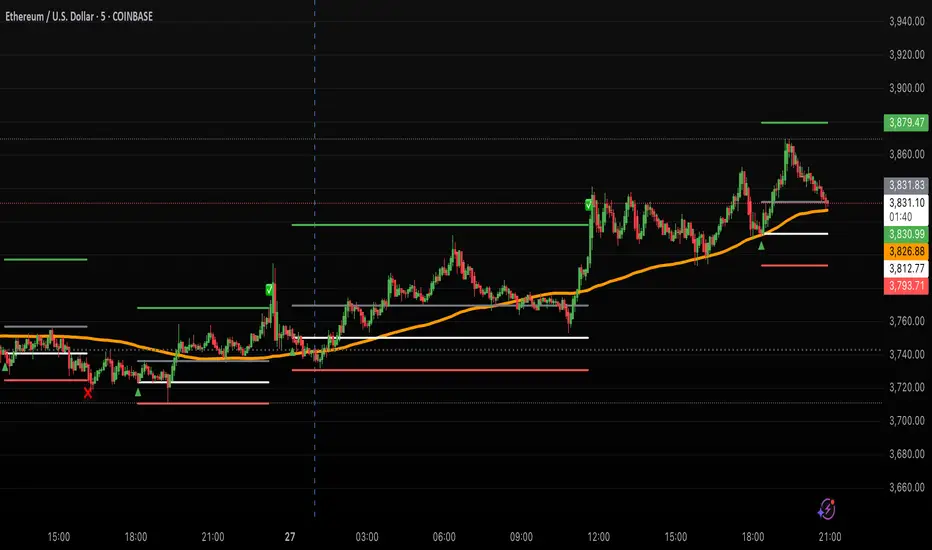
Options Strategy V1.3📈 Options Strategy V1.3 — EMA Crossover + RSI + ATR + Opening Range
Overview:
This strategy is designed for short-term directional trades on large-cap stocks or ETFs, especially when trading options. It combines classic trend-following signals with momentum confirmation, volatility-based risk management, and session timing filters to help identify high-probability entries with predefined stop-loss and profit targets.
🔍 Strategy Components:
EMA Crossover (Fast/Slow)
Entry signals are triggered by the crossover of a short EMA above or below a long EMA — a traditional trend-following method to detect shifts in momentum.
RSI Filter
RSI confirms the signal by avoiding entries in overbought/oversold zones unless certain momentum conditions are met.
Long entry requires RSI ≥ Long Threshold
Short entry requires RSI ≤ Short Threshold
ATR-Based SL & TP
Stop-loss is set dynamically as a multiple of ATR below (long) or above (short) the entry price.
Take-profit is placed as a ratio (TP/SL) of the stop distance, ensuring consistent reward/risk structure.
Opening Range Filter (Optional)
If enabled, the strategy only triggers trades after price breaks out of the 09:30–09:45 EST range, ensuring participation in directional moves.
Session Filters
No trades from 04:00 to 09:30 and from 16:00 to 20:00 EST, avoiding low-liquidity periods.
All open trades are closed at 15:55 EST, to avoid overnight risk or expiration issues for options.
⚙️ Built-in Presets:
You can choose one of the built-in ticker-specific presets for optimal conditions:
Ticker EMAs RSI (Long/Short) ATR SL×ATR TP/SL
SPY 8/28 56 / 26 14 1.4× 4.0×
TSLA 23/27 56 / 33 13 1.4× 3.6×
AAPL 6/13 61 / 26 23 1.4× 2.1×
MSFT 25/32 54 / 26 14 1.2× 2.2×
META 25/32 53 / 26 17 1.8× 2.3×
AMZN 28/32 55 / 25 16 1.8× 2.3×
You can also choose "Custom" to fully configure all parameters to your own market and strategy preferences.
📌 Best Use Case:
This strategy is especially suited for intraday options trading, where timing and risk control are critical. It works best on liquid tickers with strong trends or clear breakout behavior.

Volatility & Momentum Nexus (VMN)Volatility & Momentum Nexus (VMN)
This indicator was designed to solve a common trader's problem: chart clutter from dozens of indicators that often contradict each other. The Volatility & Momentum Nexus ( VMN ) is not just another indicator; it's a complete analysis system that synthesizes four essential market pillars into a single, clean, and intuitive visual signal.
The goal of VMN is to identify high-probability moments where a period of accumulation (low volatility) is about to erupt into an explosive move, confirmed by trend, momentum, and volume.
VMN analyzes the real-time confluence of four critical elements:
The Trend (The Main Filter): A 100-period Exponential Moving Average (EMA) sets the overall context. The indicator will only look for buy signals above this line (in an uptrend) and sell signals below it (in a downtrend). The line's color changes for quick visualization.
Volatility (Energy Accumulation): Using Bollinger Bands Width (BBW), the indicator identifies "Squeeze" periods—when the price contracts and builds up energy. These zones are marked with a yellow background on the chart, signaling that a major move is imminent.
Momentum (The Trigger): An RSI (Relative Strength Index) acts as the trigger. A signal is only validated if momentum confirms the direction of the breakout (e.g., RSI > 55 for a buy), ensuring we enter the market with force.
Volume (The Final Confirmation): No breakout move is credible without volume. VMN checks if the volume at the time of the signal is significantly higher than its recent average, adding a vital layer of confirmation.
Green Arrow (Buy Signal): Appears ONLY when ALL the following conditions are met simultaneously:
Price is above the 100 EMA (Bullish Trend).
The chart is exiting a Squeeze zone (yellow background on the previous bar).
Price breaks above the upper Bollinger Band.
RSI is above the buy threshold (default 55).
Volume is above average.
Red Arrow (Sell Signal): Appears ONLY when all the opposite conditions are met.
Do not treat signals as blind commands to trade. They are high-probability confirmations.
Look for signals near key Support/Resistance levels for an even higher success rate.
Always set a Stop Loss (e.g., below the low of the signal candle or below the lower Bollinger Band for a buy).
All parameters (EMA, RSI, Bollinger Bands lengths, thresholds, etc.) can be customized from the settings menu to adapt the indicator to any financial asset or timeframe.
Disclaimer: This indicator is a tool for educational and analytical purposes. It does not constitute and should not be interpreted as financial advice. Trading involves significant risk. Always perform your own analysis and backtesting before risking real capital.

Hull For LoopHull For Loop is a sophisticated trend-following indicator that combines the smoothness of Hull Moving Averages with advanced trend detection algorithms and robust confirmation mechanisms.
## How It Works
At its foundation, Hull For Loop employs a custom-calculated Hull Moving Average using weighted moving average for-loops to achieve optimal smoothness and responsiveness. The system operates through three distinct layers: Hull MA calculation with adjustable smoothing multipliers, advanced trend detection using ATR-based slope thresholds, and multi-bar trend confirmation to filter false breakouts.
The logic flow is elegantly simple yet powerful:
- Hull Calculation combines half-period and full-period weighted moving averages, then applies square-root smoothing for enhanced responsiveness
- Trend Detection analyzes Hull slope against dynamic ATR-based thresholds, classifying market direction as bullish, bearish, or neutral
- Confirmation System requires sustained directional movement across multiple bars before triggering signals, dramatically reducing whipsaws
When Hull slope exceeds the positive threshold, bullish conditions emerge. When it falls below the negative threshold, bearish momentum takes control. The multi-bar confirmation ensures only sustained moves generate actionable signals, making this system ideal for trend-following strategies across volatile markets.
The advanced slope analysis mechanism adapts to market volatility through ATR integration, ensuring sensitivity remains optimal during both high-volatility breakouts and low-volatility consolidations, delivering consistent performance across varying market conditions.
## Features
- Custom Hull Implementation : For-loop calculations for precise weighted moving average control and enhanced smoothness
- Dynamic Trend Detection : ATR-based slope analysis automatically adjusts sensitivity to market volatility conditions
- Multi-Bar Confirmation : Configurable confirmation periods (1-5 bars) eliminate false signals and reduce trading noise
- Advanced Visual System : Dynamic color coding, optional arrows, and statistics table for comprehensive market visualization
- Optimized for Bitcoin : Extensively backtested parameters delivering 128.58% returns with 55% drawdown reduction versus buy-and-hold
- Flexible Configuration : Hull length (1-200), smoothing multiplier (0.1-3.0), sensitivity (1-10), and confirmation settings
- Professional Alerts : Comprehensive alert system for trend changes and entry signals with strength percentages
- Real-time Analytics : Optional statistics table displaying trend direction, strength, Hull value, and current price
## Signal Generation
Hull For Loop generates multiple signal types for comprehensive trend analysis and precise entry/exit timing:
Primary Signals : Confirmed trend changes from bullish to bearish or vice versa - highest probability directional moves
Entry Signals : Initial trend confirmation after multi-bar validation - optimal position entry points
Strength Indicators : Real-time trend strength percentages based on directional momentum over lookback periods
Visual Confirmations : Color-coded Hull line providing instant visual trend status
The confirmation system adds crucial reliability - signals must persist through the specified confirmation period before activation, ensuring only sustained moves trigger trading decisions rather than temporary price fluctuations.
## Visual Implementation
The indicator employs sophisticated visual elements for immediate trend comprehension and professional chart presentation:
- Dynamic Hull Line : Color-changing line (green/red/gray) with configurable width reflecting current trend status
- Optional Directional Arrows : Triangle markers below/above bars marking confirmed trend changes and entry points (disabled by default)
- Statistics Panel : Optional real-time table showing trend direction, strength percentage, Hull value, and current price
- Professional Color Scheme : Customizable bullish (green), bearish (red), and neutral (gray) color system
## Alerts
Hull For Loop includes comprehensive alert conditions for automated trading integration:
- Hull Trend Change - Confirmed trend direction shift with strength percentage
- Hull BUY Signal - Bullish trend confirmation with price and strength data
- Hull SELL Signal - Bearish trend confirmation with price and strength data
- Alert Frequency - Once per bar to prevent spam while maintaining accuracy
All alerts include contextual information: trend direction, current price, and trend strength percentage for informed decision-making.
## Use Cases
Trend Following : Optimized for sustained directional moves with superior drawdown protection compared to buy-and-hold strategies
Swing Trading : Multi-bar confirmation eliminates false breakouts while capturing significant trend changes
Position Trading : Smooth Hull calculation provides stable signals for longer-term directional positioning
Risk Management : Advanced confirmation system dramatically reduces whipsaw trades and false signals
Crypto Trading : Specifically optimized for Bitcoin with parameters delivering exceptional historical performance
The system demonstrates exceptional performance across volatile assets.

Quantum Reversal# 🧠 Quantum Reversal
## **Quantitative Mean Reversion Framework**
This algorithmic trading system employs **statistical mean reversion theory** combined with **adaptive volatility modeling** to capitalize on Bitcoin's inherent price oscillations around its statistical mean. The strategy integrates multiple technical indicators through a **multi-layered signal processing architecture**.
---
## ⚡ **Core Technical Architecture**
### 📊 **Statistical Foundation**
- **Bollinger Band Mean Reversion Model**: Utilizes 20-period moving average with 2.2 standard deviation bands for volatility-adjusted entry signals
- **Adaptive Volatility Threshold**: Dynamic standard deviation multiplier accounts for Bitcoin's heteroscedastic volatility patterns
- **Price Action Confluence**: Entry triggered when price breaches lower volatility band, indicating statistical oversold conditions
### 🔬 **Momentum Analysis Layer**
- **RSI Oscillator Integration**: 14-period Relative Strength Index with modified oversold threshold at 45
- **Signal Smoothing Algorithm**: 5-period simple moving average applied to RSI reduces noise and false signals
- **Momentum Divergence Detection**: Captures mean reversion opportunities when momentum indicators show oversold readings
### ⚙️ **Entry Logic Architecture**
```
Entry Condition = (Price ≤ Lower_BB) OR (Smoothed_RSI < 45)
```
- **Dual-Condition Framework**: Either statistical price deviation OR momentum oversold condition triggers entry
- **Boolean Logic Gate**: OR-based entry system increases signal frequency while maintaining statistical validity
- **Position Sizing**: Fixed 10% equity allocation per trade for consistent risk exposure
### 🎯 **Exit Strategy Optimization**
- **Profit-Lock Mechanism**: Positions only closed when showing positive unrealized P&L
- **Trend Continuation Logic**: Allows winning trades to run until momentum exhaustion
- **Dynamic Exit Timing**: No fixed profit targets - exits based on profitability state rather than arbitrary levels
---
## 📈 **Statistical Properties**
### **Risk Management Framework**
- **Long-Only Exposure**: Eliminates short-squeeze risk inherent in cryptocurrency markets
- **Mean Reversion Bias**: Exploits Bitcoin's tendency to revert to statistical mean after extreme moves
- **Position Management**: Single position limit prevents over-leveraging
### **Signal Processing Characteristics**
- **Noise Reduction**: SMA smoothing on RSI eliminates high-frequency oscillations
- **Volatility Adaptation**: Bollinger Bands automatically adjust to changing market volatility
- **Multi-Timeframe Coherence**: Indicators operate on consistent timeframe for signal alignment
---
## 🔧 **Parameter Configuration**
| Technical Parameter | Value | Statistical Significance |
|-------------------|-------|-------------------------|
| Bollinger Period | 20 | Standard statistical lookback for volatility calculation |
| Std Dev Multiplier | 2.2 | Optimized for Bitcoin's volatility distribution (95.4% confidence interval) |
| RSI Period | 14 | Traditional momentum oscillator period |
| RSI Threshold | 45 | Modified oversold level accounting for Bitcoin's momentum characteristics |
| Smoothing Period | 5 | Noise reduction filter for momentum signals |
---
## 📊 **Algorithmic Advantages**
✅ **Statistical Edge**: Exploits documented mean reversion tendency in Bitcoin markets
✅ **Volatility Adaptation**: Dynamic bands adjust to changing market conditions
✅ **Signal Confluence**: Multiple indicator confirmation reduces false positives
✅ **Momentum Integration**: RSI smoothing improves signal quality and timing
✅ **Risk-Controlled Exposure**: Systematic position sizing and long-only bias
---
## 🔬 **Mathematical Foundation**
The strategy leverages **Bollinger Band theory** (developed by John Bollinger) which assumes that prices tend to revert to the mean after extreme deviations. The RSI component adds **momentum confirmation** to the statistical price deviation signal.
**Statistical Basis:**
- Mean reversion follows the principle that extreme price deviations from the moving average are temporary
- The 2.2 standard deviation multiplier captures approximately 97.2% of price movements under normal distribution
- RSI momentum smoothing reduces noise inherent in oscillator calculations
---
## ⚠️ **Risk Considerations**
This algorithm is designed for traders with understanding of **quantitative finance principles** and **cryptocurrency market dynamics**. The strategy assumes mean-reverting behavior which may not persist during trending market phases. Proper risk management and position sizing are essential.
---
## 🎯 **Implementation Notes**
- **Market Regime Awareness**: Most effective in ranging/consolidating markets
- **Volatility Sensitivity**: Performance may vary during extreme volatility events
- **Backtesting Recommended**: Historical performance analysis advised before live implementation
- **Capital Allocation**: 10% per trade sizing assumes diversified portfolio approach
---
**Engineered for quantitative traders seeking systematic mean reversion exposure in Bitcoin markets through statistically-grounded technical analysis.**

80% Rule Indicator (ETH Session + SVP Prior Session)I created this script to show the 80% opportunity on chart if setting lines up.
"80% rule: Open outside the vah or Val. Spend 30 mins outside there then break back inside spend 15 mins below or above depending which way u broke. Then come back and retest the vah/val and take it to the poc as a first target with the final target being the other Val/vah "
📌 Script Summary
The "80% Rule Indicator (ETH Session + SVP Prior Session)" overlays your chart with prior session value area levels (VAH, VAL, and POC) calculated from extended-hours 30-minute data. It tracks when the price reenters the value area and confirms 80% Rule setups during your chosen trading session. You can optionally trigger alerts, show/hide market sessions, and fine-tune line appearance for a clean, modular workflow.
⚙️ Options & Settings Breakdown
- Use 24-Hour Session (All Markets)
When checked, the indicator ignores time zones and tracks signals during a full 24-hour period (0000-0000), helpful if you're outside U.S. trading hours or want consistent behavior globally.
- Market Session
Dropdown to select one of three key market zones:
- New York (09:30–16:00 ET)
- London (08:00–16:30 local)
- Tokyo (09:00–15:00 local)
Used to gate entry signals during relevant hours unless you choose the 24-hour option.
- Show PD VAH/VAL/POC Lines
Toggle to show or hide prior day’s levels (based on the 30-min extended session). Turning this off removes both the lines and their white text labels.
- Extend Lines Right
When enabled, the VAH/VAL/POC lines extend into the current day’s session. If disabled, they appear only at their anchor point.
- Highlight Selected Session
Adds a soft blue background to help visualize the active session you selected.
- Enable Alert Conditions
Allows TradingView alerts to be created for long/short 80% Rule entries.
- Enable Audible Alerts
Plays an in-chart sound with a popup message (“80% Rule LONG” or “SHORT”) when signals trigger. Requires the chart to be active and sounds enabled in TradingView.
