Price Wave V.1.0The Price Wave Indicator is very good add-on to the Volume wave which is an important tool in the Wyckoffian Analysis of the stocks. Along with the Volume wave it helps to understand the effort and result ratios and the consequent effect on the stocks. It has to be used in conjunction with the Volume wave and not useful on a standalone basis
Tìm kiếm tập lệnh với "wave"

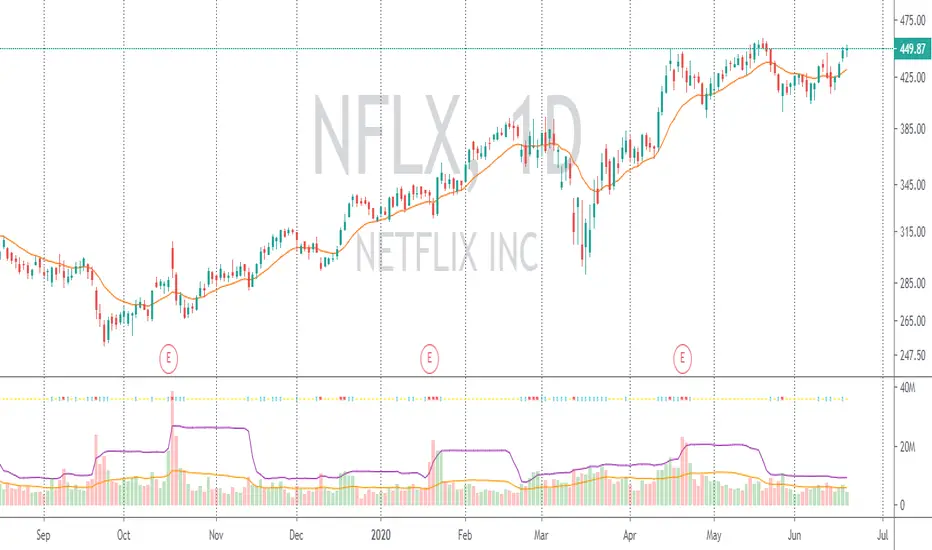
Volume Wave V.1.0Volume wave Indicator is an important tool in the Wyckoffian Analysis of the stocks. It helps to understand the changing / continuation of bullish and bearish sentiment or the Buying and selling pressure. It also helps to understanding the waxing and waning buying and selling pressure and forewarns the changing sentiment. Along with the Price wave it helps to understand the effort and result ratios and the consequent effect on the stocks.


Revistochmanic Wave İndicator Revistochmanic Wave is a stock tracking trends indicator & strategy for medium & long term investing.
Stochastic 34 period
smoothK 5 period (ema/red line)
smoothD 13 period (stochastic/black line)

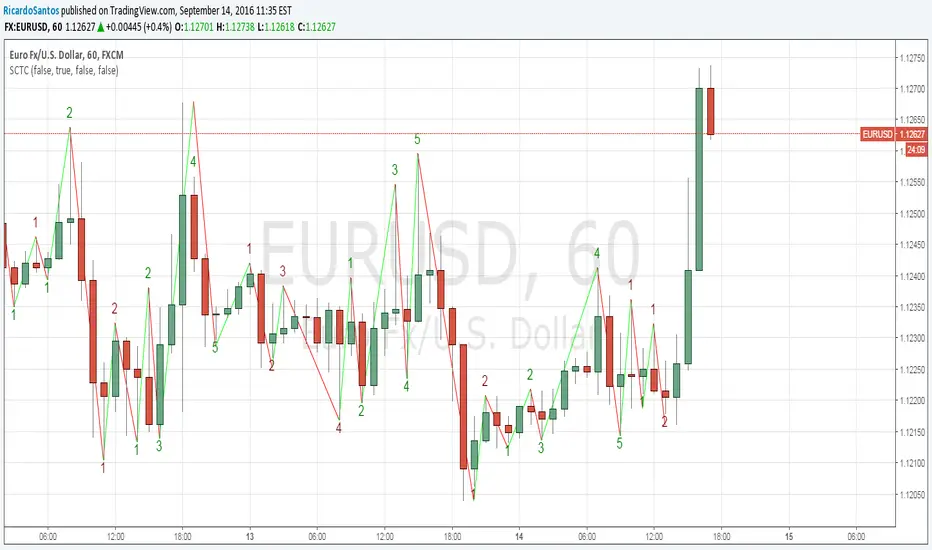
BullTrading Chaos Trend WaveHave you ever wonder how the Elliott Wave looks like?
If you trade with price action you are going to love this stuff... It is based on the same Mandelbrot Chaos Theory principles in order to trade with Bill Williams fractals. Chaos Trend Wave indicator displays in your chart the different Elliott wave layers making price action trading very intuitive.
The standard settings are 126, 1, 5, 21 displaying the immediate bigger wave from your current layer, display settings for your current layer and "balance point" are: 126, 1, 3, 13. Use Fib sequence in the last two numbers in order to correctly change between wave layers: 126, 1, 8, 34 and 126, 1, 13, 55 (This is the higher setting, it is very useful to spot and trade trending markets).

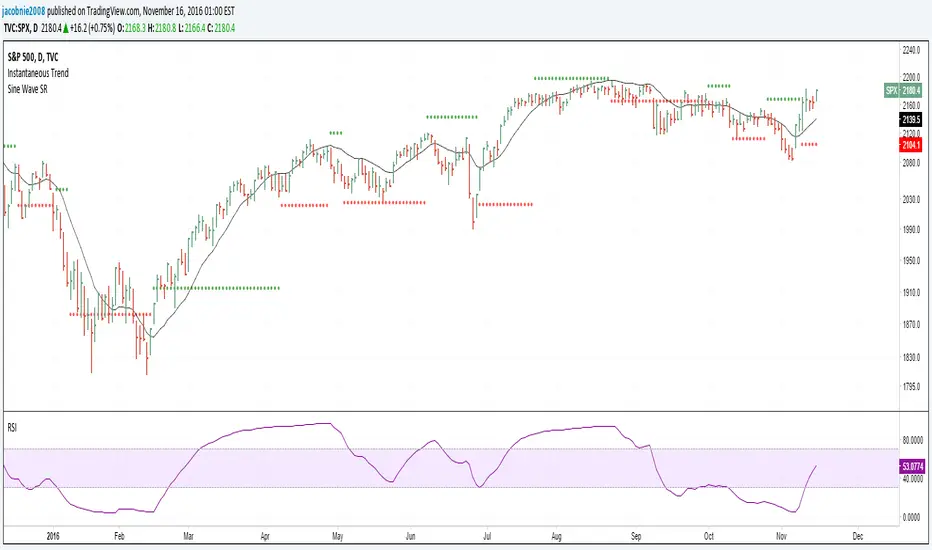
Hilbert Sine Wave Support and ResistanceSupport and Resistance plotted to match John Ehler's Hilbert Sine Wave
[RS]Swing Charts V0 Trend Counter V0EXPERIMENTAL:
wave counting using swing charts, use at your own discretion.
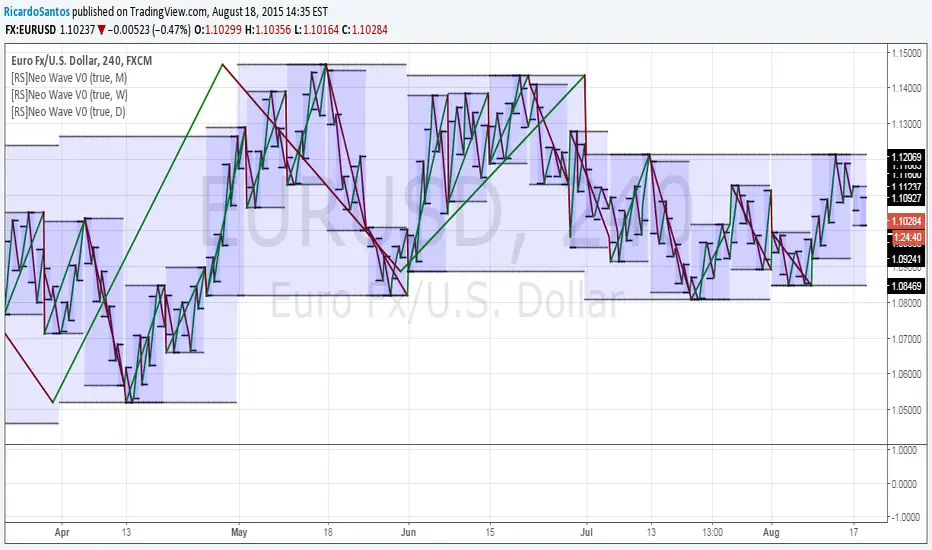
[RS]Neo Wave V0EXPERIMENTAL: Request for IvanLabrie.
Method for reading Neo Wave's.
note: some issues arent possible to work around/fix due to limitations in pinescript.
Indicators: Rainbow Charts Oscillator, Binary Wave and MAsRainbow Charts, by Mel Widner, is a trend detector. It uses recursively smoothed MAs (remember, this idea was proposed back in 1997 -- it was certainly cool back then!) and also builds an oscillator out of the MAs. Oscillator bands indicate the stability range.
I have also included a simple binary wave based on whether all the MAs are in an upward slope or not. If you see any value above 0.5 there, the trend is definitely up (all MAs pointing up).
More info:
www.traders.com
Here's my complete list of indicators (With these 3, the total count should be above 100 now...will update the list later today)

Candle Density Indicator_SH_v1This indicator visually highlights the price zones where candlesticks have most frequently passed, using box shapes.
Unlike a standard volume profile, it focuses soley on the areas most visited by candlestick bodies, displayed as gray boxes, and marks the highest and lowest prices within each zone. Additionally, it features a highlight function:
The number displayed inside the gray box represents the average trading volume of the most recent supply zone.
candlestick bodies that exceed the zone's average trading volume are emphasized in yellow.

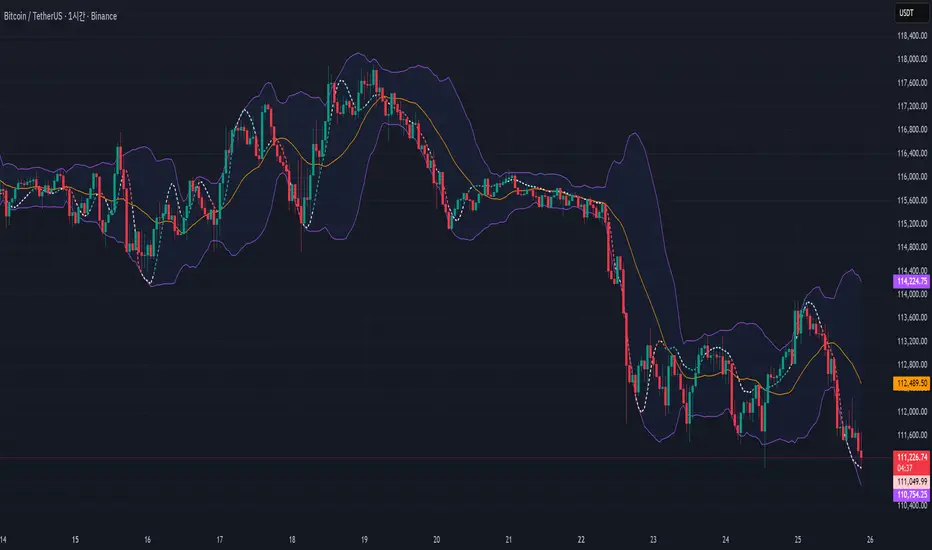
WaveMacBollI wanted to see the two indicators in the candle chart, not in a separate window. And within the Bollinger band, it seemed to put it fine.
Important Note on Line Styles
Due to TradingView's multi-timeframe environment restrictions (timeframe = '', timeframe_gaps = true), I couldn't implement dotted or dashed line styles programmatically. The indicator uses solid lines by default.
If you prefer dotted/dashed lines for better visual distinction:
Add the indicator to your chart
Click on the indicator settings (gear icon)
Go to "Style" tab
Manually change line styles for each plot
Unfortunately, PineScript doesn't support line.new() or similar drawing functions in multi-timeframe mode, limiting our styling options to basic plot styles.
If you know a good solution for implementing dotted/dashed lines in multi-timeframe indicators without using drawing objects, please share it in the comments! I'd love to improve this aspect of the indicator
20 Day Moving Average with Profit TargetsThis Pine Script indicator plots a 20-day simple moving average (SMA) on the chart and displays profit target labels relative to an initial buy price.
The script allows the user to input a custom buy price and calculates profit levels at 10%, 20%, 30%, and 50% above the buy price. Labels are shown on the last bar of the chart for each profit level and the buy price, with the labels offset to the right to avoid overlapping with the price action.
The labels are color-coded based on the profit levels, and the buy price label is blue.

Volume with SD+2Volume with SD+2
Volume with SMA20 and Standard Deviation +2
If Volume < SMA20 , mean Volume Low and less momentum.
If Volume > SMA20 and < SD2 , mean Volume Increase and more momentum.
If Volume > SD2 , mean Volume Climax , show strong trend but show reversal point in someitmes.

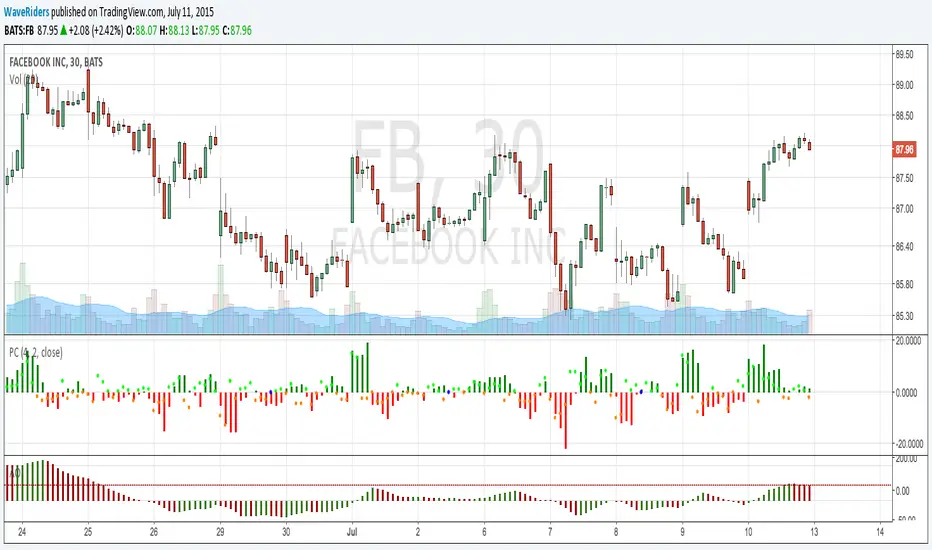
PriceCounterPrice Counter
Use to identify Price Short Term Trend By
PC = Present Close - 4 Previous Close
PC > 0 Show Value in Green bar
PC 0
Dot = Present Close - 2 Previous High
If PC = 0 or < 0
Dot = Present Close - 2 Previous Low
Indicator will Show momentum of price. PC bar is long mean price move fast .
PC bars are the same color continuously , mean price in trend.
PC bars are often flip color and small bar , mean price sideway and weak momentum.
The Zone Trades v1.0The Zone v.1.0
The Zone is mention in New Trading Dimensions by Bill Williams,PhD. The Zone is used for Entry Signal of Both Long and Short side.
Green Zone are painting Green Bars when Awesome Oscillator (AO) and Accelerater/Decelerator (AC) are both increasing.
Red Zone are painting Red Bars when Awesome Oscillator (AO) and Accelerater/Decelerator (AC) are both decreasing.
Gray Zone are painting Gray Bars AO and AC in difference changing. Gray Zone are indicate the indecision between bulls and bears.
Bill Williams, PhD. mention that Green Zone or Red Zone usually happen 6-8 bars Continuously.
The First Bar that change to be Green or Red color is the Signal Bar.
Entry Signal is the second bar in the same color as the Signal bar happen with Volume
Price go higher the high of previous Green Bar is Buy Signal. Entry Buy (Long) and place Stop at 1 tick lower the Low of previous bar.
Price go ;ower the Low of previous Red Bars is Sell Signal. Entry Sell (Short) and place Stop at 1 tick higher the High of previous bar.
Do not Entry if Green Bars or Red Bars completed 5 bars continuously.


🦶🦶 VuManCraigThis script is a community-driven recreation of the popular VMC/Decipher B divergence tool.
Full credit and thanks go to the original authors and contributors from the original indicator comments — this version simply brings the same logic into a cleaner, more customizable format, with default settings adjusted to reflect Craig the Educator’s trading setup.
Features
Detects bullish & bearish divergences on the VMC/Decipher B waveform
Automatic label plotting for clear visual signals
Default parameters tuned to match Craig the Educator’s preferred setup
Adjustable lengths, thresholds and smoothing
Optional oscillator visibility toggles
Alerts for divergence confirmations
Lightweight and optimised for intraday or swing-trading use

Test shift level strategyTesting this on all timelines where in it checks the candle color and takes call to buy or sell

brrr on $ indicator 𐤀it is an indicator that brrr's too but this one only brrr's on $.
ppl want know more about $ but thats all. it just brrr's $
sometimes it brrr's $ sometimes it wont. but wen it brrr's $ it really brrr's $.
brrr

brrr indicator 𐤀its an indicator that brrr's.
ppl want know more about but thats all. it just brrr's
sometimes it brrr's sometimes it wont. but wen it brrr's it really brrr's.
brrr

RSI with SMA + 70/60/50/40/30 LevelsIndicator Name:
RSI with SMA + 70/60/50/40/30 Levels
🧩 Concept Overview:
यह indicator दो popular tools को combine करता है:
RSI (Relative Strength Index) – momentum indicator जो market ke overbought aur oversold zones ko identify karta hai.
SMA (Simple Moving Average) – trend smoother jo RSI ke movement ko average karke lagging confirmation deta hai.
इन दोनों के साथ 70, 60, 50, 40, और 30 की multiple reference lines draw की जाती हैं, ताकि trader को RSI ke swings aur reversals easily samajh aaye.
⚙️ Indicator Components:
RSI Line:
Default Period: 14 (customize kar sakte ho).
Show karta hai price momentum – agar RSI 70 ke upar jaata hai to market overbought zone me hota hai; agar 30 ke niche jaata hai to oversold zone me.
SMA on RSI:
RSI ka smooth version (usually 9-period SMA).
Trend confirmation ke liye – jab RSI line SMA ke upar cross karti hai to bullish signal, aur neeche cross kare to bearish signal.
Horizontal Levels:
70: Overbought zone (potential sell area).
60: Strong bullish momentum line (trend confirmation).
50: Neutral / midline (trend direction flip area).
40: Weak bearish zone (trend losing strength).
30: Oversold zone (potential buy area).
💡 How to Use:
Trend Identification:
RSI > 60 aur SMA ke upar → Bullish trend.
RSI < 40 aur SMA ke neeche → Bearish trend.
Reversal Spotting:
RSI 70 ke upar jaake wapas niche aaye → Sell signal.
RSI 30 ke neeche jaake wapas upar aaye → Buy signal.
Confirmation Using SMA:
RSI cross SMA from below → Confirmed bullish reversal.
RSI cross SMA from above → Confirmed bearish reversal.
