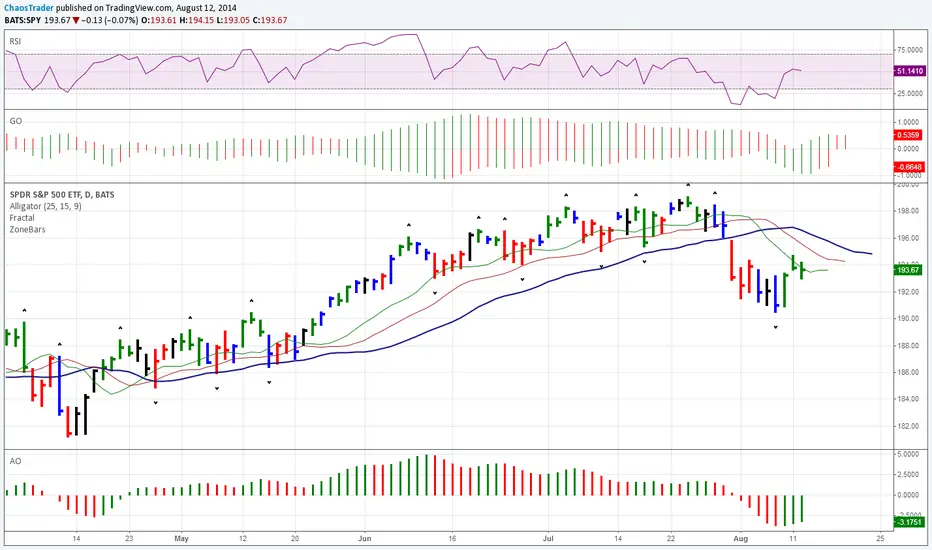
ZoneBarsBill Williams Zone and Squat Bars. See New Trading Dimensions by Bill Williams, PhD.
Bars are green (green zone) when the Awesome Oscillator and Accelerator/Decelerator are both positive.
Bars are red (red zone) when the Awesome Oscillator and Accelerator/Decelerator are both negative.
Bars are blue when a squat bar is formed, these indicate a battle between bulls and bears and often happen near trend continuation or trend changes.
Caution: Assumes chart is a bar chart - not a candle chart.
Caution: Squat bars are accurate only with official exchange volume data - BATS data will give false squat bars.
Tìm kiếm tập lệnh với "williams"
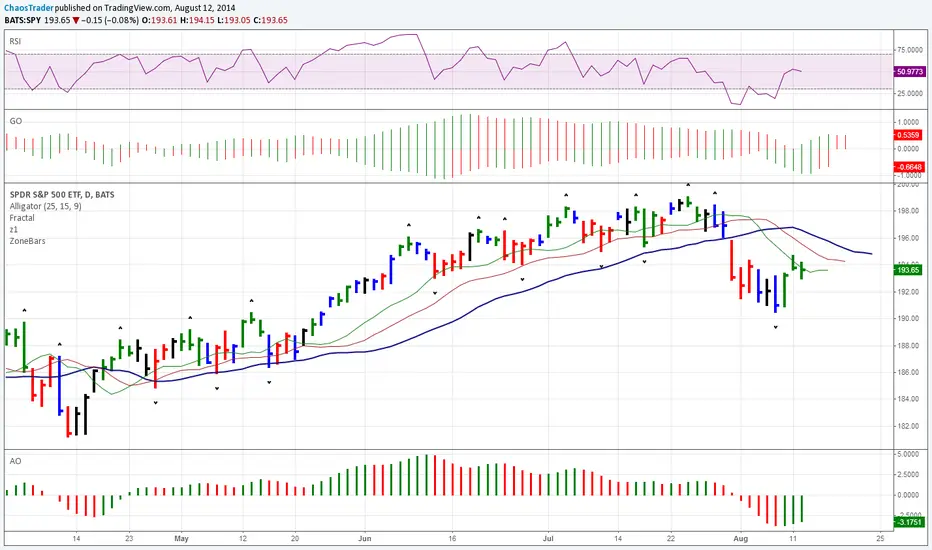
ZoneBarsBill Williams Zone and Squat Bars. See New Trading Dimensions by Bill Williams, PhD.
Bars are green (green zone) when the Awesome Oscillator and Accelerator/Decelerator are both positive.
Bars are red (red zone) when the Awesome Oscillator and Accelerator/Decelerator are both negative.
Bars are blue when a squat bar is formed, these indicate a battle between bulls and bears and often happen near trend continuation or trend changes.
Caution: Assumes chart is a bar chart - not a candle chart.
Caution: Squat bars are accurate only with official exchange volume data - BATS data will give false squat bars.
ZoneBarsBill Williams Zone and Squat Bars. See New Trading Dimensions by Bill Williams, PhD.
Bars are green (green zone) when the Awesome Oscillator and Accelerater/Decelerator are both positive.
Bars are red (red zone) when the Awesome Oscillator and Accelerater/Decelerator are both negative.
Bars are blue when a squat bar is formed, these indicate a battle between bulls and bears and often happen near trend continuation or trend changes.
Caution: Assumes chart is a bar chart - not a candle chart.
Caution: Squat bars are accurate only with official exchange volume data - BATS data will give false squat bars.

Willy BandsReverse engineered Willy21Ema13 to show (on chart) the levels price would have to reach to be overbought/oversold given recent price history.
By default it only shows the Williams%R with length 21.
If you change the settings it will do the same for the Ema13 of the Willy21, however because the ema is "harder" to breach, the lines are much farther away and looks really obnoxious on chart.

Vince/Williams Market Internals SuiteThis indicator is a powerhouse combination of three distinct market internal strategies developed by Ralph Vince and Larry Williams. Instead of using three separate scripts to monitor market health, this tool consolidates them into a single dashboard that analyzes NYSE "New Lows" data to detect structural rot, capitulation, and crash risks.
The first component is the Volatility Vulnerability monitor, which identifies when the market structure is decaying. It looks for an extended period where the number of New Lows fails to drop to negligible levels. If you see an Orange Circle while price is above the 50 SMA, it is a major warning that the uptrend is hollow and prone to a crash. Conversely, a Blue Circle below the 50 SMA suggests the weakness is already priced in, offering a contrarian entry signal.
The second component is the Selling Climax signal. This identifies moments of pure terror where New Lows hit extreme levels (default 20%). The script marks these panic days with Orange Diamonds, but the real value is the Green Diamond that appears immediately when the panic subsides, often signaling a sharp V-bottom.
Finally, the Bloodbath Rule runs in the background as a defensive filter. When the background turns red (marked by a Red Cross), it means New Lows have breached the "danger" threshold (default 4%). During these periods, internal selling pressure is accelerating, and you should strictly avoid entering new long positions until the background clears.
Note: This script relies on broad market data (ADVN/DECN/LOWN) and works best on Daily timeframes.

Vince/Williams Selling Climax SignalThis indicator identifies moments of ultimate market capitulation based on the "Selling Climax" research by Ralph Vince and Larry Williams. It monitors the ratio of New Lows to total traded issues to detect when selling pressure has reached an unsustainable, panic-driven extreme (defaulting to 20% of the entire market hitting new lows).
The script visualizes this process in two stages. First, it marks the actual days of panic with red diamonds, showing you where the "washout" is occurring. Second, and most importantly, it generates a green diamond buy signal on the very first day the panic subsides. This allows you to enter a position immediately after the supply of desperate sellers has been exhausted, often catching the absolute bottom of a sharp correction.

Vince/Williams Extreme Volatility VulnerabilityDescription: This indicator implements the "Period of Extreme Vulnerability" concept developed by Ralph Vince and Larry Williams. The theory posits that a healthy market must regularly see the number of New Lows "dry up" (drop to near zero). When the percentage of New Lows fails to drop below a minimal threshold (default 0.15%) for a prolonged period (default 65 days), it indicates that internal market structure is rotting even if prices are rising, leaving the market fragile and prone to sudden volatility shocks.
I have programmed this script to track that exact condition—the extended absence of a "low" New Lows reading. It applies a 50-day Moving Average filter to contextually categorize the signal:
Red Dot (Crash Warning): Triggers when the vulnerability period begins while the price is above the 50 SMA. This is the classic warning signal, indicating that an uptrend is unsupported by market internals and a sharp correction may be imminent.
Green Dot (Contrarian Buy): Triggers when the vulnerability period begins while the price is below the 50 SMA. The script identifies this as a potential capitulation or value point where the persistent internal weakness is likely already priced in.
Note: This indicator requires exchange-wide data (New Lows, Advancers, Decliners) to function. It is best used on daily timeframes.

3C FractalsIts based on Williams Fractals indicator, but instead of using 5 candles to mark the fractals, it uses only 3.

Fractal Pattern AnalysisFractal Pattern Key Elements and How to Read Them
1. Williams Fractals (Triangle Markers)
Red Triangles Pointing Down: Bearish fractals - potential resistance points and selling opportunities
Green Triangles Pointing Up: Bullish fractals - potential support points and buying opportunities
When to Act: Look for bullish fractals forming during uptrends and bearish fractals during downtrends
2. Moving Averages
Yellow Line (20 EMA): Short-term trend
Blue Line (50 EMA): Medium-term trend
Red Line (200 EMA): Long-term trend
Interpretation: When shorter MAs cross above longer MAs, it's bullish; when they cross below, it's bearish
Key Signal: The alignment of all three MAs (stacked in order) confirms a strong trend
3. Background Color
Green Background: Uptrend (all MAs aligned bullishly)
Red Background: Downtrend (all MAs aligned bearishly)
Yellow Background: Sideways/neutral market (MAs not clearly aligned)
4. Market Structure Markers (Small Circles)
Green Circles: Higher highs and higher lows (bullish structure)
Red Circles: Lower highs and lower lows (bearish structure)
Pattern Recognition: Multiple green circles suggest continuing uptrend; multiple red circles suggest continuing downtrend
5. Reversal Diamonds ("Rev" Markers)
Yellow Diamonds: Potential trend reversal points
Usage: These mark where the current trend might be changing direction
Confirmation: Wait for price to close beyond the diamond before acting
6. Bollinger Bands (Blue Lines with Fill)
Middle Band: 20-period SMA
Upper/Lower Bands: Volatility channels
Signals: Price touching upper band in uptrend is strength; touching lower band in downtrend is weakness
Squeeze: When bands narrow, expect a volatility breakout soon
7. Status Table (Top Right)
Shows current trend, volume direction, and overall signal at a glance
"BUY" signal appears when multiple bullish conditions align
"SELL" signal appears when multiple bearish conditions align

[JL] How Many Signals last N barsGot this idea after I found Multiple Indicators Screener from QuantNomad.
This script learnt some codes from QuantNomad's great script. Thanks to him.
------------------------------------------------------------------------------------------------------------------------------------------------------------------------
This table show how many signals happened during the last N bars.
I only take care Forex, so this table only has 28 symbols. Feel free to change it.
Calculate the following signals:
RSI cross over/under 50
Short Moving average cross over/under long moving average
Stochastic k cross over/under d
MACD hist cross over/under 0
Williams Fractals: Up and Down fractals happened.
The concept is simple: Range period will always happen more cross signals than the trend period.
When the counter is less than median of all symbols, will be set green color. So more green mean more chance to be trend.

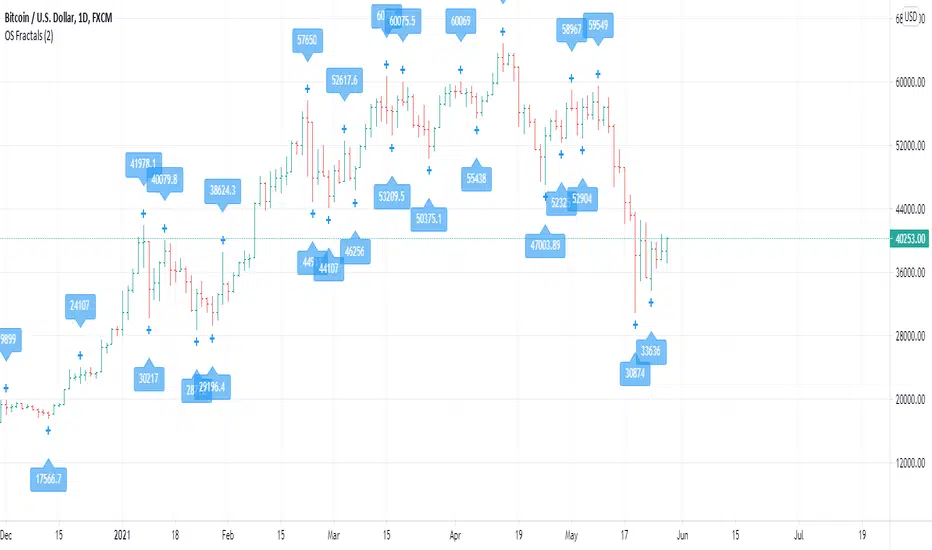
OS FractalsAn up fractal is formed when a high is both preceded and followed by lower highs. A down fractal is formed when a low is both preceded and followed by higher lows.
Bill Williams uses a period of 2 (2 after and 2 before) to define a fractal. This indicator has 2 as default but lets you decide the range you want.
The indicator lets you also select alerts when price crosses an up of down fractal, which would usually mean to entry a position. This indicator works best when used with an alligator, as long signals are valid above the Balance Line and short signals are valid when triggered below the Balance Line.
Any comments for improvement are welcome.
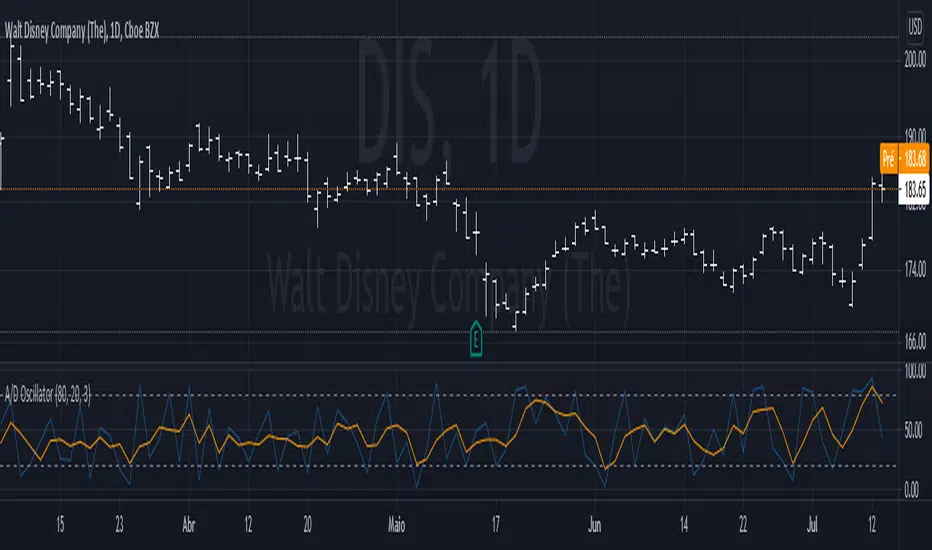
Waters-Williams A/D OscillatorThis is the A/D oscillator, design by Jim Waters and Larry Williams. As any other oscillator, it measures the strength of the buy and sell pressure.
If a candle opens at the low, and closes at it's high, the signal given by the oscillator is 100. If it opens at high and closes at low, the signal will be 0. Since it completely disregard other values, it is common to use a smoothed version of it, which is the average of the last n values, just like the stochastic oscillator.
Tho it doesn't have much use for positioners or swing traders, day traders and scalpers can use it in confluence with volume to enter in a counter trend trade.
Deep_Fractal_Signals_and_Rubber_Band_TradesThis indicator is based on Williams Fractals and the TopDog Trading "Rubber Band Trade"
The Deep Fractal Signals are triangles that indicate the price is forming a pattern of decreasing lows in a down trend (orange) or, increasing highs in an up trend (green).
The triangles are placed above or below the last bar of the pattern, unlike Fractals which are drawn 2 candles prior to the current candle, and are re-painted on the chart.
When the triangle is indicated above the moving average in a down trend (blue), or below the moving average in an up trend (yellow), this is a Rubber Band Trade.
When the slope of the moving average is less than the Gain set by the user, or are counter-trend, the triangles are plotted in silver.
When used in conjunction with the Power Analyzer indicator, a signal to the long side should be taken when the Power Analyzer momentum indicator is at a cycle low. Similarly, a signal to the short side should be taken when the indicator is at a cycle high.
The first, second or third signal in a new trend have the highest probability of a follow through.
The indicator sometimes gives a false signal at the very end of the trend, just before the market reverses. This is an attempt by the Market Makers to persuade traders that the trend will continue.
Please leave a comment and "Like" this indicator if you find it useful.
FX Engineering

Zenith BladeThis script is based heavily on "Support/Resistance Zones x3" by Lij_MC
What I did is went and added alerts for when price breakouts the support line/zone.
You have the options to change if it is based on a zone breakout or a line breakout
You also can choose when it will go off, so for example you want an alert to trigger only between 7am and 8am then you can change that in the menu.
Lastly you can choose whither or not to show the Williams Alligator on the chart as I have found it beneficial in conjunction with the script since its based primarily on fractals to calculate Support and Resistance.

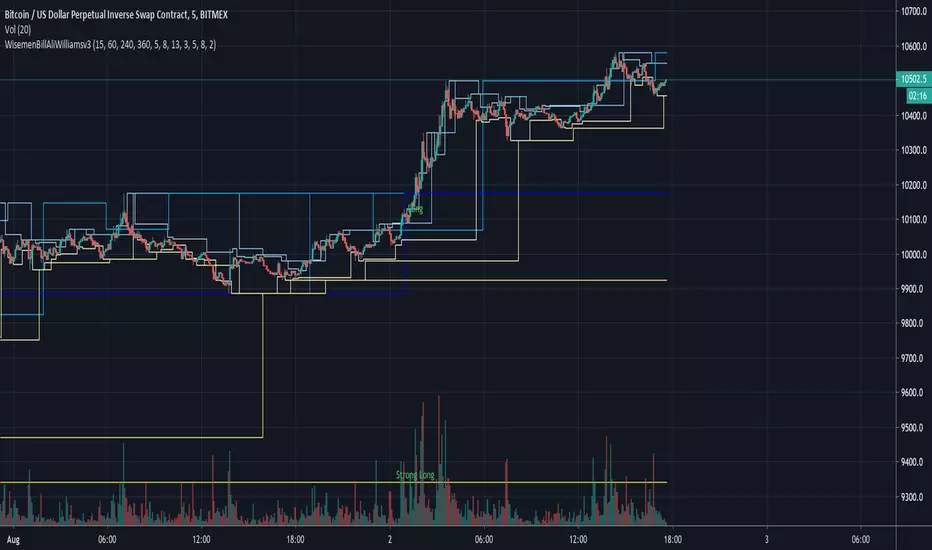
Wisemen Bill Ali Williams v3Use 2 timeframe:
Current timeframe + configurable timeframe (default: 6hours)
Get resistance & support for both timeframe.
Entry when breakout both resistance or both support
For donations
BTC: 3E7rUPX7upS8iTj42JdLt7keJVbJLfvMoH
ETH: 0x094ed88e4c5a9b225e936586cbc2d61f4a027f68
Thank you & happy trading!

Setup linha da Sombra - Larry WilliamsHi trader, it script were based on dual 10 EMA Trade System from Professional Trader e Autor Larry Williams.
Based on crossing ema, after a leg down, when 10ema crossover 10ema deslocated 1 bar to the right, we have the sign to buy, and after a leg up, when the 10ema crossunder we have the sign to sell.
Remember Volume confirm price/trend.
Enjoy ;)

Larry Williams 9.3 [zauoyds]This script was made to find in real time the setup 9.3, made by trader Larry Williams.
This indicator just help to find the entries described by setup 9.3.
You need to know the setup and use this indicador as helper.
The indicator shows when the 9.3 is configured. The trigger to go long is the next candle high is higher than previus candle high. To go short, the low needs to be lower than previus low.

Larry Williams 9.2 [zauoyds]This script was made to find in real time the setup 9.2, made by trader Larry Williams.
This indicator just help to find the entries described by setup 9.2.
You need to know the setup and use this indicador as helper.
The indicator shows when the 9.2 is configured. The trigger to go long is the next candle high is higher than previus candle high. To go short, the low needs to be lower than previus low.

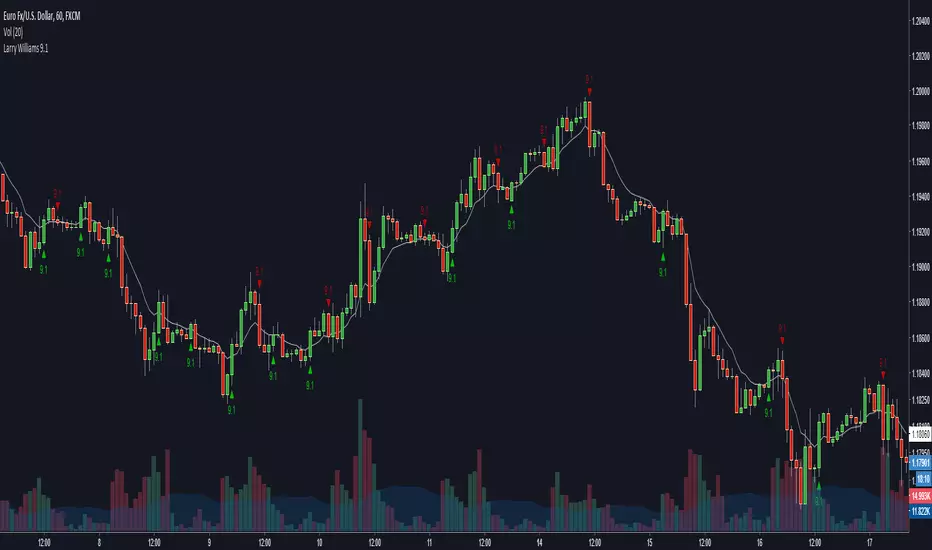
Larry Williams 9.1 [zauoyds]This script was made to find in real time the setup 9.1, made by trader Larry Williams.
This indicator just help to find the entries described by setup 9.1.
You need to know the setup and use this indicador as helper.
The indicator shows when the 9.1 is configured. The trigger to go long is the next candle high is higher than previus candle high. To go short, the low needs to be lower than previus low.
Fractal BreakoutFirst of all, huge credit to synapticEx , whose brilliant use of the security function inspired me to figure out a way to get quasi-shape boundaries automatically drawn on a chart.
This study draws upper and lower trend lines, based on configurable fractal*** reversal detection, calculates slope from the last two upper or lower reversal points, and then extends a dotted line along the same slope...until the next upper (or lower) reversal occurs. If the high (or low) breaks this extension, the dotted line becomes solid to aid visibility. Reversal detection is configurable to use any number of ticks, but probably four to eight will work best.
I made the inclusion of volume in the reversal logic optional (off by default) and left the existing SMA input found in synapticEx's code intact, albeit with a lower default. With the addition of trend lines, I found volume hindered identification of reversals, although I could try various other filters than the SMA included originally.
I have also left intact the very nice ability to change the period and use the requested period identify reversals, courtesy of synapticEx.
This could be used in a strategy, as the values plotted are actual values that are available to include in logic and do not include knowledge of the future. However , information is not available until the floor of half the number of ticks used in reversal detection (I then offset by that number to line things up visually). Having never heard of it until now, I just Googled the Bill Williams Alligator strategy, which looks interesting, so maybe I could see how this could be ported to that.
***As I typed this, I remembered that while making reversal detection configurable, I changed the detection logic simply to look for highest (or lowest) of the desired length of ticks. I don't know whether this is not strictly fractal anymore, but if desired, with a little work, I could make it require consecutive, consistent changes before and after each reversal again.
Here are a few screenshots from hourly ticks, using the "current" (hourly) period, with and without volume, and playing with the number of points used to identify reversals.
Not using volume
Using volume
Larry Williams Bonus Track PatternThis strategy trades the day immediately following an Inside Day, under specific directional and timing conditions. It is designed for daily-based setups but executed on intraday charts to ensure orders are placed exactly at the open of the following day, rather than at the daily bar close.
Entry Conditions
Only trades on Monday, Thursday, or Friday.
The previous day must be an Inside Day (its high is lower than the prior high and its low is higher than the prior low).
The bar before the Inside Day must be bullish (close > open).
On the following day (t):
The daily open must be below both the Inside Day’s high and the highest high of the two days before that.
A buy stop is placed at the highest high of the three previous days (Inside Day and the two days before it).
If the new day’s open is already above that level (gap up), the strategy enters long immediately at the open.
Exit Rules
Stop Loss: Fixed, defined in points or percentage (user input).
FPO (First Profitable Open): the position is closed at the first daily open after the entry day where the open price is above the average entry price (the first profitable open).
Notes
The script must be applied on an intraday timeframe (e.g., 15-minute or 1-hour) so that the strategy can:
Detect the Inside Day pattern using daily data (request.security).
Execute orders in real time at the next day’s open.
Running it directly on the daily timeframe will delay executions by one bar due to Pine Script’s evaluation model.

Bloodbath IndicatorThis indicator identifies days where the number of new 52-week lows for all issues exceeds a user-defined threshold (default 4%), potentially signaling a market downturn. The background of the chart turns red on such days, providing a visual alert to traders following the "Bloodbath Sidestepping" strategy.
Based on: "THE RIPPLE EFFECT OF DAILY NEW LOWS," By Ralph Vince and Larry Williams, 2024 Charles H. Dow Award Winner
threshold: Percentage of issues making new 52-week lows to trigger the indicator (default: 4.0).
Usage:
The chart background will turn red on days exceeding the threshold of new 52-week lows.
Limitations:
This indicator relies on historical data and doesn't guarantee future performance.
It focuses solely on new 52-week lows and may miss other market signals.
The strategy may generate false positives and requires further analysis before trading decisions.
Disclaimer:
This script is for informational purposes only and should not be considered financial advice. Always conduct your own research before making any trading decisions.
