Adaptive MA constructor [lastguru]Adaptive Moving Averages are nothing new, however most of them use EMA as their MA of choice once the preferred smoothing length is determined. I have decided to make an experiment and separate length generation from smoothing, offering multiple alternatives to be combined. Some of the combinations are widely known, some are not. This indicator is based on my previously published public libraries and also serve as a usage demonstration for them. I will try to expand the collection (suggestions are welcome), however it is not meant as an encyclopaedic resource, so you are encouraged to experiment yourself: by looking on the source code of this indicator, I am sure you will see how trivial it is to use the provided libraries and expand them with your own ideas and combinations. I give no recommendation on what settings to use, but if you find some useful setting, combination or application ideas (or bugs in my code), I would be happy to read about them in the comments section.
The indicator works in three stages: Prefiltering, Length Adaptation and Moving Averages.
Prefiltering is a fast smoothing to get rid of high-frequency (2, 3 or 4 bar) noise.
Adaptation algorithms are roughly subdivided in two categories: classic Length Adaptations and Cycle Estimators (they are also implemented in separate libraries), all are selected in Adaptation dropdown. Length Adaptation used in the Adaptive Moving Averages and the Adaptive Oscillators try to follow price movements and accelerate/decelerate accordingly (usually quite rapidly with a huge range). Cycle Estimators, on the other hand, try to measure the cycle period of the current market, which does not reflect price movement or the rate of change (the rate of change may also differ depending on the cycle phase, but the cycle period itself usually changes slowly).
Chande (Price) - based on Chande's Dynamic Momentum Index (CDMI or DYMOI), which is dynamic RSI with this length
Chande (Volume) - a variant of Chande's algorithm, where volume is used instead of price
VIDYA - based on VIDYA algorithm. The period oscillates from the Lower Bound up (slow)
VIDYA-RS - based on Vitali Apirine's modification of VIDYA algorithm (he calls it Relative Strength Moving Average). The period oscillates from the Upper Bound down (fast)
Kaufman Efficiency Scaling - based on Efficiency Ratio calculation originally used in KAMA
Deviation Scaling - based on DSSS by John F. Ehlers
Median Average - based on Median Average Adaptive Filter by John F. Ehlers
Fractal Adaptation - based on FRAMA by John F. Ehlers
MESA MAMA Alpha - based on MESA Adaptive Moving Average by John F. Ehlers
MESA MAMA Cycle - based on MESA Adaptive Moving Average by John F. Ehlers, but unlike Alpha calculation, this adaptation estimates cycle period
Pearson Autocorrelation* - based on Pearson Autocorrelation Periodogram by John F. Ehlers
DFT Cycle* - based on Discrete Fourier Transform Spectrum estimator by John F. Ehlers
Phase Accumulation* - based on Dominant Cycle from Phase Accumulation by John F. Ehlers
Length Adaptation usually take two parameters: Bound From (lower bound) and To (upper bound). These are the limits for Adaptation values. Note that the Cycle Estimators marked with asterisks(*) are very computationally intensive, so the bounds should not be set much higher than 50, otherwise you may receive a timeout error (also, it does not seem to be a useful thing to do, but you may correct me if I'm wrong).
The Cycle Estimators marked with asterisks(*) also have 3 checkboxes: HP (Highpass Filter), SS (Super Smoother) and HW (Hann Window). These enable or disable their internal prefilters, which are recommended by their author - John F. Ehlers. I do not know, which combination works best, so you can experiment.
Chande's Adaptations also have 3 additional parameters: SD Length (lookback length of Standard deviation), Smooth (smoothing length of Standard deviation) and Power (exponent of the length adaptation - lower is smaller variation). These are internal tweaks for the calculation.
Length Adaptaton section offer you a choice of Moving Average algorithms. Most of the Adaptations are originally used with EMA, so this is a good starting point for exploration.
SMA - Simple Moving Average
RMA - Running Moving Average
EMA - Exponential Moving Average
HMA - Hull Moving Average
VWMA - Volume Weighted Moving Average
2-pole Super Smoother - 2-pole Super Smoother by John F. Ehlers
3-pole Super Smoother - 3-pole Super Smoother by John F. Ehlers
Filt11 -a variant of 2-pole Super Smoother with error averaging for zero-lag response by John F. Ehlers
Triangle Window - Triangle Window Filter by John F. Ehlers
Hamming Window - Hamming Window Filter by John F. Ehlers
Hann Window - Hann Window Filter by John F. Ehlers
Lowpass - removes cyclic components shorter than length (Price - Highpass)
DSSS - Derivation Scaled Super Smoother by John F. Ehlers
There are two Moving Averages that are drown on the chart, so length for both needs to be selected. If no Adaptation is selected ( None option), you can set Fast Length and Slow Length directly. If an Adaptation is selected, then Cycle multiplier can be selected for Fast and Slow MA.
More information on the algorithms is given in the code for the libraries used. I am also very grateful to other TradingView community members (they are also mentioned in the library code) without whom this script would not have been possible.
Tìm kiếm tập lệnh với "wind+芯片行业+市盈率+财经数据"

Indicators & Conditions Test Framework [DTU]Hello All,
This script is a framework to build strategies by combining indicators and conditions (long, short, exits). You are able to analyze your strategies in realtime by changing the input parameters related to indicators, conditions and their combinations.
OVERVIEW
With this Study/Strategy framework, you will be able to create strategy conditions, display them on the chart, and test them using existing indicators as well as external and custom indicators that you can add.
The main purpose of the Framework is to choose your indicators to be used in the conditions and test your strategy by producing your "Long, short, Exit long, Exit short" combinations.
Although may be, it can be a bit difficult and complicated at first start, but you can understand the logic on its use in a very short time.
Notes:
I removed external links off descriptive images and video to be comply with Trading view violation House Rules
Since I am new in the community and still trying to understand the pine script language I can make errors and violations on my script. Please Inform me on any issue that I made..
HOW TO
STEP 1: SETTINGS ______________________________________________________________________________________________________
SOURCE, TIMEFRAME, SECURITY
Select the Source, timeframe and Secure type that your indicators will use.
Here, the Secure entry consists of 3 parts and the f_security function is used to determine it.
a)Secure
This option is defined as reducing repaint in tradingview calculations as much as possible. The following function is used.
request.security(_symbol, _res, _src , lookahead=barmerge.lookahead_on)
b)Semi Secure
While this option can reduce repaint in tradingview calculations as much as possible, it is less secure. The following function is used.
request.security(_symbol, _res, _src )
c)Repaint
This option turns on the repaint feature. The following function is used.
request.security(_symbol, _res, _src ) : na
Ind Source:
You can the source that indicators will use their own calculations
Ext Source:
You can import external Indicator sources from here . It appears on condition/combination area as "EXT".
To export the External indicator plot it with a title. It will be visible in source dropdown input
PERIOD , ALERTS...
Period:
Determine your strategy testing period by selecting start and end date/time
(!!! According to your tradingview subscription, it takes the last 5000, 10000.. bars.
The extra bar option may cause problems such as not appearing in the calculations or errors).
Plot Alerts:
Plot condition result as alerts arrows on the chart's bottom for "LONG" and the top for "SHORT" entries, exits
Close on opposite:
When selected, a long entry gets closed when a short entry opens and vice versa
Show Profit:
It appears if script is in strategy mode (not in study) this can display current or open profit for better reanalyzing your strategy entry exit points. (Currently under development)
PLOT TYPE OPERATIONS
This option has 4 entries
a) Mult
Sets the multiplier for the selected Plot Type (stochastic, Percentrank, Org Range (-1,1) ) except for "Original" in the range (-1,1).
EXAMPLE: When 1000 is selected, the indicator in the range of (-1,1) will appear in the range of (-1000, 1000) on the screen.
b) Shift
It determines the shift that will appear on the screen for the selected Plot Type (stochastic, Percentrank,Org Range (-1,1) ) in the range (-1,1) other than "Original".
EXAMPLE: When Shift:35000 and mult:1000 are selected, the indicator will appear in the range (34000, 36000) on the screen.
c) Smooth
This option (only for Stochastic & PercentRank) allows to smooth the indicator to be displayed.
Here, tradinview ta.swma function is used.
b) hline
Adjusts the horizontal lines to appear on the screen according to the mult factor for the range (-1,1)
The lines represent the values (-1, -05, 0, 05, 1)
STEP 2: INDICATORS ______________________________________________________________________________________________________
You need to choose indicators that you can use in strategy conditions.
Here, the indicators come from the dturkuler/lib_Indicators_DT open script library defined in the code
In addition, you can add the indicators that you will create in the area defined in the code to this list..
You can also import external indicators and test them with other variables on the system..
You can choose a maximum of 5 indicators that you can use in total. (can be increased in new versions)
Indicators are categorized in 3 main sections
Indicator Selection:
You can select your indicators from this area
a)Moving Averages
These are indicators such as EMA, SMA that you can show on the stock. They come from the library.
These indicators are fed from Settings/source. Only the length value can be used as a parameter.
In addition, line colors can be changed..
As of now, there are 28 indicators in the library in total and 5 indicators are left as future use for this field for now.
b)Other Indicators
These are different indicators from the stock value such as RSI, COG. They come from the library. These indicators are fed from Settings/source.
Only the length value can be used as a parameter. In addition, line colors can be changed.
As of now, there are 24 indicators in the library in total and 5 indicators are left as a future use for this field for now.
c)Custom Indicators
These indicators are the ones you can create by programming yourself in the source code..
The area at the bottom of the settings screen is reserved for the parameters of this type of indicators.
Indicator Length:
You can update your selected indicator length value from here. (Not: it doesn't work for custom indicators since they have their parameter on cust. Ind. input screen )
Indicator Plot Type:
Next to the indicators, there is an input selection field about how they will be displayed on the screen.
a)Original
The indicator is displayed on the screen with its current values. It is an ideal solution for displaying moving average indicators such as (EMA, SMA) over current stock.
Since the values of indicators such as (RSI, COB) are low (-100,100 : -1.1), they appear at the bottom of the screen and make analysis difficult.
For this reason, other options may be more suitable for these.
b)Stochastic
The indicator is displayed on the screen with stochastic calculation in the range of -1.1.
It uses the stochastic(50) calculation method to spread indicators such as (RSI, COB) over the range (-1,1).
Indicators in this selection can be fixed and monitored under stock on the screen with the parameters under the Plot Type section.
You can see the original values of the relevant indicator on the Data Window screen.
(!!! Do not use the values on the chart in your condition calculations. Instead, get the values from Data Window)
c)PercentRank
The indicator is displayed on the screen with stochastic calculation in the range of -1.1. .
Since the values of indicators such as (RSI, COB) are low (-100,100 : -1.1), they appear at the bottom of the screen and make analysis difficult.
Indicators in this selection can be fixed and monitored under stock on the screen with the parameters under the Plot Type section.
You can see the original values of the relevant indicator on the Data Window screen
((!!! Do not use the values on the chart in your condition calculations. Instead, get the values from Data Window)
d)Org Range (-1,1)
If your indicator is in the range of -1.1, your indicator will be displayed on the screen with its original calculation in the range of -1.1.
Indicators in this selection can be fixed and monitored under stock on the screen with the parameters under the Plot Type section.
You can see the original values of the relevant indicator on the Data Window screen.
(!!! Do not use the values on the chart in your fitness calculations. Instead, get the values from Data Window)
STEP 2 NOTES:
STEP 3: CONDITIONS ______________________________________________________________________________________________________
After choosing the indicators you will use in the conditions, you move on to the "CONDITIONS" section.
There are 4 conditions type here.
• LONG ENTRY CONDITION
• SHORT ENTRY CONDITION
• LONG CLOSE CONDITION
• SHORT CLOSE CONDITION
The use of each condition is the same.
There are 3 combinations you can use in each condition. (can be increased in new versions)
a)COMBINATIONS
There are 3 combinations you can use in each condition. (can be increased in new versions)
Each combination are build from 4 parts
1)1st Indicator
If set to "NONE" this combination will not be used on calculations. You can select
IND1-5: from indicators (See above),
EXT: value from externally imported indicator
Stock built-in values: close, open...
2)Operator
Selected Operator compares 1st Indicator with the 2nd one. You can select different operators such as
crossover, crossunder, cross,>,<,=....
3)2nd Indicator
This indicator will be compared with the 1st one via selected Operator. You can select
IND1-5: from indicators (See above),
VALUE: a float value defined in the combinations value parameter
EXT: value from externally imported indicator
Stock builtin values: close,open...
4)Value
When the 2nd indicator field is "VALUE", value area compares the entered value.
ex: 1st indicator="open", op=">", 2nd indicator="VALUE", value=3000.12 means is(close>3000.12)
In other conditions, it compares the previous values of the indicator.
ex: 1st indicator="open", op=">" 2nd indicator is "close" and value is 2 means is(open>close )
EXAMPLES:
indicator 1= "IND1", Operator=">", indicator 2= "IND2" => is(IND1>IND2)
indicator 1= "IND1", Operator=">", indicator 2= "VALUE", "0.1" => is(IND1>0.9)
indicator 1= "IND2", Operator="crossover", indicator 2= "IND1" => is(IND2 crossover IND1) : like a=ta.crossover(IND2, IND1)
indicator 1= "IND1", Operator="<", indicator 2= "close" => is(IND1>close)
indicator 1= "IND1", Operator="<", indicator 2= "EXT" => is(IND1>EXT) , EXT mean external imported indicator that define on settings section
indicator 1= "IND1", Operator="<", indicator 2= "IND1", Value="1" => is (IND1>IND1 )
b)JOIN COMBINATIONS
Each combination in Condition is compared with the next one via JOIN operator
The join operator can be selected as AND or OR.
Examples:
1st combination= is(IND1>0.9) true
2nd combination= is(IND2 crossover IND1) false
1st combination "AND" 2ndcombination" => false (is(IND1>0.9) AND is(IND2 crossover IND1))
1st combination "OR" 2nd combination" => true (is(IND1>0.9) OR is(IND2 crossover IND1))
STEP 3 NOTES:
When the 2nd indicator field is "VALUE", value area compares the entered value. In other conditions, it compares the previous values of the indicator.
In cases where "VALUE" is not selected, integer values must be entered in this field. (float should not be entered. ie 1, 2 should be entered)
!!!If the 1st indicator is "NONE" in the combination, that combination is cancelled.
Each combination returns true/false, allowing the selected value to be compared with another value
Example: EMA(21)>EMA(50) returns true under all conditions or (EMA(21) crossover EMA(50)) returns true when passed.
You can use , Value of 5 indicators (IND1-IND5) or (VALUE) that you have defined in combinations or import indicator (EXT) or stock values (close, open, high...) in your calculations.
combination Compares the 1st indicator with 2nd indicator via the operator.
STEP 4: CUSTOM INDICATORS ______________________________________________________________________________________________________
There is an area in the code for designing Custom Indicators.
Here you can design your own indicators and use them in the framework.
You can also create unlimited parameters for your indicators in the SETTINGS custom indicator field.
For now, only 3 Custom indicators have been defined.
Examples are entered in the code for custom indicators.
STEP 4 NOTES:
Including / updating custom to the code is explained in the source code
• LIMITATIONS:
!!! According to your tradingview subscription, it takes the last 5000, 10000.. bars. More bar options may cause problems such as not appearing in the calculations or errors.
• RAMBLINGS:
• NOTES [ /i]
This Script can be used as an indicator if the last strategy parts in the code are commented out and converted to the initial strategy study.
It was originally prepared for my use with my own strategy framework and has export functions accordingly.
When integrated to my own strategy framework it brings many more features over strategy definition of trades.
• TODO [ /i]
TODO: Add tooltips to the settings screen
TODO: Add double triple, Quatr factor for all indicators (convert any indicator to factor2-4 facotr. ex: EMA to DEMA, TEMA, QEMA...)
TODO: Add factorized Fibo avg range indicator (good for trend definition and entry exit points)
TODO: Add bands to the indicator and conditions
TODO: Add debug window for exporting indicator's parameters
TODO: Add isRising(value) isFalling(value), is...(value) .... to combinations (they can be used as custom indicator also
TODO: Reassess condition entry screen for user friendly GUI
TODO: Increase # conditions from 3 to 4
TODO: Reassess strategy entries, exit and close (should be improved)
TODO: Add Alerts, Condiional alerts for indicator (study) part
TODO: Create export function v3 for Pinecoders Indicator framework
• THANKS:
For Pine script format docs RicardoSantos .
For Pine script coding standards Pinecoders .
For moving average script used on library s RodrigoKazuma .

Optimized Linear Regression ChannelReturn a linear regression channel with a window size within the range (min, max) such that the R-squared is maximized, this allows a better estimate of an underlying linear trend, a better detection of significant historical supports and resistance points, and avoid finding a good window size manually.
Settings
Min : Minimum window size value
Max : Maximum window size value
Mult : Multiplicative factor for the rmse, control the channel width.
Src : Source input of the indicator
Details
The indicator displays the specific window size that maximizes the R-squared at the bottom of the lower channel.
When optimizing we want to find parameters such that they maximize or minimize a certain function, here the r-squared. The R-squared is given by 1 minus the ratio between the sum of squares (SSE) of the linear regression and the sum of squares of the mean. We know that the mean will always produce an SSE greater or equal to the one of the linear regression, so the R-squared will always be in a (0,1) range. In the case our data has a linear trend, the linear regression will have a better fit, thus having a lower SSE than the SSE of the mean, has such the ratio between the linear regression SSE and the mean SSE will be low, 1 minus this ratio will return a greater result. A lower R-squared will tell you that your linear regression produces a fit similar to the one produced by the mean. The R-squared is also given by the square of the correlation coefficient between the dependent and independent variables.
In pinescript optimization can be done by running a function inside a loop, we run the function for each setting and keep the one that produces the maximum or minimum result, however, it is not possible to do that with most built-in functions, including the function of interest, correlation , as such we must recreate a rolling correlation function that can be used inside loops, such functions are generally loops-free, this means that they are not computed using a loop in the first place, fortunately, the rolling correlation function is simply based on moving averages and standard deviations, both can be computed without using a loop by using cumulative sums, this is what is done in the code.
Note that because the R-squared is based on the SSE of the linear regression, maximizing the R-squared also minimizes the linear regression SSE, another thing that is minimized is the horizontality of the fit.
In the example above we have a total window size of 27, the script will try to find the setting that maximizes the R-squared, we must avoid every data points before the volatile bearish candle, using any of these data points will produce a poor fit, we see that the script avoid it, thus running as expected. Another interesting thing is that the best R-squared is not always associated to the lowest window size.
Note that optimization does not fix core problems in a model, with the linear regression we assume that our data set posses a linear trend, if it's not the case, then no matter how many settings you use you will still have a model that is not adapted to your data.

Dynamic Score Supertrend [QuantAlgo]Dynamic Score Supertrend 📈🚀
The Dynamic Score Supertrend by QuantAlgo introduces a sophisticated trend-following tool that combines the well-known Supertrend indicator with an innovative dynamic trend scoring technique . By tracking market momentum through a scoring system that evaluates price behavior over a customizable window, this indicator adapts to changing market conditions. The result is a clearer, more adaptive tool that helps traders and investors detect and capitalize on trend shifts with greater precision.
💫 Conceptual Foundation and Innovation
At the core of the Dynamic Score Supertrend is the dynamic trend score system , which measures price movements relative to the Supertrend’s upper and lower bands. This scoring technique adds a layer of trend validation, assessing the strength of price trends over time. Unlike traditional Supertrend indicators that rely solely on ATR calculations, this system incorporates a scoring mechanism that provides more insight into trend direction, allowing traders and investors to navigate both trending and choppy markets with greater confidence.
✨ Technical Composition and Calculation
The Dynamic Score Supertrend utilizes the Average True Range (ATR) to calculate the upper and lower Supertrend bands. The dynamic trend scoring technique then compares the price to these bands over a customizable window, generating a trend score that reflects the current market direction.
When the score exceeds the uptrend or downtrend thresholds, it signals a possible shift in market direction. By adjusting the ATR settings and window length, the indicator becomes more adaptable to different market conditions, from steady trends to periods of higher volatility. This customization allows users to refine the Supertrend’s sensitivity and responsiveness based on their trading or investing style.
📈 Features and Practical Applications
Customizable ATR Settings: Adjust the ATR length and multiplier to control the sensitivity of the Supertrend bands. This allows the indicator to smooth out noise or react more quickly to price shifts, depending on market conditions.
Window Length for Dynamic Scoring: Modify the window length to adjust how many data points the scoring system considers, allowing you to tailor the indicator’s responsiveness to short-term or long-term trends.
Uptrend/Downtrend Thresholds: Set thresholds for identifying trend signals. Increase these thresholds for more reliable signals in choppy markets, or lower them for more aggressive entry points in trending markets.
Bar and Background Coloring: Visual cues such as bar coloring and background fills highlight the direction of the current trend, making it easier to spot potential reversals and trend shifts.
Trend Confirmation: The dynamic trend score system provides a clearer confirmation of trend strength, helping you identify strong, sustained movements while filtering out false signals.
⚡️ How to Use
✅ Add the Indicator: Add the Dynamic Score Supertrend to your favourites, then apply it to your chart. Adjust the ATR length, multiplier, and dynamic score settings to suit your trading or investing strategy.
👀 Monitor Trend Shifts: Track price movements relative to the Supertrend bands and use the dynamic trend score to confirm the strength of a trend. Bar and background colors make it easy to visualize key trend shifts.
🔔 Set Alerts: Configure alerts when the dynamic trend score crosses key thresholds, so you can act on significant trend changes without constantly monitoring the charts.
🌟 Summary and Usage Tips
The Dynamic Score Supertrend by QuantAlgo is a robust trend-following tool that combines the power of the Supertrend with an advanced dynamic scoring system. This approach provides more adaptable and reliable trend signals, helping traders and investors make informed decisions in trending markets. The customizable ATR settings and scoring thresholds make it versatile across various market conditions, allowing you to fine-tune the indicator for both short-term momentum and long-term trend following. To maximize its effectiveness, adjust the settings based on current market volatility and use the visual cues to confirm trend shifts. The Dynamic Score Supertrend offers a refined, probabilistic approach to trading and investing, making it a valuable addition to your toolkit.

Rolling Correlation with Bitcoin V1.1 [ADRIDEM]Overview
The Rolling Correlation with Bitcoin script is designed to offer a comprehensive view of the correlation between the selected ticker and Bitcoin. This script helps investors understand the relationship between the performance of the current ticker and Bitcoin over a rolling period, providing insights into their interconnected behavior. Below is a detailed presentation of the script and its unique features.
Unique Features of the New Script
Bitcoin Comparison : Allows users to compare the correlation of the current ticker with Bitcoin, providing an analysis of their relationship.
Customizable Rolling Window : Enables users to set the length for the rolling window, adapting to different market conditions and timeframes. The default value is 252 bars, which approximates one year of trading days, but it can be adjusted as needed.
Smoothing Option : Includes an option to apply a smoothing simple moving average (SMA) to the correlation coefficient, helping to reduce noise and highlight trends. The smoothing length is customizable, with a default value of 4 bars.
Visual Indicators : Plots the smoothed correlation coefficient between the current ticker and Bitcoin, with distinct colors for easy interpretation. Additionally, horizontal lines help identify key levels of correlation.
Dynamic Background Color : Adds dynamic background colors to highlight areas of strong positive and negative correlations, enhancing visual clarity.
Originality and Usefulness
This script uniquely combines the analysis of rolling correlation for a current ticker with Bitcoin, providing a comparative view of their relationship. The inclusion of a customizable rolling window and smoothing option enhances its adaptability and usefulness in various market conditions.
Signal Description
The script includes several features that highlight potential insights into the correlation between the assets:
Rolling Correlation with Bitcoin : Plotted as a red line, this represents the smoothed rolling correlation coefficient between the current ticker and Bitcoin.
Horizontal Lines and Background Color : Lines at -0.5, 0, and 0.5 help to quickly identify regions of strong negative, weak, and strong positive correlations.
These features assist in identifying the strength and direction of the relationship between the current ticker and Bitcoin.
Detailed Description
Input Variables
Length for Rolling Window (`length`) : Defines the range for calculating the rolling correlation coefficient. Default is 252.
Smoothing Length (`smoothing_length`) : The number of periods for the smoothing SMA. Default is 4.
Bitcoin Ticker (`bitcoin_ticker`) : The ticker symbol for Bitcoin. Default is "BINANCE:BTCUSDT".
Functionality
Correlation Calculation : The script calculates the daily returns for both Bitcoin and the current ticker and computes their rolling correlation coefficient.
```pine
bitcoin_close = request.security(bitcoin_ticker, timeframe.period, close)
bitcoin_dailyReturn = ta.change(bitcoin_close) / bitcoin_close
current_dailyReturn = ta.change(close) / close
rolling_correlation = ta.correlation(current_dailyReturn, bitcoin_dailyReturn, length)
```
Smoothing : A simple moving average is applied to the rolling correlation coefficient to smooth the data.
```pine
smoothed_correlation = ta.sma(rolling_correlation, smoothing_length)
```
Plotting : The script plots the smoothed rolling correlation coefficient and includes horizontal lines for key levels.
```pine
plot(smoothed_correlation, title="Rolling Correlation with Bitcoin", color=color.rgb(255, 82, 82, 50), linewidth=2)
h_neg1 = hline(-1, "-1 Line", color=color.gray)
h_neg05 = hline(-0.5, "-0.5 Line", color=color.red)
h0 = hline(0, "Zero Line", color=color.gray)
h_pos05 = hline(0.5, "0.5 Line", color=color.green)
h1 = hline(1, "1 Line", color=color.gray)
fill(h_neg1, h_neg05, color=color.rgb(255, 0, 0, 90), title="Strong Negative Correlation Background")
fill(h_neg05, h0, color=color.rgb(255, 165, 0, 90), title="Weak Negative Correlation Background")
fill(h0, h_pos05, color=color.rgb(255, 255, 0, 90), title="Weak Positive Correlation Background")
fill(h_pos05, h1, color=color.rgb(0, 255, 0, 90), title="Strong Positive Correlation Background")
```
How to Use
Configuring Inputs : Adjust the rolling window length and smoothing length as needed. Ensure the Bitcoin ticker is set to the desired asset for comparison.
Interpreting the Indicator : Use the plotted correlation coefficient and horizontal lines to assess the strength and direction of the relationship between the current ticker and Bitcoin.
Signal Confirmation : Look for periods of strong positive or negative correlation to identify potential co-movements or divergences. The background colors help to highlight these key levels.
This script provides a detailed comparative view of the correlation between the current ticker and Bitcoin, aiding in more informed decision-making by highlighting the strength and direction of their relationship.
AI Channels (Clustering) [LuxAlgo]The AI Channels indicator is constructed based on rolling K-means clustering, a common machine learning method used for clustering analysis. These channels allow users to determine the direction of the underlying trends in the price.
We also included an option to display the indicator as a trailing stop from within the settings.
🔶 USAGE
Each channel extremity allows users to determine the current trend direction. Price breaking over the upper extremity suggesting an uptrend, and price breaking below the lower extremity suggesting a downtrend. Using a higher Window Size value will return longer-term indications.
The "Clusters" setting allows users to control how easy it is for the price to break an extremity, with higher values returning extremities further away from the price.
The "Denoise Channels" is enabled by default and allows to see less noisy extremities that are more coherent with the detected trend.
Users who wish to have more focus on a detected trend can display the indicator as a trailing stop.
🔹 Centroid Dispersion Areas
Each extremity is made of one area. The width of each area indicates how spread values within a cluster are around their centroids. A wider area would suggest that prices within a cluster are more spread out around their centroid, as such one could say that it is indicative of the volatility of a cluster.
Wider areas around a specific extremity can indicate a larger and more spread-out amount of prices within the associated cluster. In practice price entering an area has a higher chance to break an associated extremity.
🔶 DETAILS
The indicator performs K-means clustering over the most recent Window Size prices, finding a number of user-specified clusters. See here to find more information on cluster detection.
The channel extremities are returned as the centroid of the lowest, average, and highest price clusters.
K-means clustering can be computationally expensive and as such we allow users to determine the maximum number of iterations used to find the centroids as well as the number of most historical bars to perform the indicator calculation. Do note that increasing the calculation window of the indicator as well as the number of clusters will return slower results.
🔶 SETTINGS
Window Size: Amount of most recent prices to use for the calculation of the indicator.
Clusters": Amount of clusters detected for the calculation of the indicator.
Denoise Channels: When enabled, return less noisy channels extremities, disabling this setting will return the exact centroids at each time but will produce less regular extremities.
As Trailing Stop: Display the indicator as a trailing stop.
🔹 Optimization
This group of settings affects the runtime performance of the script.
Maximum Iteration Steps: Maximum number of iterations allowed for finding centroids. Excessively low values can return a better script load time but poor clustering.
Historical Bars Calculation: Calculation window of the script (in bars).
Z-HistogramIt is possible to approximate the underlying distribution of a random variable by using what is called an "Histogram". In order to construct an histogram one must first split the data into several intervals (also called bins) often of the same size and count the number of values falling within each intervals, the histogram plot is then constructed with the X axis representing the measured variable and the Y axis representing the frequency.
The proposed script aim to estimate the underlying distribution of a rolling z-score by constructing its histogram, here the histogram consist of 13 bins of width 0.5 rolling standard deviations. The length setting define the rolling z-score period, the window setting define the number of past data to be counted, finally using the "Total" option (true by default) will count all the rolling z-scores values since the first bar, in order to use the window setting make sure to uncheck the "Total" option.
DISPLAY
In order to see the entirety of the histogram make sure to double click on the indicator window and to have all the lower panels (text notes, pine editor...etc) hidden, finally make sure to zoom-in in order to see the frequency numbers displayed.
Z-Histogram on BTCUSD 15 min TF, the blue bins represent intervals situated over 0 while red bins represent intervals situated under 0. Here σ represent the X-axis in standard deviations, the histogram start with a bin situated at σ = -3 which count the number of times the rolling z-score was within -3 and -2.5, the histogram end with the bin situated at σ = 3 which count the number of time the rolling z-score was within 3 and 3.5.
It is also possible to look at the shape of the histogram without having the indicator window at full size.
INTERPREATION
An histogram can give really interesting information such as overall trend direction and strength. The direction can be measured by looking at the skewness of the histogram, with a negative skewness (the peak of the histogram situated at the right from the center) representing down-trending variations and positive skewness (the peak of the histogram situated at the left from the center) representing up-trending variations, while a symmetrical histogram could represent a ranging market. The farther away the peak of the histogram is situated from the center, the stronger the trend.
Another interesting characteristic is the tailedness of the histogram, which can give information about the cleanliness of the trend, for example a positive skew and high tailedness would represent a clean up-trend, as it could suggest less variations contrary to the main trend.
An histogram applied to the rolling z-score can give various useful information. As a recall the rolling z-score of the price measure the distance between the closing price and its moving average in term of rolling standard deviations, for example if the rolling z-score is equal to 2 it means that the closing price is currently 2 rolling standard deviations over its moving average.
Lets for example analyze the histogram using INTC 15 min tf with a window of 456 bars and rolling z-score of length = 100 in order to review longer term variations.
We can see from the histogram that the uptrend visible on the chart is represented by the bins situated over 0 having an overall higher frequency than the bins under 0, we can see that the closing price tended to stay between 1 and 1.5 rolling standard deviations over its period 100 moving average. Here bins under 0 accounts for retracements in the trend.
IN SUMMARY
An histogram can give various information regarding the price evolution of a security, the proposed script aim to plot the histogram of a rolling z-score. Now this script might not be too useful but it was fun to make, also it does not mean that an histogram is not an useful tool in the context of trading, the only thing required is a god implementation of it (like volume profiles for example)
In this post we have also reviewed some important statistical concepts such as distributions, z-score, skewness and tailedness, each being extremely important in the quantitative trading field.
Thx for reading !

BEST Dollar Cost AverageHello traders
This is an upgraded version of my Dollar Cost Average (Data Window) script
1 - What is Dollar-Cost Averaging ( DCA )?
Dollar-Cost Averaging is a strategy that allows an investor to buy the same dollar amount of investment at regular intervals. The purchases occur regardless of the asset's price.
I hope you're hungry because that one is a biggie and gave me a few headaches. Happy that it's getting out of my way finally and I can offer it
🔸 This indicator will analyze for the defined date range, how a dollar-cost average ( DCA ) method would have performed (green panel) versus investing all the hard earnt money at the beginning (orange panel)
=> green versus orange
2- What's on the menu today?
My indicator works with all asset classes and with the daily/weekly/monthly inputs.
⚠️⚠️⚠️ However, results are only visible on the DAILY timeframe chart
As always, let's review quickly the different fields so that you'll understand how to use it (and I won't get spammed with questions in DM ^^)
🔸 Use current resolution: if checked will use the resolution of the chart
🔸 The timeframe used for DCA: different timeframe to be used if Use current resolution is unchecked
🔸 Amount invested in your local currency: The amount in Fiat money that will be invested at each period selected above
🔸 Starting Date
🔸 Ending Date
🔹 The script screenshot shows a DCA with 100 USD invested daily from 01.01.2017 to 01.28.2020
3- Bonus (DATA WINDOW)
🔸 Please check this screenshot to understand what you're supposed to see: Data window
And a quick video that I did months ago explaining how we can use this data window effectively
4 - Specifications used
I got the idea from this website dcabtc.com and the result shown by this website and my indicator are very interesting in general and for your own trading
The formula used for the DCA calculation is the one from the Investopedia website.
Best regards and best of luck
Dave

Currency Correlation indicator for the major currenciesThis Pine script creates a currency correlation graph with 6 correlations in a separate window below the main chart.
The indicator supports the following 8 currencies: AUD, CAD, CHF, EUR, GBP, JPY, NZD, USD
Correlations can be selected to be either related to the base or the counter currency (default is base). The length of the correlation can be chosen (default is 10).
Correlations are given for related currencies e.g. for all AUD pairs.
If Base currency is selected and e.g. AUDCAD is displayed in the main window, then the correlation window will compare AUDCAD to: AUDCHF, AUDEUR, AUDGBP, AUDJPY, AUDNZD, AUDUSD
If Counter currency is seleted and e.g. AUDCAD is displayed in the main window, then the correlation window will compare AUDCAD to: CHFCAD, EURCAD, GBPCAD, JPYCAD, NZDCAD, USDCAD
Many of the above currency pairs are not real pairs. But they are availabe in Pine script to enable e.g. correlation calculations.
The advantage is that e.g. the comparison between AUDCAD and EURAUD will give a positive correlation, if AUD is gaining in strenght and EUR and CAD are not changing in strenght.
Eventhough price is moving in the opposite direction the correlation is positive in the AUDCAD vs EURAUD example.

Commodity Channel Index DualThe CCI Dual is a custom TradingView indicator built in Pine Script v5, designed to help traders identify potential buy and sell signals using two Commodity Channel Index (CCI) oscillators. It combines a shorter-period CCI (default: 14) for quick momentum detection with a longer-period CCI (default: 50) for confirmation, focusing on mean-reversion opportunities in overbought or oversold conditions.
This setup is particularly suited for volatile markets like cryptocurrencies on higher timeframes (e.g., 3-day charts), where it highlights reversals by requiring both CCIs to cross out of extreme zones within a short window (default: 3 bars).
The indicator plots the CCIs, customizable bands (inner: 100, OB/OS: 175, outer: 200), dynamic fills for visual emphasis, background highlights for signals, and alert conditions for notifications.
How It Works
The indicator calculates two CCIs based on user-defined lengths and source (default: close price):
CCI Calculation: CCI measures price deviation from its average, using the formula: CCI = (Typical Price - Simple Moving Average) / (0.015 * Mean Deviation). The short CCI reacts faster to price changes, while the long CCI provides smoother, trend-aware confirmation.
Overbought/Oversold Levels: Customizable thresholds define extremes (Overbought at +175, Oversold at -175 by default). Bands are plotted at inner (±100), mid (±175 dashed), and outer (±200) levels, with gray fills for the outer zones.
Dynamic Fills: The longer CCI is used to shade areas beyond OB/OS levels in red (overbought) or green (oversold) for quick visual cues.
Signals:
Buy Signal: Triggers when both CCIs cross above the Oversold level (-175) within the signal window (3 bars). This suggests a potential upward reversal from an oversold state.
Sell Signal: Triggers when both cross below the Overbought level (+175) within the window, indicating a possible downward reversal.
Visuals and Alerts: Buy signals highlight the background green, sells red. Separate alertconditions allow setting TradingView alerts for buys or sells independently.
Customization: Adjust lengths, levels, and window via inputs to fit your timeframe or asset—e.g., higher OB/OS for crypto volatility.
This logic reduces noise by requiring dual confirmation, but like all oscillators, it can produce false signals in strong trends where prices stay extended.
To mitigate false signals (e.g., in trending markets), layer the CCI Dual with MACD (default: 12,26,9) and RSI (default: 14) for multi-indicator confirmation:
With MACD: Only take CCI buys if the MACD line is above the signal line (or histogram positive), confirming bullish momentum. For sells, require MACD bearish crossover. This filters counter-trend signals by aligning with trend strength—e.g., ignore CCI sells if MACD shows upward momentum.
With RSI: Confirm CCI oversold buys only if RSI is below 30 and rising (or shows bullish divergence). For overbought sells, RSI above 70 and falling. This adds overextension validation, reducing whipsaws in crypto trends.
I made this customizable for you to find what works best for your asset you are trading. I trade the 6 hour and 3 day timeframe mainly on major cryptocurrency pairs. I hope you enjoy this script and it serves you well.

Moving Average Adaptive RSI [BackQuant]Moving Average Adaptive RSI
What this is
A momentum oscillator that reshapes classic RSI into a zero-centered column plot and makes it adaptive. It builds RSI from two parts:
• A sensitivity window that scans several recent bars to capture the strongest up and down impulses.
• A selectable moving average that smooths those impulses before computing RSI.
The output ranges roughly from −100 to +100 with 0 as the midline, with optional extra smoothing and built-in divergence detection.
How it works
Impulse extraction
• For each bar the script inspects the last rsi_sen bars and collects upward and downward price changes versus the current price.
• It keeps the maximum upward change and maximum downward change from that window, emphasizing true bursts over single-bar noise.
MA-based averaging
• The up and down impulse series are averaged with your chosen MA over rsi_len bars.
• Supported MA types: SMA, EMA, DEMA, WMA, HMA, SMMA (RMA), TEMA.
Zero-centered RSI transform
• RS = UpMA ÷ DownMA, then mapped to a symmetric scale: 100 − 200 ÷ (1 + RS) .
• Above 0 implies positive momentum bias. Below 0 implies negative momentum bias.
Optional extra smoothing
• A second smoothing pass can be applied to the final oscillator using smoothing_len and smooth_type . Toggle with “Use Extra Smoothing”.
Visual encoding
• The oscillator is drawn as columns around the zero line with a gradient that intensifies toward extremes.
• Static bands mark 80 to 100 and −80 to −100 for extreme conditions.
Key inputs and what they change
• Price Source : input series for momentum.
• Calculation Period (rsi_len) : primary averaging window on up and down components. Higher = smoother, slower.
• Sensitivity (rsi_sen) : how many recent bars are scanned to find max impulses. Higher = more responsive to bursts.
• Calculation Type (ma_type) : MA family that shapes the core behavior. HMA or DEMA is faster, SMA or SMMA is slower.
• Smoothing Type and Length : optional second pass to calm noise on the final output.
• UI toggles : show or hide the oscillator, candle painting, and extreme bands.
Reading the oscillator
• Midline cross up (0) : momentum bias turning positive.
• Midline cross down (0) : momentum bias turning negative.
• Positive territory :
– 0 to 40: constructive but not stretched.
– 40 to 80: strong momentum, continuation more likely.
– Above 80: extreme risk of mean reversion grows.
• Negative territory : mirror the same levels for the downside.
Divergence detection
The script plots four divergence types using pivot highs and lows on both price and the oscillator. Lookbacks are set by lbL and lbR .
• Regular bullish : price lower low, oscillator higher low. Possible downside exhaustion.
• Hidden bullish : price higher low, oscillator lower low. Bias to trend continuation up.
• Regular bearish : price higher high, oscillator lower high. Possible upside exhaustion.
• Hidden bearish : price lower high, oscillator higher high. Bias to trend continuation down.
Labels: ℝ for regular, ℍ for hidden. Green for bullish, red for bearish.
Candle coloring
• Optional bar painting: green when the oscillator is above 0, red when below 0. This is for visual scanning only.
Strengths
• Adaptive sensitivity via a rolling impulse window that responds to genuine bursts.
• Configurable MA core so you can match responsiveness to the instrument.
• Zero-centered scale for simple regime reads with 0 as a clear bias line.
• Built-in regular and hidden divergence mapping.
• Flexible across symbols and timeframes once tuned.
Limitations and cautions
• Trends can remain extended. Treat extremes as context rather than automatic reversal signals.
• Divergence quality depends on pivot lookbacks. Short lookbacks give more signals with more noise. Long lookbacks reduce noise but add lag.
• Double smoothing can delay zero-line transitions. Balance smoothness and timeliness.
Practical usage ideas
• Regime filter : only take long setups from your separate method when the oscillator is above 0, shorts when below 0.
• Pullback confirmation : in uptrends, look for dips that hold above 0 or turn up from 0 to 40. Reverse for downtrends.
• Divergence as a heads-up : wait for a zero-line cross or a price trigger before acting on divergence.
• Sensitivity tuning : start with rsi_sen 2 to 5 on faster timeframes, increase slightly on slower charts.
Alerts
• MA-A RSI Long : oscillator crosses above 0.
• MA-A RSI Short : oscillator crosses below 0.
Use these as bias or timing aids, not standalone trade commands.
Settings quick reference
• Calculation : Price Source, Calculation Type, Calculation Period, Sensitivity.
• Smoothing : Smoothing Type, Smoothing Length, Use Extra Smoothing.
• UI : Show Oscillator, Paint Candles, Show Static High and Low Levels.
• Divergences : Pivot Lookback Left and Right, Div Signal Length, Show Detected Divergences.
Final thoughts
This tool reframes RSI by extracting strong short-term impulses and averaging them with a moving-average model of your choice, then presenting a zero-centered output for clear regime reads. Pair it with your structure, risk and execution process, and tune sensitivity and smoothing to the market you trade.

Volumetric Support and Resistance [BackQuant]Volumetric Support and Resistance
What this is
This Overlay locates price levels where both structure and participation have been meaningful. It combines classical swing points with a volume filter, then manages those levels on the chart as price evolves. Each level carries:
• A reference price (support or resistance)
• An estimate of the volume that traded around that price
• A touch counter that updates when price retests it
• A visual box whose thickness is scaled by volatility
The result is a concise map of candidate support and resistance that is informed by both price location and how much trading occurred there.
How levels are built
Find structural pivots uses ta.pivothigh and ta.pivotlow with a user set sensitivity. Larger sensitivity looks for broader swings. Smaller sensitivity captures tighter turns.
Require meaningful volume computes an average volume over a lookback period and forms a volume ratio for the current bar. A pivot only becomes a level when the ratio is at least the volume significance multiplier.
Avoid clustering checks a minimum level distance (as a percent of price). If a candidate is too close to an existing level, it is skipped to keep the map readable.
Attach a volume strength to the level estimates volume strength by averaging the volume of recent bars whose high to low range spans that price. Levels with unusually high strength are flagged as high volume.
Store and draw levels are kept in an array with fields for price, type, volume, touches, creation bar, and a box handle. On the last bar, each level is drawn as a horizontal box centered at the price with a vertical thickness scaled by ATR. Borders are thicker when the level is marked high volume. Boxes can extend into the future.
How levels evolve over time
• Aging and pruning : levels are removed if they are too old relative to the lookback or if you exceed the maximum active levels.
• Break detection : a level can be removed when price closes through it by more than a break threshold set as a fraction of ATR. Toggle with Remove Broken Levels.
• Touches : when price approaches within the break threshold, the level’s touch counter increments.
Visual encoding
• Boxes : support boxes are green, resistance boxes are red. Box height uses an ATR based thickness so tolerance scales with volatility. Transparency is fixed in this version. Borders are thicker on high volume levels.
• Volume annotation : show the estimated volume inside the box or as a label at the right. If a level has more than one touch, a suffix like “(2x)” is appended.
• Extension : boxes can extend a fixed number of bars into the future and can be set to extend right.
• High volume bar tint : bars with volume above average × multiplier are tinted green if up and red if down.
Inputs at a glance
Core Settings
• Level Detection Sensitivity — pivot window for swing detection
• Volume Significance Multiplier — minimum volume ratio to accept a pivot
• Lookback Period — window for average volume and maintenance rules
Level Management
• Maximum Active Levels — cap on concurrently drawn levels
• Minimum Level Distance (%) — required spacing between level prices
Visual Settings
• Remove Broken Levels — drop a level once price closes decisively through it
• Show Volume Information on Levels — annotate volume and touches
• Extend Levels to Right — carry boxes forward
Enhanced Visual Settings
• Show Volume Text Inside Box — text placement option
• Volume Based Transparency and Volume Based Border Thickness — helper logic provided; current draw block fixes transparency and increases border width on high volume levels
Colors
• Separate colors for support, resistance, and their high volume variants
How it can be used
• Trade planning : use the most recent support and resistance as reference zones for entries, profit taking, or stop placement. ATR scaled thickness provides a practical buffer.
• Context for patterns : combine with breakouts, pullbacks, or candle patterns. A breakout through a high volume resistance carries more informational weight than one through a thin level.
• Prioritization : when multiple levels are nearby, prefer high volume or higher touch counts.
• Regime adaptation : widen sensitivity and increase minimum distance in fast regimes to avoid clutter. Tighten them in calm regimes to capture more granularity.
Why volume support and resistance is used in trading
Support and resistance relate to willingness to transact at certain prices. Volume measures participation. When many contracts change hands near a price:
• More market players hold inventory there, often creating responsive behavior on retests
• Order flow can concentrate again to defend or to exit
• Breaks can be cleaner as trapped inventory rebalances
Conditioning level detection on above average activity focuses attention on prices that mattered to more participants.
Alerts
• New Support Level Created
• New Resistance Level Created
• Level Touch Alert
• Level Break Alert
Strengths
• Dual filter of structure and participation, reducing trivial swing points
• Self cleaning map that retires old or invalid levels
• Volatility aware presentation using ATR based thickness
• Touch counting for persistence assessment
• Tunable inputs for instrument and timeframe
Limitations and caveats
• Volume strength is an approximation based on bars spanning the price, not true per price volume
• Pivots confirm after the sensitivity window completes, so new levels appear with a delay
• Narrow ranges can still cluster levels unless minimum distance is increased
• Large gaps may jump past levels and immediately trigger break conditions
Practical tuning guide
• If the chart is crowded: increase sensitivity, increase minimum level distance, or reduce maximum active levels
• If useful levels are missed: reduce volume multiplier or sensitivity
• If you want stricter break removal: increase the ATR based break threshold in code
• For instruments with session patterns: tailor the lookback period to a representative window
Interpreting touches and breaks
• First touch after creation is a validation test
• Multiple shallow touches suggest absorption; a later break may then travel farther
• Breaks on high current volume merit extra attention
Multi timeframe usage
Levels are computed on the active chart timeframe. A common workflow is to keep a higher timeframe instance for structure and a lower timeframe instance for execution. Align trades with higher timeframe levels where possible.
Final Thoughts
This indicator builds a lightweight, self updating map of support and resistance grounded in swings and participation. It is not a full market profile, but it captures much of the practical benefit with modest complexity. Treat levels as context and decision zones, not guarantees. Combine with your entry logic and risk controls.

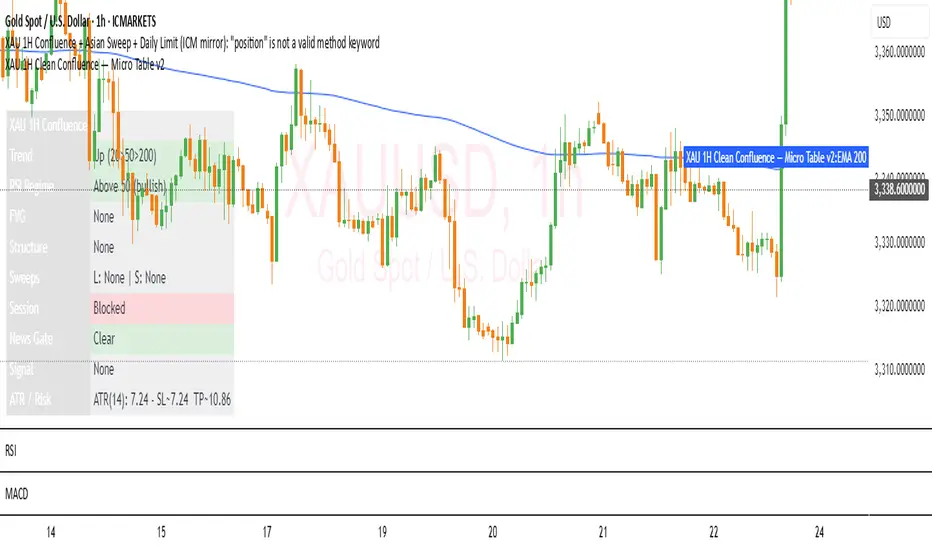
XAU 1H Clean Confluence — Micro Table v2XAU 1H Clean Confluence — Micro Table
What it is
A clean, low-clutter 1-hour XAUUSD indicator that summarizes confluences in a compact on-chart table. It’s designed for traders who want structure + momentum + location without covering the chart in drawings.
Best used on: ICMARKETS:XAUUSD or your broker’s XAUUSD feed, 1H timeframe.
Style: Table-only by default (optional EMA200 line and tiny signal markers).
How signals are built (long example; shorts mirror)
A Long Confluence is printed when all of the below are true:
Trend alignment: EMA20 > EMA50 > EMA200
Pullback & re-engage: price crossed back above EMA20 after a pullback
RSI regime: RSI(14) crosses up through 50 (trend confirmation)
Displacement/imbalance: a 3-candle Bull FVG exists (low > high )
Structure: either a BOS up or CHOCH up via swing pivots (pivotLen input)
Sweep (optional): if enabled, require a sweep of Asian Low and/or PDL first
Time gating (optional): only during London/NY windows and outside news windows
Short signals use the mirrored conditions (EMA stack down, cross back below EMA20, RSI cross down through 50, Bear FVG, BOS/CHOCH down, optional Asian High/PDH sweep).
ICT Silver Bullet Zones (All Sessions)This Pine Script v6 indicator highlights the ICT Silver Bullet windows (10:00–11:00 local time) for all major forex/trading sessions: London, New York AM, New York PM, and Asia.
✅ Features:
Clearly visualizes Silver Bullet zones for each session.
Labels are centered inside each zone for easy identification.
Fully compatible with Pine Script v6 and TradingView.
Adjustable opacity and label size for better chart visibility.
Works on any timeframe and keeps historical zones visible.
Use Case:
Perfect for ICT strategy traders who want to identify high-probability trading windows during major market sessions. Helps in planning entries and understanding liquidity timing without cluttering the chart.
Instructions:
Add the script to your TradingView chart.
Adjust opacity and label size to suit your chart style.
Observe the SB zones for all sessions and plan trades according to ICT methodology.

VWAP For Loop [BackQuant]VWAP For Loop
What this tool does—in one sentence
A volume-weighted trend gauge that anchors VWAP to a calendar period (day/week/month/quarter/year) and then scores the persistence of that VWAP trend with a simple for-loop “breadth” count; the result is a clean, threshold-driven oscillator plus an optional VWAP overlay and alerts.
Plain-English overview
Instead of judging raw price alone, this indicator focuses on anchored VWAP —the market’s average price paid during your chosen institutional period. It then asks a simple question across a configurable set of lookback steps: “Is the current anchored VWAP higher than it was i bars ago—or lower?” Each “yes” adds +1, each “no” adds −1. Summing those answers creates a score that reflects how consistently the volume-weighted trend has been rising or falling. Extreme positive scores imply persistent, broad strength; deeply negative scores imply persistent weakness. Crossing predefined thresholds produces objective long/short events and color-coded context.
Under the hood
• Anchoring — VWAP using hlc3 × volume resets exactly when the selected period rolls:
Day → session change, Week → new week, Month → new month, Quarter/Year → calendar quarter/year.
• For-loop scoring — For lag steps i = , compare today’s VWAP to VWAP .
– If VWAP > VWAP , add +1.
– Else, add −1.
The final score ∈ , where N = (end − start + 1). With defaults (1→45), N = 45.
• Signal logic (stateful)
– Long when score > upper (e.g., > 40 with N = 45 → VWAP higher than ~89% of checked lags).
– Short on crossunder of lower (e.g., dropping below −10).
– A compact state variable ( out ) holds the current regime: +1 (long), −1 (short), otherwise unchanged. This “stickiness” avoids constant flipping between bars without sufficient evidence.
Why VWAP + a breadth score?
• VWAP aggregates both price and volume—where participants actually traded.
• The breadth-style count rewards consistency of the anchored trend, not one-off spikes.
• Thresholds give you binary structure when you need it (alerts, automation), without complex math.
What you’ll see on the chart
• Sub-pane oscillator — The for-loop score line, colored by regime (long/short/neutral).
• Main-pane VWAP (optional) — Even though the indicator runs off-chart, the anchored VWAP can be overlaid on price (toggle visibility and whether it inherits trend colors).
• Threshold guides — Horizontal lines for the long/short bands (toggle).
• Cosmetics — Optional candle painting and background shading by regime; adjustable line width and colors.
Input map (quick reference)
• VWAP Anchor Period — Day, Week, Month, Quarter, Year.
• Calculation Start/End — The for-loop lag window . With 1→45, you evaluate 45 comparisons.
• Long/Short Thresholds — Default upper=40, lower=−10 (asymmetric by design; see below).
• UI/Style — Show thresholds, paint candles, background color, line width, VWAP visibility and coloring, custom long/short colors.
Interpreting the score
• Near +N — Current anchored VWAP is above most historical VWAP checkpoints in the window → entrenched strength.
• Near −N — Current anchored VWAP is below most checkpoints → entrenched weakness.
• Between — Mixed, choppy, or transitioning regimes; use thresholds to avoid reacting to noise.
Why the asymmetric default thresholds?
• Long = score > upper (40) — Demands unusually broad upside persistence before declaring “long regime.”
• Short = crossunder lower (−10) — Triggers only on downward momentum events (a fresh breach), not merely being below −10. This combination tends to:
– Capture sustained uptrends only when they’re very strong.
– Flag downside turns as they occur, rather than waiting for an extreme negative breadth.
Tuning guide
Choose an anchor that matches your horizon
– Intraday scalps : Day anchor on intraday charts.
– Swing/position : Month or Quarter anchor on 1h/4h/D charts to capture institutional cycles.
Pick the for-loop window
– Larger N (bigger end) = stronger evidence requirement, smoother oscillator.
– Smaller N = faster, more reactive score.
Set achievable thresholds
– Ensure upper ≤ N and lower ≥ −N ; if N=30, an upper of 40 can never trigger.
– Symmetric setups (e.g., +20/−20) are fine if you want balanced behavior.
Match visuals to intent
– Enabling VWAP coloring lets you see regime directly on price.
– Background shading is useful for discretionary reading; turn it off for cleaner automation displays.
Playbook examples
• Trend confirmation with disciplined entries — On Month anchor, N=45, upper=38–42: when the long regime engages, use pullbacks toward anchored VWAP on the main pane for entries, with stops just beyond VWAP or a recent swing.
• Downside transition detection — Keep lower around −8…−12 and watch for crossunders; combine with price losing anchored VWAP to validate risk-off.
• Intraday bias filter — Day anchor on a 5–15m chart, N=20–30, upper ~ 16–20, lower ~ −6…−10. Only take longs while score is positive and above a midline you define (e.g., 0), and shorts only after a genuine crossunder.
Behavior around resets (important)
Anchored VWAP is hard-reset each period. Immediately after a reset, the series can be young and comparisons to pre-reset values may span two periods. If you prefer within-period evaluation only, choose end small enough not to bridge typical period length on your timeframe, or accept that the breadth test intentionally spans regimes.
Alerts included
• VWAP FL Long — Fires when the long condition is true (score > upper and not in short).
• VWAP FL Short — Fires on crossunder of the lower threshold (event-driven).
Messages include {{ticker}} and {{interval}} placeholders for routing.
Strengths
• Simple, transparent math — Easy to reason about and validate.
• Volume-aware by construction — Decisions reference VWAP, not just price.
• Robust to single-bar noise — Needs many lags to agree before flipping state (by design, via thresholds and the stateful output).
Limitations & cautions
• Threshold feasibility — If N < upper or |lower| > N, signals will never trigger; always cross-check N.
• Path dependence — The state variable persists until a new event; if you want frequent re-evaluation, lower thresholds or reduce N.
• Regime changes — Calendar resets can produce early ambiguity; expect a few bars for the breadth to mature.
• VWAP sensitivity to volume spikes — Large prints can tilt VWAP abruptly; that behavior is intentional in VWAP-based logic.
Suggested starting profiles
• Intraday trend bias : Anchor=Day, N=25 (1→25), upper=18–20, lower=−8, paint candles ON.
• Swing bias : Anchor=Month, N=45 (1→45), upper=38–42, lower=−10, VWAP coloring ON, background OFF.
• Balanced reactivity : Anchor=Week, N=30 (1→30), upper=20–22, lower=−10…−12, symmetric if desired.
Implementation notes
• The indicator runs in a separate pane (oscillator), but VWAP itself is drawn on price using forced overlay so you can see interactions (touches, reclaim/loss).
• HLC3 is used for VWAP price; that’s a common choice to dampen wick noise while still reflecting intrabar range.
• For-loop cap is kept modest (≤50) for performance and clarity.
How to use this responsibly
Treat the oscillator as a bias and persistence meter . Combine it with your entry framework (structure breaks, liquidity zones, higher-timeframe context) and risk controls. The design emphasizes clarity over complexity—its edge is in how strictly it demands agreement before declaring a regime, not in predicting specific turns.
Summary
VWAP For Loop distills the question “How broadly is the anchored, volume-weighted trend advancing or retreating?” into a single, thresholded score you can read at a glance, alert on, and color through your chart. With careful anchoring and thresholds sized to your window length, it becomes a pragmatic bias filter for both systematic and discretionary workflows.

Fibo Swing MFI by julzALGOOVERVIEW
Fibo Swing MFI by julzALGO blends MFI → RSI → Least-Squares smoothing to flag overbought/oversold swings and continuously plot Fibonacci retracements from the rolling high/low of the last 200 bars. It’s built to spot momentum shifts while giving you a clean, always-current fib map of the recent market range.
CORE PRINCIPLES
Hybrid Momentum Signal
- Uses MFI to integrate price and volume.
- Applies RSI to MFI for momentum clarity.
- Smooths the result with Least Squares regression to reduce noise.
Swing Identification
- Marks potential swing highs when momentum is overbought.
- Marks potential swing lows when momentum is oversold.
Fixed-Window Fibonacci Mapping
- Always calculates fib levels from the highest high and lowest low of the last 200 bars.
- This keeps fib zones consistent, independent of swing point detection.
Visual Clarity & Non-Repainting Logic
- Clean labels for OB/OS zones.
- Lines and levels update only as new bars confirm changes.
Adaptability
- Works on any market and timeframe.
- Adjustable momentum length, OB/OS thresholds, and smoothing.
HOW IT WORKS
- Computes Money Flow Index (MFI) from price & volume.
- Applies RSI to the MFI for clearer OB/OS momentum.
- Smooths the hybrid with a Least Squares (linear regression) filter.
- Swing labels appear when OB/OS conditions are met (green = swing low, red = swing high).
- Fibonacci retracements are always drawn from the highest high and lowest low of the last 200 bars (rolling window), independent of swing labels.
HOW TO USE
- Watch for OB/OS flips to mark potential swing highs/lows.
- Use the 200-bar fib grid as your active map of pullback levels and reaction zones.
- Combine fib reactions with your price action/volume cues for confirmation.
- Works across markets and timeframes.
SETTINGS
- Length – Period for both MFI and RSI.
- OB/OS Levels – Overbought/oversold thresholds (default 70/30).
- Smooth – Least-Squares smoothing length.
- Fibonacci Window – Fixed at 200 bars in this version (changeable in code via fibLen).
NOTES
- Logic is non-repainting aside from standard bar/label confirmation.
- Increase Length on very low timeframes to reduce noise.
- Swing labels help context; fibs are always based on the most recent 200-bar high/low range.
SUMMARY
Fibo Swing MFI by julzALGO is a momentum-plus-price action tool that merges MFI → RSI → smoothing to identify overbought/oversold swings and automatically plot Fibonacci retracements based on the rolling high/low of the last 200 bars. It’s designed to help traders quickly see potential reversal points and pullback zones, offering visual confluence between momentum shifts and fixed-window price structure.
DISCLAIMER
For educational purposes only. Not financial advice. Trade responsibly with proper risk management.

Post 9/21 EMA Cross — Paint X Bars* Watches for **9 EMA crossing the 21 EMA** (a classic momentum/trend trigger).
* When a cross happens, it **paints exactly X bars** after the cross in a color you choose:
* **Bullish cross (9 > 21):** paints your bullish color for X bars.
* **Bearish cross (9 < 21):** paints your bearish color for X bars.
* You decide whether the **cross bar itself counts** as the first painted bar.
* Optionally plots the 9 & 21 EMAs so you can see the cross visually.
# Why that’s useful
* **Focus:** It reduces noise by spotlighting the **immediate post‑cross window** when momentum often continues.
* **Discipline:** “Exactly X bars” forces consistency, avoiding “just one more bar” bias.
* **Speed:** Color‑coded candles make it easy to scan charts fast (great for intraday work).
# How signals are defined
* **Bullish condition:** `ta.crossover(EMA9, EMA21)` — the fast EMA crosses **up** through the slow EMA.
* **Bearish condition:** `ta.crossunder(EMA9, EMA21)` — the fast EMA crosses **down** through the slow EMA.
# Key inputs (and what they control)
* **Fast EMA Length (default 9)** and **Slow EMA Length (default 21)**
Change these if your system uses different lookbacks (e.g., 8/21 or 10/20).
***CURRENTLY THE EMA REMAINS STATIC ON THE CHART. PLOT EMA FROM EXTERNAL INDICATOR FOR NOW
* **Bars to Paint After a Cross (default 5)**
How many bars get highlighted post‑cross.
* **Include the Cross Bar Itself? (default off)**
Turn on if you want painting to start **on** the cross candle; off to start **after** it.
* **Bullish/Bearish Paint Colors**
Set your preferred colors (e.g., green/red).
* **Plot EMAs on Chart?**
If off, the logic still works; it just hides the EMA lines.
# What you’ll see on the chart
* Candles **recolored** for exactly X bars after each cross, matching the direction.
* (Optional) 9 & 21 EMA lines so you can confirm the cross visually.
* When the X‑bar window ends, candles return to normal until the **next** cross.
# Practical trading uses
* **Entry timing:** Consider entries only during the painted window to align with fresh momentum.
* **Scaling logic:** Scale in/out within the painted window; stop adding when painting ends.
* **Context filter:** Use the paint as a **“go / no‑go” overlay** on top of your pattern or level setups (breakouts, pullbacks to EMA, ORB, etc.).

Prev D/W/M + Asia & London Levels [Oeditrades]Prev D/W/M + Asia & London Levels
Author: Oeditrades
Platform: Pine Script® v6
What it does
Plots only the most recent, fully completed:
Previous Day / Week / Month highs & lows
Asia and London session highs & lows
Levels are drawn as true horizontal lines from the period/session start and extended to the right for easy confluence reading. The script is non-repainting.
How it works
Prev Day/Week/Month: Uses completed HTF candles (high / low ) so values are fixed for the entire next period.
Sessions (NY time): Asia (default 20:00–03:00) and London (default 03:00–08:00) are tracked in America/New_York time. High/low are locked when the session ends, and the line is anchored at that session’s start.
Inputs & customization
Visibility: toggle Previous Day/Week/Month, Asia, London, and labels.
Colors: highs default red; lows default green (user-configurable). Session highs default pink, lows aqua (also editable).
Style: line style (solid/dotted/dashed) and width.
Sessions: editable time windows for Asia and London (still interpreted in New York time).
Disclaimer: optional on-chart disclaimer panel with editable text.
Notes
Works on any timeframe. For intraday charts, the HTF values remain constant until the next HTF bar completes.
If your market’s overnight hours differ, simply adjust the session windows in Inputs.
Lines intentionally show only the latest completed period/session to keep charts clean.
Use cases
Quick view of PDH/PDL, PWH/PWL, PMH/PML for bias and liquidity.
Intraday planning around Asia/London range breaks, retests, and overlaps with prior levels.
Disclaimer
This tool is for educational purposes only and is not financial advice. Markets involve risk; past performance does not guarantee future results.

London & NY Session Markers + Pip MovementThis indicator visually marks the London and New York trading sessions on your chart and optionally calculates the pip range (high-low movement) during each session. It's specifically designed for Forex traders, helping you identify volatility windows and analyze market movement within major session times.
🔍 Key Features:
✅ Session Open/Close Markers
Draws vertical dotted lines at:
London Open (08:00 UK time)
London Close (11:00 UK time)
New York Open (14:00 UK time)
New York Close (17:00 UK time)
Each marker is labeled clearly ("London Open", "NY Close", etc.)
Uses color-coding for easy identification:
Aqua for London
Lime for New York
✅ Pip Range Display (Optional)
Measures the high-low price movement during each session.
Converts this movement into pips, using:
0.0001 pip size for most pairs
0.01 pip size for JPY pairs (auto-detected)
Displays a label (e.g., "London: 42.5 pips") above the candle at session close.
This feature can be toggled on/off via the settings panel.
✅ Time-Zone Aware
Session times are aligned to Europe/London time zone.
Adjusts automatically for Daylight Saving Time (DST).
✅ User Controls
Toggle visibility for:
London session markers
New York session markers
Pip range labels
📊 Use Cases:
Identify when liquidity and volatility increase, especially during session overlaps.
Analyze historical session-based volatility (e.g., compare NY vs. London pip ranges).
Combine with price action or indicator signals that work best in high-volume hours.
Optimize entry and exit timing based on session structure.
⚙️ Best Timeframes:
5-min to 1-hour charts for precise session tracking.
Works on Forex and CFD pairs with standard tick sizes.
⚠️ Notes:
This tool does not repaint and uses only completed bar data.
Pip calculation is based on the chart’s current symbol and tick size.
Designed for spot FX, not intended for cryptocurrencies or synthetic indices.
✅ Ideal For:
Forex Day Traders
Session-based Strategy Developers
London Breakout or NY Reversal Traders
Anyone analyzing volatility by session windows

High-Mid-Low 200 Day and Buy Levels and labels
Volume-Scaled PVR with Dynamic Buy Levels (ETF investing Visual Aid)
Description
This indicator is designed primarily for exchange-traded fund (ETF) traders and investors who seek a broad, visual tool to assist in identifying favorable buy and sell regions based on key price levels in relation to High and Lows of the ETF.
Key Features
Lookback Reference Levels:
Automatically identifies and plots key price levels within a user-defined lookback period:
Period High: Highest price in the lookback window.
Period Low: Lowest price in the lookback window.
Mid-Line: Midpoint between the period high and low.
Detailed Percentage Labels:
Displays percentage distances from the current price to the period high, period low, and their respective most recent occurrences, along with bar-counts for context, allowing quick assessment of price positioning relative to significant recent highs and lows.
Dynamic Buy-Level Lines for Multiple ETFs:
Supports a configurable list of ETF tickers with predefined buy price levels. When charting one of these ETFs, a horizontal line and label mark the specified buy price level, serving as a visual reminder or guide for entries.
Lightweight and Visual:
Designed to overlay directly on price charts with minimal clutter, providing clean and insightful visual references to inform buy-low and sell-high decisions.
How It Helps You
Offers broad, contextual cues to guide "buy low, sell high" strategies on ETFs by visualizing:
Where price currently stands within recent high/low ranges.
Specific buy price levels personalized for tracked ETFs as a check before committing.
Flexible lookback parameters allow tuning sensitivity to your preferred timeframes and trading style.
Usage Notes
Customize the list of ETFs and associated buy prices within the script via arrays to suit your watchlist. (Make a working copy to update Arrays, ensure pair matching).
Best applied on daily or higher timeframes for clearer trend dynamics.
This is a visual aid and should be combined with your own analysis and risk management techniques and other standard/established indicators.

Swing High/Low with Liquidity Sweeps🧠 Overview
This indicator identifies swing highs and swing lows based on user-defined candle lengths and checks for liquidity sweeps—situations where the price breaks a previous swing level but then closes back inside, indicating a potential false breakout or stop hunt. It also supports visual labeling and alerts for these events.
⚙️ Inputs
Swing Length (must be odd number ≥ 3):
Determines how many candles are used to identify swing highs/lows. The central candle must be higher or lower than all neighbors within the range.
Example: If swingLength = 5, the central candle must be higher/lower than the 2 candles on both sides.
Sweep Lookback (bars):
Defines how many bars to look back for possible liquidity sweeps.
Show Swing Labels (checkbox):
Optionally display labels on the chart when a swing high or low is detected.
Show Sweep Labels (checkbox):
Optionally display labels on the chart when a liquidity sweep occurs.
🕯️ Swing Detection Logic
A Swing High is detected when the high of the central candle is greater than the highs of all candles around it (as per the defined length).
A Swing Low is detected when the low of the central candle is lower than the lows of surrounding candles.
Swing labels are placed slightly above (for highs) or below (for lows) the candle.
💧 Liquidity Sweep Logic
A Sweep High is triggered if:
The current high breaks above a previously detected swing high,
And then the candle closes below that swing high,
Within the configured lookback window.
A Sweep Low is triggered if:
The current low breaks below a previous swing low,
And then closes above it,
Within the lookback window.
These are often seen as stop hunts or fake breakouts.
🔔 Alerts
Sweep High Alert: Triggered when a sweep above a swing high occurs.
Sweep Low Alert: Triggered when a sweep below a swing low occurs.
You can use these to set up TradingView alerts to notify you of potential liquidity grabs.
📊 Use Cases
Identifying market structure shifts.
Spotting fake breakouts and potential reversals.
Assisting in smart money concepts and liquidity-based trading.
Supporting entry timing in trend continuation or reversal strategies.

Timeframe Resistance Evaluation And Detection - CoffeeKillerTREAD - Timeframe Resistance Evaluation And Detection Guide
🔔 Important Technical Limitation 🔔
**This indicator does NOT fetch true higher timeframe data.** Instead, it simulates higher timeframe levels by aggregating data from your current chart timeframe. This means:
- Results will vary depending on what chart timeframe you're viewing
- Levels may not match actual higher timeframe candle highs/lows
- You might miss important wicks or gaps that occurred between chart timeframe bars
- **Always verify levels against actual higher timeframe charts before trading**
Welcome traders! This guide will walk you through the TREAD (Timeframe Resistance Evaluation And Detection) indicator, a multi-timeframe analysis tool developed by CoffeeKiller that identifies support and resistance confluence across different time periods.(I am 50+ year old trader and always thought I was bad a teaching and explaining so you get a AI guide. I personally use this on the 5 minute chart with the default settings, but to each there own and if you can improve the trend detection methods please DM me. I would like to see the code. Thanks)
Core Components
1. Dual Timeframe Level Tracking
- Short Timeframe Levels: Tracks opening price extremes within shorter periods
- Long Timeframe Levels: Tracks actual high/low extremes within longer periods
- Dynamic Reset Mechanism: Levels reset at the start of each new timeframe period
- Momentum Detection: Identifies when levels change mid-period, indicating active price movement
2. Visual Zone System
- High Zones: Areas between long timeframe highs and short timeframe highs
- Low Zones: Areas between long timeframe lows and short timeframe lows
- Fill Coloring: Dynamic colors based on whether levels are static or actively changing
- Momentum Highlighting: Special colors when levels break during active periods
3. Customizable Display Options
- Multiple Plot Styles: Line, circles, or cross markers
- Flexible Timeframe Selection: Wide range of short and long timeframe combinations
- Color Customization: Separate colors for each level type and momentum state
- Toggle Controls: Show/hide different elements based on trading preference
Main Features
Timeframe Settings
- Short Timeframe Options: 15m, 30m, 1h, 2h, 4h
- Long Timeframe Options: 1h, 2h, 4h, 8h, 12h, 1D, 1W
- Recommended Combinations:
- Scalping: 15m/1h or 30m/2h
- Day Trading: 30m/4h or 1h/4h
- Swing Trading: 4h/1D or 1D/1W
Display Configuration
- Level Visibility: Toggle short/long timeframe levels independently
- Fill Zone Control: Enable/disable colored zones between levels
- Momentum Fills: Special highlighting for actively changing levels
- Line Customization: Width, style, and color options for all elements
Color System
- Short TF High: Default red for resistance levels
- Short TF Low: Default green for support levels
- Long TF High: Transparent red for broader resistance context
- Long TF Low: Transparent green for broader support context
- Momentum Colors: Brighter colors when levels are actively changing
Technical Implementation Details
How Level Tracking Works
The indicator uses a custom tracking function that:
1. Detects Timeframe Periods: Uses `time()` function to identify when new periods begin
2. Tracks Extremes: Monitors highest/lowest values within each period
3. Resets on New Periods: Clears tracking when timeframe periods change
4. Updates Mid-Period: Continues tracking if new extremes are reached
The Timeframe Limitation Explained
`pinescript
// What the indicator does:
short_tf_start = ta.change(time(short_timeframe)) != 0 // Detects 30m period start
= track_highest(open, short_tf_start) // BUT uses chart TF opens!
// What true multi-timeframe would be:
// short_tf_high = request.security(syminfo.tickerid, short_timeframe, high)
`
This means:
- On a 5m chart with 30m/4h settings: Tracks 5m bar opens during 30m and 4h windows
- On a 1m chart with same settings: Tracks 1m bar opens during 30m and 4h windows
- Results will be different between chart timeframes
- May miss important price action that occurred between your chart's bars
Visual Elements
1. Level Lines
- Short TF High: Upper resistance line from shorter timeframe analysis
- Short TF Low: Lower support line from shorter timeframe analysis
- Long TF High: Broader resistance context from longer timeframe
- Long TF Low: Broader support context from longer timeframe
2. Zone Fills
- High Zone: Area between long TF high and short TF high (potential resistance cluster)
- Low Zone: Area between long TF low and short TF low (potential support cluster)
- Regular Fill: Standard transparency when levels are static
- Momentum Fill: Enhanced visibility when levels are actively changing
3. Dynamic Coloring
- Static Periods: Normal colors when levels haven't changed recently
- Active Periods: Momentum colors when levels are being tested/broken
- Confluence Zones: Different intensities based on timeframe alignment
Trading Applications
1. Support/Resistance Trading
- Entry Points: Trade bounces from zone boundaries
- Confluence Areas: Focus on areas where short and long TF levels cluster
- Zone Breaks: Enter on confirmed breaks through entire zones
- Multiple Timeframe Confirmation: Stronger signals when both timeframes align
2. Range Trading
- Zone Boundaries: Use fill zones as range extremes
- Mean Reversion: Trade back toward opposite zone when price reaches extremes
- Breakout Preparation: Watch for momentum color changes indicating potential breakouts
- Risk Management: Place stops outside the opposite zone
3. Trend Following
- Direction Bias: Trade in direction of zone breaks
- Pullback Entries: Enter on pullbacks to broken zones (now support/resistance)
- Momentum Confirmation: Use momentum coloring to confirm trend strength
- Multiple Timeframe Alignment: Strongest trends when both timeframes agree
4. Scalping Applications
- Quick Bounces: Trade rapid moves between zone boundaries
- Momentum Signals: Enter when momentum colors appear
- Short-Term Targets: Use opposite zone as profit target
- Tight Stops: Place stops just outside current zone
Optimization Guide
1. Timeframe Selection
For Different Trading Styles:
- Scalping: 15m/1h - Quick levels, frequent updates
- Day Trading: 30m/4h - Balanced view, good for intraday moves
- Swing Trading: 4h/1D - Longer-term perspective, fewer false signals
- Position Trading: 1D/1W - Major structural levels
2. Chart Timeframe Considerations
**Important**: Your chart timeframe affects results
- Lower Chart TF: More granular level tracking, but may be noisy
- Higher Chart TF: Smoother levels, but may miss important price action
- Recommended: Use chart timeframe 2-4x smaller than short indicator timeframe
3. Display Settings
- Busy Charts: Disable fills, show only key levels
- Clean Analysis: Enable all fills and momentum coloring
- Multi-Monitor Setup: Use different color schemes for easy identification
- Mobile Trading: Increase line width for visibility
Best Practices
1. Level Verification
- Always Cross-Check: Verify levels against actual higher timeframe charts
- Multiple Timeframes: Check 2-3 different chart timeframes for consistency
- Price Action Confirmation: Wait for candlestick confirmation at levels
- Volume Analysis: Combine with volume for stronger confirmation
2. Risk Management
- Stop Placement: Use zones rather than exact prices for stops
- Position Sizing: Reduce size when zones are narrow (higher risk)
- Multiple Targets: Scale out at different zone boundaries
- False Break Protection: Allow for minor zone penetrations
3. Signal Quality Assessment
- Momentum Colors: Higher probability when momentum coloring appears
- Zone Width: Wider zones often provide stronger support/resistance
- Historical Testing: Backtest on your preferred timeframe combinations
- Market Conditions: Adjust sensitivity based on volatility
Advanced Features
1. Momentum Detection System
The indicator tracks when levels change mid-period:
`pinescript
short_high_changed = short_high != short_high and not short_tf_start
`
This identifies:
- Active level testing
- Potential breakout situations
- Increased market volatility
- Trend acceleration points
2. Dynamic Color System
Complex conditional logic determines fill colors:
- Static Zones: Regular transparency for stable levels
- Active Zones: Enhanced colors for changing levels
- Mixed States: Different combinations based on user preferences
- Custom Overrides: User can prioritize certain color schemes
3. Zone Interaction Analysis
- Convergence: When short and long TF levels approach each other
- Divergence: When timeframes show conflicting levels
- Alignment: When both timeframes agree on direction
- Transition: When one timeframe changes while other remains static
Common Issues and Solutions
1. Inconsistent Levels
Problem: Levels look different on various chart timeframes
Solution: Always verify against actual higher timeframe charts
2. Missing Price Action
Problem: Important wicks or gaps not reflected in levels
Solution: Use chart timeframe closer to indicator's short timeframe setting
3. Too Many Signals
Problem: Excessive level changes and momentum alerts
Solution: Increase timeframe settings or reduce chart timeframe granularity
4. Lagging Signals
Problem: Levels seem to update too slowly
Solution: Decrease chart timeframe or use more sensitive timeframe combinations
Recommended Setups
Conservative Approach
- Timeframes: 4h/1D
- Chart: 1h
- Display: Show fills only, no momentum coloring
- Use: Swing trading, position management
Aggressive Approach
- Timeframes: 15m/1h
- Chart: 5m
- Display: All features enabled, momentum highlighting
- Use: Scalping, quick reversal trades
Balanced Approach
- Timeframes: 30m/4h
- Chart: 15m
- Display: Selective fills, momentum on key levels
- Use: Day trading, multi-session analysis
Final Notes
**Remember**: This indicator provides a synthetic view of multi-timeframe levels, not true higher timeframe data. While useful for identifying potential confluence areas, always verify important levels by checking actual higher timeframe charts.
**Best Results When**:
- Combined with actual multi-timeframe analysis
- Used for confluence confirmation rather than primary signals
- Applied with proper risk management
- Verified against price action and volume
**DISCLAIMER**: This indicator and its signals are intended solely for educational and informational purposes. The timeframe limitation means results may not reflect true higher timeframe levels. Always conduct your own analysis and verify levels independently before making trading decisions. Trading involves significant risk of loss.

Killzones [Plug&Play]Highlight the most important institutional trading hours with precision.
The Setup Agent Killzones indicator automatically plots vertical lines to mark the key “Killzone” windows each day — London (08:00–09:00) and New York (15:00–16:00), shown in UK time. These timeframes represent periods of high volatility, where smart money activity is most likely to create the day’s major moves.
How it works:
Instantly visualise the London and New York Killzones with subtle vertical lines.
Customise which sessions to show to fit your trading style.
Stay focused on the windows where market makers are most active.
Perfect for intraday traders and anyone using session-based strategies.
Combine with our session indicator for a complete Plug&Play edge.
