Volume Order Block Scanner [BOSWaves]Volume Order Block Scanner - Dynamic Detection of High-Volume Supply and Demand Zones
Overview
The Volume Order Block Scanner introduces a refined approach to institutional zone mapping, combining volume-weighted order flow, structural displacement, and ATR-based proportionality to identify regions of aggressive participation from large entities.
Unlike static zone mapping or simplistic body-size filters, this framework dynamically evaluates each candle through a multi-layer model of relative volume, candle structure, and volatility context to isolate genuine order block formations while filtering out market noise.
Each identified zone represents a potential institutional footprint, defined by significant volume surges and efficient body-to-ATR relationships that indicate purposeful positioning. Once mapped, each order block is dynamically adjusted for volatility and tracked throughout its lifecycle - from creation to mitigation to potential invalidation - producing an evolving liquidity map that adapts with price.
This adaptive behavior allows traders to visualize where liquidity was absorbed and where it remains unfilled, revealing the structural foundation of institutional intent across timeframes.
Theoretical Foundation
At its core, the Volume Order Block Scanner is built on the interaction between volume displacement and structural imbalance. Traditional order block systems often rely on fixed candle formations or simple engulfing logic, neglecting the fundamental driver of institutional activity: volume concentration relative to volatility.
This framework redefines that approach. Each candle is filtered through two comparative ratios:
Relative Volume Ratio (RVR) - the candle’s volume compared to its rolling average, confirming genuine transactional surges.
Body-ATR Ratio (BAR) - a measure of displacement efficiency relative to recent volatility, ensuring structural strength.
Only when both conditions align is an order block validated, marking a displacement event significant enough to create a lasting imbalance.
By embedding this logic within a volatility-adjusted environment, the system maintains scalability across asset classes and volatility regimes - equally effective in crypto, forex, or index markets.
How It Works
The Volume Order Block Scanner operates through a structured multi-stage process:
Displacement Detection - Identifies candles whose body and volume exceed dynamic thresholds derived from ATR and rolling volume averages. These represent the origin points of institutional aggression.
Zone Construction - Each qualified candle generates an order block with ATR-proportional dimensions to ensure consistency across instruments and timeframes. The zone includes two regions: Body Zone (the precise initiation point of displacement) and Wick Imbalance (the residual inefficiency representing unfilled liquidity).
Lifecycle Tracking - Each zone is continuously monitored for market interaction. Reactions within a defined window are classified as respected, mitigated, or invalidated, giving traders a data-driven sense of ongoing institutional relevance.
Volume Confirmation Layer - Reinforces signal integrity by ensuring that all detected blocks correspond with meaningful increases in transactional activity.
Temporal Decay Control - Zones that remain untested beyond a set period gradually lose visual and analytical weight, maintaining chart clarity and contextual precision.
Interpretation
The Volume Order Block Scanner visualizes how institutional participants interact with the market through zones of accumulation and distribution.
Bullish order blocks denote demand imbalances where price displaced upward under high volume; bearish order blocks signify supply regions formed by concentrated selling pressure.
Price revisiting these areas often reflects institutional re-entry or liquidity rebalancing, offering actionable insights for both continuation and reversal scenarios.
By continuously monitoring interaction and expiry, the framework enables traders to distinguish between active institutional footprints and historical liquidity artifacts.
Strategy Integration
The Volume Order Block Scanner integrates naturally into advanced structural and order-flow methodologies:
Liquidity Mapping : Identify high-volume regions that are likely to influence future price reactions.
Break-of-Structure Confirmation : Validate BOS and CHOCH signals through aligned order block behavior.
Volume Confluence : Combine with BOSWaves volume or momentum indicators to confirm real institutional intent.
Smart-Money Frameworks : Utilize order block retests as precision entry zones within SMC-based setups.
Trend Continuation : Filter zones in line with higher-timeframe bias to maintain directional integrity.
Technical Implementation Details
Core Engine : Dual-filter mechanism using Relative Volume Ratio (RVR) and Body-ATR Ratio (BAR).
Volatility Framework : ATR-based scaling for cross-asset proportionality.
Zone Composition : Body and wick regions plotted independently for visual clarity of imbalance.
Lifecycle Logic : Real-time monitoring of reaction, mitigation, and invalidation states.
Directional Coloring : Distinct bullish and bearish shading with adjustable transparency.
Computation Efficiency : Lightweight structure suitable for multi-timeframe or multi-asset environments.
Optimal Application Parameters
Timeframe Guidance:
5m - 15m : Reactive intraday zones for short-term liquidity engagement.
1H - 4H : Medium-term structures for swing or intraday trend mapping.
Daily - Weekly : Macro accumulation and distribution footprints.
Suggested Configuration:
Relative Volume Threshold : 1.5× - 2.0× average volume.
Body-ATR Threshold : 0.8× - 1.2× for valid displacement.
Zone Expiry : 5 - 10 bars for intraday use, 15 - 30 for swing/macro contexts.
Parameter optimization should be asset-specific, tuned to volatility conditions and liquidity depth.
Performance Characteristics
High Effectiveness:
Markets exhibiting clear displacement and directional flow.
Environments with consistent volume expansion and liquidity inefficiencies.
Reduced Effectiveness:
Range-bound markets with frequent false impulses.
Low-volume sessions lacking institutional participation.
Integration Guidelines
Confluence Framework : Pair with structure-based BOS or liquidity tools for validation.
Risk Management : Treat active order blocks as contextual areas of interest, not guaranteed reversal points.
Multi-Timeframe Logic : Derive bias from higher-timeframe blocks and execute from refined lower-timeframe structures.
Volume Verification : Confirm each reaction with concurrent volume acceleration to avoid false liquidity cues.
Disclaimer
The Volume Order Block Scanner is a quantitative mapping framework designed for professional traders and analysts. It is not a predictive or guaranteed system of profit.
Performance depends on correct configuration, market conditions, and disciplined risk management. BOSWaves recommends using this indicator as part of a comprehensive analytical process - integrating structural, volume, and liquidity context for accurate interpretation.
Tìm kiếm tập lệnh với "zone"

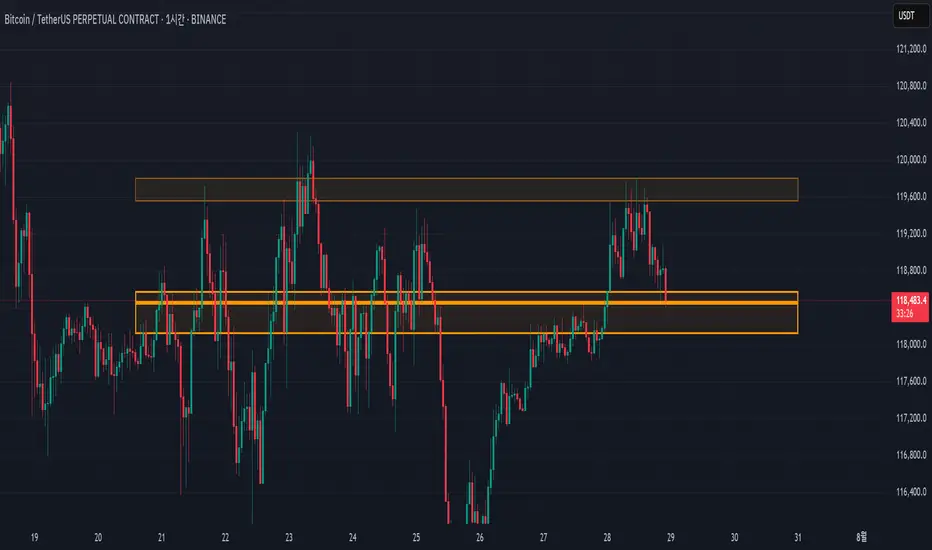
Support/Resistance MTF Merge ZonesIndicator Introduction
Support/Resistance MTF Merge Zones is an advanced technical analysis tool that automatically identifies and merges key support/resistance zones by analyzing highs and lows from multiple timeframes (15M, 1H, 4H, Daily).
Key Features
Multi-Timeframe Analysis: Integrates data from 15M, 1H, 4H, and Daily charts
Smart Zone Merging: Automatically consolidates levels within a specified percentage range into unified zones
Dynamic Color System: Distinguishes support/resistance zones based on position relative to current price
Strength Indication: Highlights zones where multiple levels converge as strong zones
Usage Guide
Configuration Parameters
Lookback Period (10): Period for calculating highs/lows
Adjustable range: 5-30
Higher values detect more long-term levels
Zone Merge % (0.5): Percentage threshold for zone merging
Range: 0.1-2.0%
Higher values merge levels across wider price ranges
Min Levels for Zone (2): Minimum number of levels required to form a zone
Range: 2-5 levels
Higher values display only more confirmed zones
Box Opacity (7): Transparency level of zone boxes
Range: 0-100%
Color Scheme
Red: Resistance zones above current price
Blue: Support zones below current price
Orange: Strong zones (3+ merged levels)
Volatility Zones (STDEV %)This indicator displays the relative volatility of an asset as a percentage, based on the standard deviation of price over a custom length.
🔍 Key features:
• Uses standard deviation (%) to reflect recent price volatility
• Classifies volatility into three zones:
Low volatility (≤2%) — highlighted in blue
Medium volatility (2–4%) — highlighted in orange
High volatility (>4%) — highlighted in red
• Supports visual background shading and colored line output
• Works on any timeframe and asset
📊 This tool is useful for identifying low-risk entry zones, periods of expansion or contraction in price behavior, and dynamic market regime changes.
You can adjust the STDEV length to suit your strategy or timeframe. Best used in combination with your entry logic or trend filters.

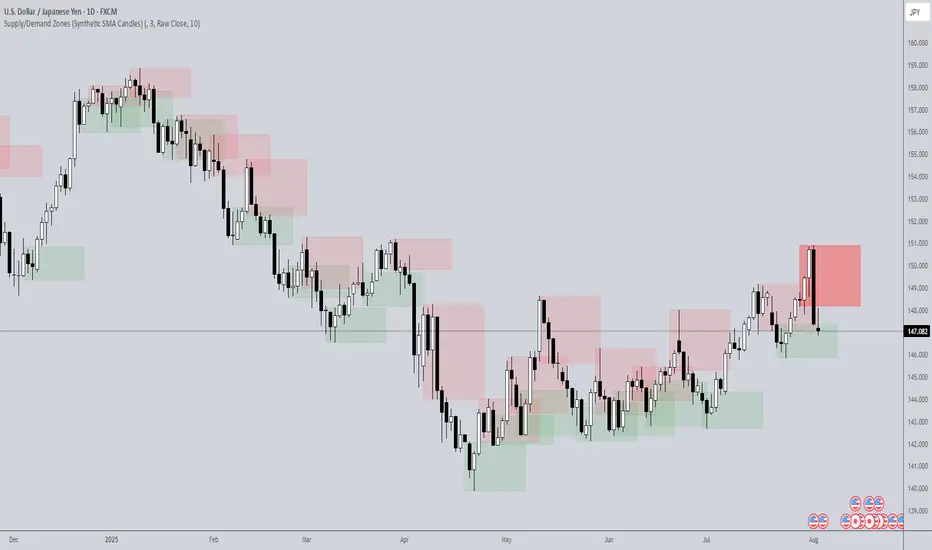
Supply/Demand Zones (Synthetic SMA Candles)Supply/Demand Zones (Synthetic SMA Candles)
Created by The_Forex_Steward
This indicator highlights institutional-style supply and demand zones using synthetic SMA-based candles rather than raw price data. It provides a smoother, more refined view of price action to help identify key imbalance areas where price is likely to react.
Features:
- Uses SMA-smoothed synthetic candles to detect bullish and bearish engulfing structures
- Draws demand zones after bullish breakouts and supply zones after bearish breakouts
- Zones are persistent for a customizable number of bars
- Mitigated zones can optionally be removed from the chart
- Includes alerts for breakout and mitigation events
- Optional plotting of synthetic candles over price for visual clarity
How It Works:
When a synthetic candle closes above the high of a previous bearish candle, a bullish engulfing is detected, and a demand zone is created from that bearish candle’s high and low. Conversely, when price closes below the low of a previous bullish candle, a supply zone is formed. These zones stay on the chart for the user-defined duration or until they are mitigated by price, at which point they can be removed automatically.
How to Use:
- Adjust the SMA Length to control how smooth the synthetic candles appear
- Enable or disable Show Supply Zones and Show Demand Zones as needed
- Set the Zone Duration to control how long each zone persists
- Use Delete Mitigated Zones to automatically remove zones when price returns to them
- Optionally enable Show Synthetic SMA Candles to see the candle logic used in detection
- Use the built-in alerts to stay notified of new zone creation or mitigation
Note: This tool is most effective when combined with structure or trend-based strategies for confirmation.
Mayer Multiple Zones (Crypto)Enhanced Mayer Multiple Zones
Advanced crypto valuation zones with ETH/BTC context
Key Features
Shows 6 price zones based on MA200 multiples (bubble, take profit, fair value, accumulation, value buy, strong buy)
Adds ETH/BTC ratio context for stronger signals
Works on any crypto with sufficient price history ( ETH , SOL , AAVE , etc)
Color intensity changes based on market conditions
How to Read
Color Zones : Price relative to its MA200 history
Zone Opacity : Stronger color = stronger signal (influenced by ETH/BTC context)
Status Box : Shows current "Enhanced Status" combining price level with ETH/BTC context
Context Line : Explains why the signal is strong or weak
Buy/Sell Signals
Strong Buy Signals :
• " EXTREME VALUE " (blue zone + BTC dominance)
• " STRONG VALUE BUY " (cyan zone + BTC preference)
Take Profit Signals :
• " CONFIRMED BUBBLE " (purple zone + altcoin dominance)
• " APPROACHING BUBBLE " (red zone + rising altcoin strength)
Customization
Adjust multiple thresholds (0.6x, 0.8x, 2.0x, 2.5x, 3.0x)
Toggle ETH/BTC context analysis
Configure ETH/BTC thresholds for market bias
Change MA length from default 200
This indicator helps identify optimal entry and exit points by watching the vertical color streaks on your chart. Look for deep blue/cyan zones with high opacity for strong buying opportunities, and intense purple/red zones for potential exits. The darker the color intensity, the stronger the signal—no complex interpretation needed!

ATR Levels and Zones with Signals📌 ATR Levels and Zones with Signals – User Guide Description
🔹 Overview
The ATR Levels and Zones with Signals indicator is a volatility-based trading tool that helps traders identify:
✔ Key support & resistance levels based on ATR (Average True Range)
✔ Buy & Sell signals triggered when price enters key ATR zones
✔ Breakout confirmations to detect high-momentum moves
✔ Dynamic Stop-Loss & Take-Profit suggestions
Unlike traditional ATR bands, this indicator creates layered ATR zones based on multiple ATR multipliers, allowing traders to gauge volatility and risk-adjust their trading strategies.
🔹 How It Works
🔸 The script calculates a baseline SMA (Simple Moving Average) of the price.
🔸 ATR (Average True Range) is then used to create six dynamic price levels above & below the baseline.
🔸 These levels define different risk zones—higher levels indicate increased volatility and potential trend exhaustion.
📈 ATR Zones Explained
🔹 Lower ATR Levels (Buying Opportunities)
📉 Lower Level 1-2 → Mild Oversold Zone (Potential trend continuation)
📉 Lower Level 3-4 → High Volatility Buy Zone (Aggressive traders start scaling in)
📉 Lower Level 5-6 → Extreme Oversold Zone (High-Risk Reversal Area)
🔹 If price enters these lower zones, it may indicate a potential buying opportunity, especially if combined with trend reversal confirmation.
🔹 Upper ATR Levels (Selling / Take Profit Zones)
📈 Upper Level 1-2 → Mild Overbought Zone (Potential pullback area)
📈 Upper Level 3-4 → High Volatility Sell Zone (Aggressive traders start scaling out)
📈 Upper Level 5-6 → Extreme Overbought Zone (High-Risk for Reversal)
🔹 If price enters these upper zones, it may indicate a potential selling opportunity or trend exhaustion, especially if momentum slows.
🔹 Sensitivity Modes
🔹 Aggressive Mode (More Frequent Signals) → Triggers buy/sell signals at Lower/Upper Level 3 & 4
🔹 Conservative Mode (Stronger Confirmation) → Triggers buy/sell signals at Lower/Upper Level 5 & 6
📌 Choose the mode based on your trading style:
✔ Scalpers & short-term traders → Use Aggressive Mode
✔ Swing & trend traders → Use Conservative Mode for stronger confirmations
🚀 How to Use the Indicator
🔹 For Trend Trading:
✅ Buy when price enters the lower ATR zones (especially in uptrends).
✅ Sell when price enters the upper ATR zones (especially in downtrends).
🔹 For Breakout Trading:
✅ Breakout Buy: Price breaks above Upper ATR Level 3 → Momentum entry for trend continuation
✅ Breakout Sell: Price breaks below Lower ATR Level 3 → Momentum short opportunity
🔹 Stop-Loss & Take-Profit Suggestions
🚨 Stop-Loss: Suggested at Lower ATR Level 6 (for longs) or Upper ATR Level 6 (for shorts)
🎯 Take-Profit: Suggested at Upper ATR Level 3 (for longs) or Lower ATR Level 3 (for shorts)
🔹 Why This Indicator is Unique
✔ Multiple ATR layers for better risk-adjusted trading decisions
✔ Combines ATR-based zones with SMA trend confirmation
✔ Both aggressive & conservative trading modes available
✔ Includes automatic stop-loss & take-profit suggestions
✔ Breakout signals for momentum traders
📢 Final Notes
✅ Free & open-source for the TradingView community!
⚠ Risk Warning: Always confirm signals with other confluences (trend, volume, support/resistance) before trading.
📌 Developed by: Maddog Blewitt
📩 Feedback & improvements are welcome! 🚀

Thin Liquidity Zones [PhenLabs]Thin Liquidity Zones with Volume Delta
Our advanced volume analysis tool identifies and visualizes significant liquidity zones using real-time volume delta analysis. This indicator helps traders pinpoint and monitor critical price levels where substantial trading activity occurs, providing precise volume flow measurement through lower timeframe analysis.
The tool works by leveraging the fact that hedge funds, institutions, and other large market participants strategically fill their orders in areas of thin liquidity to minimize slippage and market impact. By detecting these zones, traders gain valuable insights into potential areas of accumulation, distribution, and liquidity traps, allowing for more informed trading decisions.
🔍 Key Features
Real-time volume delta calculation using lower timeframe data
Dynamic zone creation based on volume spikes
Automatic timeframe optimization
Size-filtered zones to avoid noise
Custom delta timeframe scanning
Flexible analysis period selection
📊 Visual Demonstration
💡 How It Works
The indicator continuously scans for high-volume areas where trading activity exceeds the specified threshold (default 6.0x average volume). When detected, it creates zones that display the net volume delta, showing whether buying or selling pressure dominated that price level.
Key zone characteristics:
Size filtering prevents noise from large price swings
Volume delta shows actual buying/selling pressure
Zones automatically expire based on lookback period
Real-time updates as new volume data arrives
⚙️ Settings
Time Settings
Analysis Timeframe: 15M to 1W options
Custom Period: User-defined bar count
Delta Timeframe: Automatic or manual selection
Volume Analysis
Volume Threshold: Minimum spike multiple
Volume MA Length: Averaging period
Maximum Zone Size: Size filter percentage
Display Options
Zone Color: Customizable with transparency
Delta Display: On/Off toggle
Text Position: Left/Center/Right alignment
📌 Tips for Best Results
Adjust volume threshold based on instrument volatility
Monitor zone clusters for potential support/resistance
Consider reducing max zone size in volatile markets
Use in conjunction with price action and other indicators
⚠️ Important Notes
Requires volume data from your data provider
Lower timeframe scanning may impact performance
Maximum 500 zones maintained for optimization
Zone creation is filtered by both volume and size
🔧 Volume Delta Calculation
The indicator uses TradingView’s advanced volume delta calculation, which:
Scans lower timeframe data for precision
Measures actual buying vs selling pressure
Updates in real-time with new data
Provides clear positive/negative flow indication
This tool is ideal for traders focusing on volume analysis and order flow. It helps identify key levels where significant trading activity has occurred and provides insight into the nature of that activity through volume delta analysis.
Note: Performance may vary based on your chart’s timeframe. Adjust settings according to your trading style and the instrument’s characteristics. Past performance is not indicative of future results, DYOR.

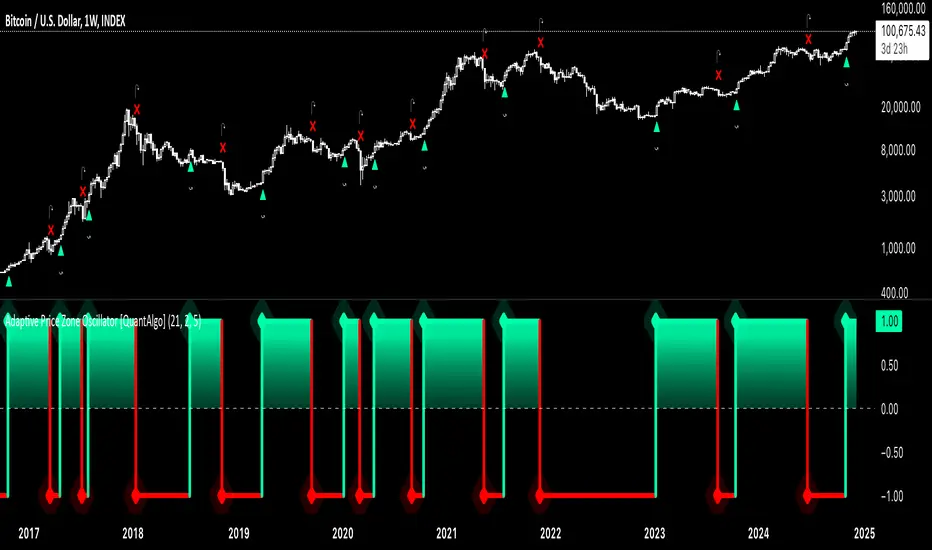
Adaptive Price Zone Oscillator [QuantAlgo]Adaptive Price Zone Oscillator 🎯📊
The Adaptive Price Zone (APZ) Oscillator by QuantAlgo is an advanced technical indicator designed to identify market trends and reversals through adaptive price zones based on volatility-adjusted bands. This sophisticated system combines typical price analysis with dynamic volatility measurements to help traders and investors identify trend direction, potential reversals, and market volatility conditions. By evaluating both price action and volatility together, this tool enables users to make informed trading decisions while adapting to changing market conditions.
💫 Dynamic Zone Architecture
The APZ Oscillator provides a unique framework for assessing market trends through a blend of smoothed typical prices and volatility-based calculations. Unlike traditional oscillators that use fixed parameters, this system incorporates dynamic volatility measurements to adjust sensitivity automatically, helping users determine whether price movements are significant relative to current market conditions. By combining smoothed price trends with adaptive volatility zones, it evaluates both directional movement and market volatility, while the smoothing parameters ensure stable yet responsive signals. This adaptive approach allows users to identify trending conditions while remaining aware of volatility expansions and contractions, enhancing both trend-following and mean-reversion strategies.
📊 Indicator Components & Mechanics
The APZ Oscillator is composed of several technical components that create a dynamic trending system:
Typical Price: Utilizes HLC3 (High, Low, Close average) as a balanced price representation
Volatility Measurement: Computes exponential moving average of price changes to determine dynamic zones
Smoothed Calculations: Applies additional smoothing to reduce noise while maintaining responsiveness
Trend Detection: Evaluates price position relative to adaptive zones to determine market direction
📈 Key Indicators and Features
The APZ Oscillator utilizes typical price with customizable length and threshold parameters to adapt to different trading styles. Volatility calculations are applied to determine zone boundaries, providing context-aware levels for trend identification. The trend detection component evaluates price action relative to the adaptive zones, helping validate trends and identify potential reversals.
The indicator also incorporates multi-layered visualization with:
Color-coded trend representation (bullish/bearish)
Clear trend state indicators (+1/-1)
Mean reversion signals with distinct markers
Gradient fills for better visual clarity
Programmable alerts for trend changes
⚡️ Practical Applications and Examples
✅ Add the Indicator : Add the indicator to your TradingView chart by clicking on the star icon to add it to your favorites ⭐️
👀 Monitor Trend State : Watch the oscillator's position relative to the zero line to identify trend direction and potential reversals. The step-line visualization with diamonds makes trend changes clearly visible.
🎯 Track Signals : Pay attention to the mean reversion markers that appear above and below the price chart:
→ Upward triangles (⤻) signal potential bullish reversals
→ X crosses (↷) indicate potential bearish reversals
🔔 Set Alerts : Configure alerts for trend changes in both bullish and bearish directions, ensuring you can act on significant technical developments promptly.
🌟 Summary and Tips
The Adaptive Price Zone Oscillator by QuantAlgo is a versatile technical tool, designed to support both trend following and mean reversion strategies across different market environments. By combining smoothed typical price analysis with dynamic volatility-based zones, it helps traders and investors identify significant trend changes while measuring market volatility, providing reliable technical signals. The tool's adaptability through customizable length, threshold, and smoothing parameters makes it suitable for various trading timeframes and styles, allowing users to capture opportunities while maintaining awareness of changing market conditions.
Key parameters to optimize for your trading style:
APZ Length: Adjust for more or less sensitivity to price changes
Threshold: Fine-tune the volatility multiplier for wider or narrower zones
Smoothing: Balance noise reduction with signal responsiveness
Ultimate ZonesThe story is simple: I didn't find a support/resistance zones indicator that I actually liked, so I made my own.
Features:
Independent of the chart timeframe (zones don't change if you switch timeframes) - very important for practical use
Live mode (repainting) plus historic mode (non-repainting)
Selectable timeframe for zone calculation (default: daily)
Can adjust how far the indicator looks back into the past (default: 500 days)
Can adjust pivot period to find more or fewer zones
Zone heights are based on long-term ATR (to adapt to the asset's volatility automatically)
Price tolerance multiplier is adjustable
Option to merge zones which are close together into one ("fat zones")
I find that together these options (especially those in the "sensitivity" section) allow me to automatically generate almost all the zones I want to see. Occasionally, I do draw some additional zones to get the perfect image I'm looking for on the chart.
Explanation
We detect pivot points on the selected zone timeframe (taking pivot period and lookback limit into account). Then we combine these pivot points into a zone if they are close enough together in price (here the tolerance parameter comes into play). If "fat zones" is selected, we perform these merges more aggressively even if the resulting zone becomes taller than the standard tolerance.
The ATR used for the tolerance is a 500 period ATR, but if there are less than 500 bars available, we use the average of the bars available so far, so we always have a value to work with.
In order for a zone to be displayed, it must have been touched by at least 2 separate pivot points. We do not distinguish between pivot highs and pivot lows because support is known to turn into resistance and vice versa.
In live mode, we draw the currently active zones as boxes.
In historic mode, we plot the active zones at each bar using "plot" and "fill", so there is no repainting or erasing, and you can see which zones were active at any past date. For practical reasons, we draw a maximum of 15 zones around the current price (i.e. 7-8 zones above and 7-8 zones below the price).

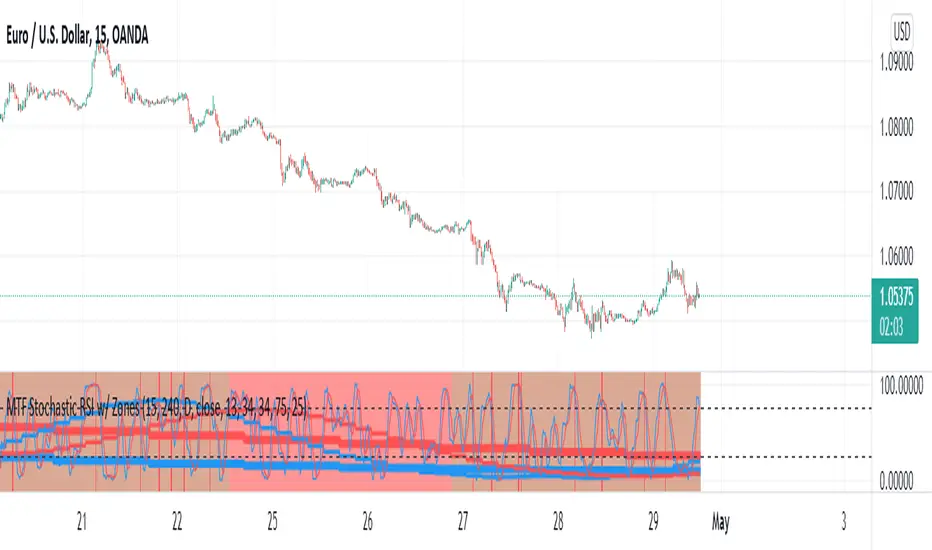
MTF Stochastic RSI w/ ZonesMTF Stochastic RSI w/ Zones by // © KaizenTraderB
I revamped my original Stochastic RSI Band indicator with more accurate algorithms, cleaner coding and more adjustable options.
I will be soon releasing a variation of this indicator that prints over price chart with key candle indicators
This indicator will display the Stochastic RSI in 3 Timeframes of your choice.
It will also display color zones. When the higher timeframe is bullish it will be green and when bullish, red.
When the middle timeframe is counter the higher, it will appear brownish.
The entry timeframe will print red and green lines at bullish and bearish Stochastic RSI crossovers when oversold and overbought, respectively,
In the direction of the higher timeframe directional bias when the middle timeframe is counter that direction to catch reversals in corrections.
The options allow you to turn the lines and zones on and off, as well as which Timeframes you choose to view.
Entry - 1Hr, 15m, 5m Middle Timeframe - 1Hr, 4Hr, Daily Higher Timeframe - 4Hr, Daily, Weekly or Monthly
You can also change the parameters of the Stochastic RSI for each of the three timeframes:
When 8 is chosen for RSI Length, Stochastic Length - 5, SmoothK - 3, Smooth D - 3 For 13 - 8, 5, 5 For 21 - 13, 8, 8 For 34 - 21, 13, 13
Its good practice to adjust settings so Higher Timeframe zones (green/red) correlate with longer trend movements,
Medium Timeframe with corrections and reversal areas (brown) and Entry Timeframe with key reversal candles.
Look at chart for last 200 bars or so and find the settings that correlate with recent past price action and adjust accordingly.
Its also good practice to have the chart timeframe correlate with entry timeframe of indicator.
You can also adjust overbought and oversold areas.
Coding included to prevent repainting
Message me with feedback to improve upon this indicator or requested additions.
ICT Liquidity Zone [KTY]ICT Liquidity Zone Indicator
Overview
This indicator automatically detects and displays Liquidity Zones based on ICT (Inner Circle Trader) methodology.
Liquidity zones are areas where stop-loss orders cluster around swing highs and lows. Smart money targets these zones to grab liquidity before reversing price direction.
Key Features
Multi-Timeframe Support
Display liquidity zones from two different timeframes simultaneously (LTF & HTF)
HTF liquidity zones represent more significant levels
Buyside & Sellside Liquidity
Buyside Liquidity: Areas above swing highs where short sellers' stops accumulate → Smart money sweeps these before selling
Sellside Liquidity: Areas below swing lows where long buyers' stops accumulate → Smart money sweeps these before buying
Volume Analysis
Displays relative volume percentage at liquidity formation
Higher percentage indicates stronger liquidity concentration
Mitigation Tracking
Liquidity zones are automatically removed when price sweeps through
Option to display swept zones for reference
How to Use
Identify liquidity pools above recent highs or below recent lows
Wait for a sweep — price breaks the level then quickly reverses
Look for confirmation using CHoCH, Order Blocks, or FVGs
Enter on the reversal, set stop beyond the swept level
Pro Tips:
Multiple equal highs/lows create stronger liquidity pools
Liquidity sweep + immediate reversal = high probability setup
Combine with Order Blocks and FVGs for confluence
HTF liquidity is more significant than LTF liquidity
Asian session highs/lows often become liquidity targets
Settings
SettingDescriptionLTF / HTFEnable and select timeframes for liquidity detectionBuyside Liquidity CountNumber of buyside zones to displaySellside Liquidity CountNumber of sellside zones to displayShow Mitigated LiquidityRemove or Show swept liquidity zonesLabel ColorCustomize text color inside liquidity boxes
Alerts
🔴 Buyside Liquidity Detected
🟢 Sellside Liquidity Detected
🔴 Buyside Liquidity Break
🟢 Sellside Liquidity Break
🔴 Buyside Liquidity Touched
🟢 Sellside Liquidity Touched
Notes
This indicator is designed for educational purposes
Distinguish between genuine breakouts and liquidity sweeps
Always combine with proper risk management
If you find this indicator helpful, please leave a like and follow for more ICT-based tools!

Gold/Silver Ratio with Supply ZonesGold/Silver Ratio with Supply Zones
Overview
Professional-grade indicator that tracks the Gold/Silver Ratio in real-time
Identifies potential market imbalances and rotation opportunities between precious metals
Features customizable threshold bands, moving averages, and automated trading signals
Built on Pine Script v6 for maximum stability and performance
Key Features
Real-Time Ratio Calculation : Automatically calculates Gold/Silver ratio using OANDA:XAUUSD and OANDA:XAGUSD price feeds
Dynamic Threshold Zones : Visual bands showing when silver or gold may be undervalued relative to each other
Moving Average Overlay : 20-period SMA to identify trend direction and momentum
Automated Buy Signals : Triangle markers appear when ratio reaches extreme levels
Live Information Table : Displays current ratio, moving average, individual metal prices, and market interpretation
Custom Alerts : Set notifications when ratio crosses your defined thresholds
Color-Coded Zones : Green zones indicate gold undervaluation, red zones indicate silver undervaluation
Trading Applications
Mean Reversion Strategy : Enter silver positions when ratio exceeds 90, enter gold when ratio falls below 70
Rotation Trading : Switch between metals based on relative value signals
Portfolio Rebalancing : Identify optimal times to adjust precious metals allocation
Divergence Analysis : Compare ratio behavior against individual metal price action
Default Settings
High Threshold : 90.0 (Silver undervalued zone)
Low Threshold : 70.0 (Gold undervalued zone)
Moving Average : 20-period SMA
Historical Reference : 80:1 ratio marked as long-term mean
How to Interpret
Ratio Above 90 : Silver is undervalued relative to gold - consider increasing silver exposure
Ratio Below 70 : Gold is undervalued relative to silver - consider increasing gold exposure
Ratio Between 70-90 : Neutral range - no clear relative value advantage
Rising Ratio : Gold outperforming silver
Falling Ratio : Silver outperforming gold
Signal Logic
Green Triangle (Bottom) : Ratio crosses above high threshold → Buy Silver Signal
Red Triangle (Top) : Ratio crosses below low threshold → Buy Gold Signal
MA Crossovers : Use 20-period MA for trend confirmation and entry timing
Visual Elements
Blue Line : Current gold/silver ratio value
Orange Line : 20-period moving average smoothing
Red Shaded Zone : Area where gold is relatively expensive
Green Shaded Zone : Area where gold is relatively cheap
Gray Dotted Line : Historical mean at 80:1
Info Table : Real-time statistics and market interpretation
Best Practices
Use on daily timeframe or higher for most reliable signals
Combine with volume analysis and individual metal technicals
Monitor Federal Reserve policy and USD strength as macro context
Consider industrial demand factors for silver (solar, EV, electronics)
Watch safe-haven flows during economic uncertainty for gold
Customization Options
Adjust threshold levels based on your preferred lookback period
Modify moving average length to suit your trading timeframe
Toggle bands on/off for cleaner chart visualization
Change data source tickers if using different brokers (FXCM, FOREXCOM, etc.)
Alert Conditions
Silver Undervalued Alert : Triggers when ratio crosses above your high threshold
Gold Undervalued Alert : Triggers when ratio crosses below your low threshold
Receive notifications via TradingView mobile app , email , or webhook
Who This Is For
Precious metals traders seeking relative value opportunities
Portfolio managers balancing gold and silver allocations
Macro traders using metals as inflation hedges
Swing traders capitalizing on mean reversion patterns
Long-term investors optimizing entry points
Important Notes
This indicator tracks price ratios , not physical supply data
COMEX warehouse stocks are not directly available in TradingView
Ratio analysis assumes historical mean reversion tendencies
Always combine with fundamental analysis and risk management
Past performance does not guarantee future results
Data Sources
Gold Price : OANDA:XAUUSD (spot gold in US dollars)
Silver Price : OANDA:XAGUSD (spot silver in US dollars)
Update Frequency : Real-time during market hours
Historical Data : Full TradingView historical coverage available

RDI Price ZonesOverview
RDI Price Zones is a manual price-level visualization indicator.
It draws user-defined horizontal zones and a reference line to help visually organize important price areas on the chart.
This script does not calculate, infer, or fetch market data.
All levels are entered manually by the user.
What it draws
• Reference Line — A horizontal line at a user-defined price level.
• Upper Zones — Rectangular price areas drawn to the right of the chart.
• Lower Zones — Rectangular price areas drawn to the left of the chart.
These elements are purely visual and do not generate signals.
Inputs
• Up to three upper zone price levels (manual input).
• Up to three lower zone price levels (manual input).
• One reference price level.
• Zone thickness defined as a percentage of price.
• Optional color and border settings.
Design notes
• Zones are drawn as rectangles anchored to price levels.
• Rectangles extend a fixed number of bars for visualization purposes only.
• Percentage-based thickness allows zones to scale across different instruments.
Usage
This indicator is intended to help users visually map predefined price areas during a session.
It does not predict price movement, suggest trades, or provide trading signals.
Disclaimer
This script is provided for educational and visualization purposes only.
It does not offer trading advice, does not guarantee results, and should not be used as the sole basis for trading decisions.
Short summary (≤200 chars)
Manual price-zone visualization tool. Draws user-defined rectangular zones and a reference line. No calculations, no signals, no predictions. Educational use only.

Supply & Demand Zones (Volume-Based)📌 Supply & Demand Zones (Volume-Based) — Indicator Description
Overview
This indicator visually highlights potential supply and demand price zones using historical candle structure combined with relative volume behavior.The zones are intended to help users observe areas of increased market activity where price has previously reacted. This tool is designed for visual analysis only.
How the Zones Are Identified
Demand zones are highlighted when price shows a strong bullish reaction following a bearish candle.Supply zones are highlighted when price shows a strong bearish reaction following a bullish candle.Relative volume is used as context, not as a predictive input, to classify zones into higher or lower activity levels.Zones automatically invalidate when price structurally breaks them.
About the Percentage Display
The percentage shown on a zone represents normalized relative volume strength at the time the zone was formed.This value is not a probability, not a success rate, and not a performance metric.It should not be interpreted as a prediction or trading signal.Percentages are displayed only for active zones and are removed once a zone is invalidated.
How This Indicator Is Intended to Be Used
As a visual reference tool for identifying historical supply and demand areas.As a contextual overlay alongside other forms of technical analysis.To observe how price behaves when revisiting previously active zones.This indicator does not suggest trade direction, entry timing, or exit levels.
Important Notes & Limitations
All zones are derived from historical price and volume data.Market conditions change, and historical zones may lose relevance over time.No trading decisions should be made based solely on this indicator.Users are encouraged to apply their own analysis and risk management.
Disclaimer
This indicator is provided for educational and informational purposes only.It does not constitute trading, investment, or financial advice.The author assumes no responsibility for decisions made using this tool.

Hash Pivot DetectorHash Pivot Detector
Professional Support & Resistance Detection with Multi-Timeframe Zone Analysis
Developed by Hash Capital Research, the Hash Pivot Detector is a sophisticated indicator designed for identifying key support and resistance levels using pivot-based detection with institutional-grade zone analysis.
Key Features
Zone-Based Detection
Unlike traditional single-line S/R indicators, Hash Pivot Detector uses configurable zones around pivot levels to represent realistic institutional order areas. Adjustable zone width accommodates different asset volatilities.
Multi-Timeframe Analysis
Displays higher timeframe support/resistance levels alongside current timeframe pivots, providing crucial context for institutional positioning and stronger price barriers.
Clean Visual Design
Features Hash Capital's signature fluorescent color scheme (pink resistance, cyan support) optimized for dark charts with high contrast and instant visual recognition. Semi-transparent zones keep your chart clean and readable.
How It Works
The indicator uses pivot high/low detection with configurable left and right bar parameters. When a pivot is confirmed, it plots:
Primary support/resistance lines at pivot levels
Semi-transparent zones representing realistic order areas
Higher timeframe S/R levels as crosses for additional context
Recommended Settings
For Swing Trading:
Pivot Bars: 10-20 left/right
Zone Width: 0.5-1.0%
HTF: Daily (on 1H-4H charts)
For Intraday Trading:
Pivot Bars: 5-10 left/right
Zone Width: 0.3-0.5%
HTF: 1H or 4H (on 5min-15min charts)
Asset-Specific Zone Width:
Forex/Crypto: 0.3-0.5%
Stocks: 0.5-1.0%
Volatile Assets: 1.0-2.0%
What Makes It Different
✓ Zone-based approach (more realistic than lines)
✓ Multi-timeframe confluence detection
✓ Minimal visual clutter with maximum information
✓ Professional institutional aesthetic
✓ Comprehensive tooltips for easy optimization
✓ No repainting - all pivots are confirmed
Best Used For
Identifying high-probability entry/exit zones
Setting stop-loss and take-profit levels
Recognizing breakout/breakdown areas
Multi-timeframe confluence analysis
Swing trading and position trading
Intraday scalping with adjusted parameters
Notes
Works on all timeframes and markets
Fully customizable colors and parameters
All settings include detailed optimization guidance
Clean code, efficient performance
No alerts or notifications (visual analysis only)

Powerful Zone Detector (V19 - Hibrit)With the Powerful Zone Detector, you can easily identify support and resistance zones close to the price zone.

Basic Odds Enhancer: Supply Zone for ShortsHow to Use/Adjust:
On your chart, it marks bars where a 20-bar high coincides with high volume and bearish divergence—flag these as supply zones.
Tweak supply_threshold to 2.0 for stricter volume (fewer but stronger signals).
For zones, manually draw rectangles around the flagged area (use Drawing Tools > Rectangle).
Backtest: Apply to historical data (e.g., EUR/USD 4H) and check win rate with shorts on retests.
This setup typically yields 2-5 signals per week on major pairs, depending on volatility. Test on a demo account, and combine with market context (e.g., avoid shorts in strong uptrends).

Gap ZonesThis TradingView indicator automatically detects daily price gaps and plots them clearly on any timeframe (intraday or daily).
It helps visualize where unfilled gaps are sitting, track whether they’ve been filled, and control how far the zone extends.
Key Features
1. Daily Gap Detection
• Works even when you’re on intraday charts (uses daily OHLC data).
• Marks both gap up (potential support zones) and gap down (potential resistance zones).
2. Shaded Gap Zones
• Each gap is highlighted as a band (greenish for up, reddish for down).
• Option to turn shading off if you just want horizontal lines.
3. Hide When Filled
• Once price closes or touches the far side of the gap, it disappears (configurable: Touch vs Close).
4. Lookback Window
• Gaps only show if they occurred within the past X trading days (default: 30).
• Prevents your chart from being cluttered with ancient gaps.
5. Multiple Gaps Tracked
• Can track up to 5 recent gaps simultaneously.
• Oldest gaps “roll off” as new ones form.
6. Finite Right-Edge Guides
• Optional horizontal guide lines extend to the right, but only for a fixed number of bars (default: 50).
• Cleaner than infinite extensions.
7. Gap-Day Marker
• Optional vertical line drawn on the bar where the gap first occurred.
⸻
⚙️ Inputs & Settings
When you apply the indicator, you’ll see these options:
• Lookback (trading days): How far back to scan for gaps (default 30).
• Max gaps to show (1..5): How many simultaneous gap zones to display.
• Min gap size (% of prior close): Filter out tiny gaps (default 0.25%).
• Hide gaps once filled: Removes a gap from the chart once filled.
• Fill rule uses CLOSE (off = Touch):
• Touch = filled when price trades through the level intraday.
• Close = filled only when a candle close crosses it.
• Show shading: Toggle zone fills on/off.
• Show vertical marker on gap day: Toggle gap-day marker line.
• Show finite right-edge lines: Toggle horizontal lines extending right.
• Right line length (bars): How far those lines extend (default 50 bars).
⸻
🟢 How to Use It
1. Apply on Any Chart
• Works best on daily or intraday (5m, 15m, 1h).
• Gaps are always calculated from daily data, so intraday charts will show higher-timeframe gaps correctly.
2. Interpret Colors
• Green shading = Gap Up (often acts as support).
• Red shading = Gap Down (often acts as resistance).
3. Watch for Fills
• When price re-enters the gap zone, the indicator checks if it’s “filled” (based on your Touch/Close setting).
• If “Hide When Filled” is on, the zone vanishes.
4. Trade Context
• Many traders use gaps as targets (expecting a fill) or levels of support/resistance.
• Combined with your bull put/bear call spread strategies, it helps confirm strong levels.

Opening Candle Zone with ATR Bands by nkChartsThis indicator highlights the opening range of each trading session and projects dynamic ATR-based zones around it.
Key Features
Plots high and low levels of the opening candle for each new daily session.
Extends these levels across the session, providing clear intraday support and resistance zones.
Adds ATR-based offset bands above and below the opening range for volatility-adjusted levels.
Customizable colors, ATR length, and multiplier for flexible use across markets and timeframes.
Adjustable session history limit to control how many past levels remain on the chart.
How to Use:
The opening range high/low often acts as strong intraday support or resistance.
The ATR bands give an adaptive volatility buffer, useful for breakout or mean-reversion strategies.
Works on any market with clear session opens.
This tool is designed for traders who want to combine session-based price action with volatility insights, helping identify potential breakouts, reversals, or consolidation areas throughout the day.
⚠️ Disclaimer: This indicator is for educational purposes only. It does not provide financial advice or guarantee profits. Always perform your own analysis before making trading decisions.

[delta2win] Liquidity Zone Map🔥 Liquidity Zone Map — Volume‑normalized pivot zones with adaptive ATR scaling
📊 What it does:
• Detects potential liquidity/liquidation zones above confirmed highs and below confirmed lows
• Draws dynamic zones whose height scales with ATR and whose color intensity scales with volume
• Zones extend right and terminate on rule‑based events (midline cross)
🔬 How it works (core formulas):
• Pivot detection: ta.pivothigh/ta.pivotlow with length L
• Zone height: H = max(ATR(T) × M, MinTicks)
• Intensity (volume‑normalized):
– Z‑Score mode: I = clamp((V − μ) / (σ + ε), 0..1)
– Piecewise mode: I = clamp(V ≤ μ ? V/μ : (V − μ) / (Vmax − μ + ε), 0..1)
• Gradient color: col = Gradient(I) (start → mid → end)
• Zone life‑cycle:
– Creation on new pivot (top/bottom)
– Right edge follows bar_index
– Termination when with Mid = (Top+Bottom)/2, or optional TTL timeout
• Analysis range: global or constrained (Bars Back or ±% price window). Color scaling can be global or range‑scoped.
🆕 What’s new/different:
• Selectable volume normalization (Z‑Score or Piecewise)
• Timeframe‑adaptive ATR multiplier
• Range‑scoped vs. global color scaling
• Optional midlines, borders, info legend, scale legend
• Optional TTL termination for zones (lifetime in bars)
• Object management (cleanup/pooling) for performance
🧭 How to use (suggested presets):
• 1–5m: L=2, T=200, M=0.25, Range=Bars Back 1000, Intensity=Piecewise
• 15–60m: L=3, T=200, M=0.20, Range=Bars Back 1500, Intensity=Piecewise
• 4h+: L=4, T=200, M=0.20, Range=Off, Intensity=Z‑Score
⚙️ Settings:
• Pivot length L, ATR length T, multiplier M, MinTicks
• Opacity: base/auto (min/max)
• Range: Bars Back | Price Range ±% | Off
• Scaling: global vs. range‑scoped
• Midlines/borders/legends on/off
💡 Usage notes:
• Smaller L → more reactive, less robust
• Larger M → longer‑lasting zones
• On higher TFs, constrain "Bars Back" for performance
⚠️ Limitations:
• Non‑predictive; regime/volatility dependent
• Data quality impacts intensity computation

ADX Tide ZonesADX Tide Zones – Adaptive Momentum & Trend Strength Framework
Overview
ADX Tide Zones – Professional is a dynamic trend-strength visualizer designed for traders who want to interpret momentum with precision and context. By combining the Average Directional Index (ADX) with adaptive threshold logic, the indicator segments price action into distinct “tide zones” that reflect varying levels of market strength: Calm, Rising, Strong, and Falling Tides. These zones transform raw ADX readings into an interpretable framework that highlights when markets are consolidating, building momentum, trending strongly, or losing strength.
Unlike standard ADX readings, which can be difficult to interpret in real time, ADX Tide Zones translate momentum shifts into a continuous, color-coded system that traders can instantly read. Whether applied to scalping, intraday, or swing trading, the indicator offers a consistent methodology for identifying actionable opportunities across assets and timeframes.
How It Works
The foundation of ADX Tide Zones lies in momentum analysis via the ADX. By measuring the strength (not direction) of a trend, ADX provides an objective read on when markets are gaining or losing energy. ADX Tide Zones enhances this by applying threshold logic to classify ADX values into four distinct states:
Calm Tide : Low ADX values indicate sideways or consolidating conditions.
Rising Tide : ADX increases past a threshold, signaling momentum building.
Strong Tide : ADX remains elevated, confirming robust and sustained trend strength.
Falling Tide : ADX declines after strength, hinting at exhaustion or early reversal setups.
These states are displayed on the chart through adaptive visualizations (zones, bar colors, or overlays), offering real-time clarity on when to expect expansion, continuation, or contraction in price action.
Interpretation
Trend Analysis : By mapping transitions between tides, traders can instantly gauge whether markets are in accumulation, expansion, or exhaustion phases. Rising/Strong Tides reinforce trend continuation, while Falling Tides highlight weakening conditions.
Volatility & Risk Assessment : Shifts between Calm → Rising Tide often precede volatility expansions. Falling Tides can signal a period of compression or corrective moves, warning traders to manage risk proactively.
Market Context : The indicator does not dictate direction; instead, it overlays strength on top of price action, allowing traders to combine it with directional tools such as moving averages, order blocks, or liquidity zones for confirmation.
Strategy Integration
ADX Tide Zones adapts seamlessly to a wide range of trading strategies by translating momentum dynamics into actionable frameworks:
Trend Following : Traders can align with dominant flows by entering positions when the indicator confirms a Rising Tide or Strong Tide. These conditions signal persistent directional strength, making them ideal for continuation setups. Combining directional bias with ADX confirmation reduces the risk of trading against prevailing momentum.
Breakout Trading : When the market transitions from Calm Tide into a Rising Tide, it often precedes a volatility expansion. This shift highlights breakout conditions where accumulation gives way to impulsive price movement. Traders can use this transition as a timing tool to catch early entries into new momentum phases.
Exhaustion Reversals : Strong Tide phases don’t last forever—when they begin to fade into Falling Tide, it can mark trend fatigue or liquidity exhaustion. This offers contrarian traders an early edge in spotting overextended moves and positioning for corrective pullbacks or full reversals.
Multi-Timeframe Analysis : By overlaying higher timeframe tide zones on intraday or scalping charts, traders can filter noise and trade in alignment with larger flows. For example, combining a daily Rising Tide bias with a 15-minute breakout confirmation can significantly improve entry precision while reducing exposure to false signals.
Advanced Techniques
For traders seeking an extra edge, ADX Tide Zones can be pushed further with advanced methods:
Volume & Liquidity Confirmation : Pair the tide transitions with volume spikes, order flow, or liquidity sweep tools. When directional strength confirmed by the ADX coincides with institutional activity, it validates setups and increases probability of follow-through.
Cross-Asset Synchronization : Momentum rarely exists in isolation. Monitoring tide shifts across correlated instruments (e.g., majors vs. USD, or indices vs. risk assets) can uncover synchronized volatility events. These correlations help traders identify whether a move is isolated noise or part of a broader systemic trend.
Threshold Optimization : The sensitivity of ADX Tide Zones can be fine-tuned for different trading objectives. Lower thresholds heighten responsiveness, capturing micro-moves suitable for scalpers. Higher thresholds filter minor fluctuations, isolating major structural swings that align with swing or position trading.
Contextual Trade Management : Instead of using static stops or targets, traders can adapt risk management dynamically by tracking tide progression. For example, a trade initiated during Rising Tide may remain valid as long as conditions sustain, but partial profits or tighter stops can be applied once the zone shifts to Calm Tide.
Inputs & Customization
ADX Length : Define the lookback period for ADX calculation.
Threshold Levels : Adjust sensitivity for Calm, Rising, Strong, and Falling Tides.
Zone Visualization : Choose between bar coloring, background shading, or overlays.
Color Customization : Configure bullish, bearish, neutral, and tide-specific colors.
Multi-Timeframe Options : Enable tide readings from higher timeframes for confirmation.
Why Use ADX Tide Zones
ADX Tide Zones turns the complexity of momentum analysis into a visual system that highlights when markets are gearing up for moves, trending with conviction, or running out of steam. By combining adaptive ADX interpretation with customizable thresholds, traders can:
Anticipate breakouts before volatility expands.
Confirm the strength behind price trends.
Spot exhaustion phases early to secure profits or prepare for reversals.
Adapt strategies seamlessly between scalping, intraday, and swing trading.
With its balance of simplicity and depth, ADX Tide Zones provides a structured lens for reading market momentum, equipping traders with the clarity needed to execute with discipline and confidence.

StdDev Supply/Demand Zone RefinerThis indicator uses standard deviation bands to identify statistically significant price extremes, then validates these levels through volume analysis and market structure. It employs a proprietary "Zone Refinement" technique that dynamically adjusts zones based on price interaction and volume concentration, creating increasingly precise support/resistance areas.
Key Features:
Statistical Extremes Detection: Identifies when price reaches 2+ standard deviations from mean
Volume-Weighted Zone Creation: Only creates zones at extremes with abnormal volume
Dynamic Zone Refinement: Automatically tightens zones based on touch points and volume nodes
Point of Control (POC) Identification: Finds the exact price with maximum volume within each zone
Volume Profile Visualization: Shows horizontal volume distribution to identify key liquidity levels
Multi-Factor Validation: Combines volume imbalance, zone strength, and touch count metrics
Unlike traditional support/resistance indicators that use arbitrary levels, this system:
Self-adjusts based on market volatility (standard deviation)
Refines zones through machine-learning-like feedback from price touches
Weights by volume to show where real money was positioned
Tracks zone decay - older, untested zones automatically fade

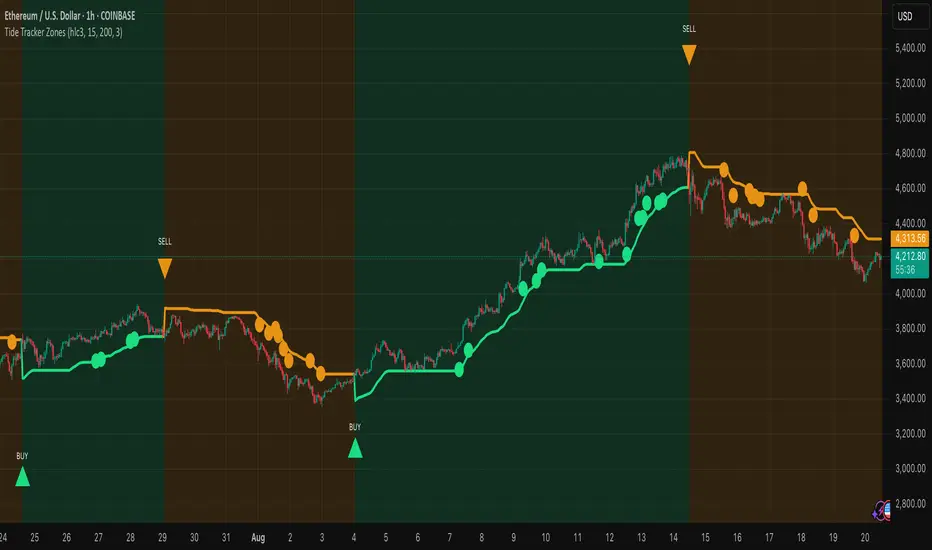
Tide Tracker ZonesTide Tracker Zones – Advanced Trend & Pullback Visualizer
Overview
Tide Tracker Zones is a sophisticated trading tool designed for traders who require clarity, precision, and actionable insights in real time. The indicator converts price action into dynamic trend zones, allowing users to instantly recognize market direction, potential reversals, and low-risk entry opportunities. By visualizing the market in this way, traders can focus on execution rather than deciphering complex charts.
Unlike static indicators, Tide Tracker Zones adapts to market volatility, providing a clear picture of bullish and bearish pressure across multiple timeframes. Its visual design, including color-coded trend zones, a prominent guide line, and carefully placed signals, ensures that market behavior is easy to interpret, making it suitable for scalping, swing trading, and longer-term strategies alike.
How It Works
The indicator relies on dynamic upper and lower bands derived from recent price ranges and a configurable multiplier. These bands expand during volatile periods and contract when price action stabilizes, creating flexible zones that reflect the dominant market tide.
A guide line tracks the active band, serving as a continuous reference for trend direction. Unlike traditional moving averages, the guide line does not clutter the chart but instead provides a subtle, intuitive indication of whether the market is in a bullish or bearish phase. Background shading reinforces this trend visually, highlighting bullish zones in one color and bearish zones in another, so the prevailing market flow is immediately clear.
The system continuously evaluates price relative to the bands to determine trend direction and detect potential reversals. When price crosses a band and flips the trend, the guide line updates, and signals are generated, providing traders with actionable information without overwhelming the chart.
Signals and Pullbacks
Tide Tracker Zones offers visual cues that make entry points more obvious and less speculative. Trend reversal arrows are plotted when the market changes direction: BUY arrows indicate a shift from bearish to bullish, and SELL arrows indicate a shift from bullish to bearish.
The indicator also highlights first pullbacks within an active trend. These pullback dots mark low-risk opportunities to enter a trend in progress, filtered to ensure that only the most relevant signals are displayed. The system uses ATR-based spacing to place arrows and dots vertically on the chart, preventing visual clutter and ensuring readability even during periods of high volatility.
Color-coded zones enhance situational awareness. Bullish zones are displayed in a customizable orange, while bearish zones are shown in green. Transparency is dynamically adjusted to maintain chart clarity while still providing a clear indication of trend strength.
Strategy Integration
Tide Tracker Zones can be used effectively for both trend-following and pullback strategies. Traders may enter positions in the direction of the guide line and colored zone, using trend reversal arrows for confirmation. First pullback dots offer tactical entries with reduced risk, allowing traders to enter a trend after a brief retracement.
Stop-loss levels can be placed just beyond the opposing trend zone, while take-profit targets may be determined using the width of the bands to account for market volatility. The indicator adapts seamlessly across multiple timeframes. Higher timeframes provide context and filter noise, while lower timeframes allow traders to refine entry timing. This makes it a versatile tool for scalping, swing trading, or longer-term positions.
Advanced Techniques
For traders seeking greater precision, Tide Tracker Zones can be combined with volume or momentum indicators to validate signals. Observing the sequence of trend arrows and pullback dots allows users to develop a systematic approach to entries and exits. Monitoring the width and behavior of the bands over time can also provide insights into periods of expanding or contracting volatility, helping traders anticipate market shifts.
Adjustments to the spread length and multiplier allow the indicator to be tuned for different assets and market conditions. By understanding the interaction between the guide line, trend zones, and pullback signals, traders can create a robust framework for decision-making, reducing guesswork and improving consistency.
Why Use Tide Tracker Zones
Tide Tracker Zones provides instant clarity and actionable insight in any market. Its dynamic zones and guide line give a clear visual understanding of trend direction, while trend reversal arrows and pullback dots highlight potential entry points. Unlike traditional indicators, it adapts to volatility and changing conditions, making it reliable across multiple asset classes and timeframes.
By combining trend detection, pullback analysis, and intuitive visual guidance, Tide Tracker Zones equips traders with a complete framework for disciplined, confident trading, transforming complex price action into a visual map of opportunity.