Mirpapa_Lib_BoxLibrary "Mirpapa_Lib_Box"
GetHTFrevised(_tf, _case)
GetHTFrevised
@description Retrieve a specific bar value from a Higher Time Frame (HTF) series.
Parameters:
_tf (string) : string The target HTF string (examples: "60", "1D").
_case (string) : string Case string determining which OHLC value to request.
@return float Returns the requested HTF value or na if _case does not match.
GetHTFrevised(_tf)
Parameters:
_tf (string)
GetHTFoffsetToLTFoffset(_offset, _chartTf, _htfTf)
GetHTFoffsetToLTFoffset
@description Adjust an HTF offset to an LTF offset by calculating the ratio of timeframes.
Parameters:
_offset (int) : int The HTF bar offset (0 means current HTF bar).
_chartTf (string) : string The current chart's timeframe (e.g., "5", "15", "1D").
_htfTf (string) : string The High Time Frame string (e.g., "60", "1D").
@return int The corresponding LTF bar index. Returns 0 if the result is negative.
GetHtfFromLabel(_label)
GetHtfFromLabel
@description Convert a Korean HTF label into a Pine Script timeframe string.
Parameters:
_label (string) : string The Korean label (e.g., "5분", "1시간").
@return string Returns the corresponding Pine Script timeframe (e.g., "5", "60").
IsChartTFcomparisonHTF(_chartTf, _htfTf)
IsChartTFcomparisonHTF
@description Determine whether a given HTF is greater than or equal to the current chart timeframe.
Parameters:
_chartTf (string) : string Current chart timeframe (e.g., "5", "15", "1D").
_htfTf (string) : string HTF timeframe (e.g., "60", "1D").
@return bool True if HTF ≥ chartTF, false otherwise.
IsCondition(_boxType, _isBull, _pricePrev, _priceNow)
IsCondition
@description FOB, FVG 조건 체크.\
_boxType: "fob"(Fair Order Block) 또는 "fvg"(Fair Value Gap).\
_isBull: true(상승 패턴), false(하락 패턴).\
상승 시 현재 가격이 이전 가격보다 높으면 true, 하락 시 이전 가격이 현재 가격보다 높으면 true 반환.
Parameters:
_boxType (string) : 박스 타입 ("fob", "fvg")
_isBull (bool) : 상승(true) 또는 하락(false)
_pricePrev (float) : 이전 가격
_priceNow (float) : 현재 가격
Returns: bool 조건 만족 여부
IsCondition(_boxType, _high2, _high1, _high0, _low2, _low1, _low0)
IsCondition
@description Sweep 조건 체크 (Swing High/Low 동시 발생).\
_boxType: "sweep" 또는 "breachBoth".\
조건: high2 < high1 > high0 (Swing High) AND low2 > low1 < low0 (Swing Low).\
중간 캔들이 양쪽보다 높고 낮은 지점을 동시에 형성할 때 true 반환.
Parameters:
_boxType (string) : 박스 타입 ("sweep", "breachBoth")
_high2 (float)
_high1 (float)
_high0 (float)
_low2 (float)
_low1 (float)
_low0 (float)
Returns: bool 조건 만족 여부
IsCondition(_boxType, _isBull, _open1, _close1, _high1, _low1, _open0, _close0, _low2, _low3, _high2, _high3)
IsCondition
@description RB (Rejection Block) 조건 체크.\
_boxType: "rb" (Rejection Block).\
상승 RB: candle1=음봉, candle0=양봉, low3>low1 AND low2>low1, close1*1.001>open0, open1close0.\
이전 캔들의 거부 후 현재 캔들이 반대 방향으로 전환될 때 true 반환.
Parameters:
_boxType (string) : 박스 타입 ("rb")
_isBull (bool) : 상승(true) 또는 하락(false)
_open1 (float)
_close1 (float)
_high1 (float)
_low1 (float)
_open0 (float)
_close0 (float)
_low2 (float)
_low3 (float)
_high2 (float)
_high3 (float)
Returns: bool 조건 만족 여부
IsCondition(_boxType, _isBull, _open2, _close1, _open1, _close0)
IsCondition
@description SOB (Strong Order Block) 조건 체크.\
_boxType: "sob" (Strong Order Block).\
상승 SOB: 양봉2 => 음봉1 => 양봉0, open2 > close1 AND open1 < close0.\
하락 SOB: 음봉2 => 양봉1 => 음봉0, open2 < close1 AND open1 > close0.\
3개 캔들 패턴으로 강한 주문 블록 형성 시 true 반환.
Parameters:
_boxType (string) : 박스 타입 ("sob")
_isBull (bool) : 상승(true) 또는 하락(false)
_open2 (float) : 2개 이전 캔들 open
_close1 (float) : 1개 이전 캔들 close
_open1 (float) : 1개 이전 캔들 open
_close0 (float) : 현재 캔들 close
Returns: bool 조건 만족 여부
CreateBox(_boxType, _boxState, _breachModeStart, _breachModeEnd, _isBull, _leftTime, _rightTime, _top, _bottom, _useLine, _colorBG, _colorBD, _colorText, _customText)
CreateBox
@description 박스 생성 (값 전달 방식 - 모든 좌표 직접 지정).\
호출자가 모든 좌표와 시간을 계산하여 전달.\
HTF/LTF 구분 불필요, tf/cache 계산 없음.\
Parameters:
_boxType (string) : 박스 타입 ("sob", "fob", "rb", "custom" 등)
_boxState (string) : 박스 상태 ("pending", "start", "extension")
_breachModeStart (string) : 시작 돌파 처리 방식
_breachModeEnd (string) : 종료 돌파 처리 방식
_isBull (bool) : 상승(true) 또는 하락(false)
_leftTime (int) : 박스 시작 시간
_rightTime (int) : 박스 종료 시간
_top (float) : 박스 상단 가격
_bottom (float) : 박스 하단 가격
_useLine (bool) : 중간선 표시 여부
_colorBG (color) : 박스 배경색
_colorBD (color) : 박스 테두리색
_colorText (color) : 텍스트 색상
_customText (string) : 커스텀 텍스트
Returns: 성공 여부와 박스 데이터
CreateBox(_boxType, _boxState, _tf, _isBull, _useLine, _colorBG, _colorBD, _colorText, _cache)
CreateBox (자동 계산 방식)
@description 박스 생성 (tf/cache 기반 자동 좌표 계산).\
라이브러리가 boxType에 따라 좌표를 자동 계산.\
Parameters:
_boxType (string) : 박스 타입
_boxState (string) : 박스 상태 ("pending", "start", "extension")
_tf (string) : 시간대
_isBull (bool) : 상승(true) 또는 하락(false)
_useLine (bool) : 중간선 표시 여부
_colorBG (color) : 박스 배경색
_colorBD (color) : 박스 테두리색
_colorText (color) : 텍스트 색상
_cache (HTFCache) : HTF 캐시 데이터
Returns: 성공 여부와 박스 데이터
ProcessBoxDatas(_openBoxes, _closedBoxes, _useMidLine, _closeCount, _baseColor, _pendingTransparency, _startTransparency, _endTransparency, _currentBarIndex, _currentLow, _currentHigh, _currentClose, _currentTime)
ProcessBoxDatas
@description 박스 확장 및 상태별 돌파 처리.\
열린 박스들을 현재 bar까지 확장하고, 상태별 돌파 조건 체크.\
PENDING: 시작 조건 체크 → START 전환\
START: 종료 조건 체크 → END 전환\
EXTENSION: 무한 확장\
종료된 박스는 _closedBoxes로 이동하고 _colorClose 색상 적용.\
Parameters:
_openBoxes (array) : 열린 박스 배열
_closedBoxes (array) : 닫힌 박스 배열
_useMidLine (bool) : 중간선 표시 여부
_closeCount (int) : 돌파 카운트 (이 횟수만큼 돌파 시 종료)
_baseColor (color) : 기본 색상
_pendingTransparency (int) : 대기 상태 불투명도
_startTransparency (int) : 시작 상태 불투명도
_endTransparency (int) : 종료 상태 불투명도
_currentBarIndex (int) : 현재 bar_index
_currentLow (float) : 현재 low
_currentHigh (float) : 현재 high
_currentClose (float) : 현재 close
_currentTime (int) : 현재 time
Returns: bool 항상 true
BoxType
BoxType
Fields:
FOB (series string)
FVG (series string)
IFVG (series string)
SOB (series string)
RB (series string)
BB (series string)
MB (series string)
SWEEP (series string)
CUSTOM (series string)
BreachMode
BreachMode
Fields:
BOTH_HIGH_LOW (series string)
BOTH_CLOSE (series string)
DIRECTIONAL_HIGH_LOW (series string)
DIRECTIONAL_CLOSE (series string)
NEAR_HIGH (series string)
NEAR_CLOSE (series string)
NEAR_LOW (series string)
FAR_HIGH (series string)
FAR_CLOSE (series string)
FAR_LOW (series string)
BoxState
BoxState
Fields:
PENDING (series string)
START (series string)
END (series string)
EXTENSION (series string)
BoxData
BoxData
Fields:
_type (series string) : 박스 타입
_breachModeStart (series string) : 시작 돌파 처리 방식
_breachModeEnd (series string) : 종료 돌파 처리 방식
_boxState (series string) : 박스 상태
_isBull (series bool) : 상승(true) 또는 하락(false) 방향
_box (series box)
_line (series line)
_boxTop (series float)
_boxBot (series float)
_boxMid (series float)
_topBreached (series bool)
_bottomBreached (series bool)
_breakCount (series int)
HTFCache
Fields:
_timeframe (series string)
_lastBarIndex (series int)
_isNewBar (series bool)
_barIndex (series int)
_open (series float)
_high (series float)
_low (series float)
_close (series float)
_open1 (series float)
_close1 (series float)
_high1 (series float)
_low1 (series float)
_open2 (series float)
_close2 (series float)
_high2 (series float)
_low2 (series float)
_high3 (series float)
_low3 (series float)
_time1 (series int)
_time2 (series int)
Tìm kiếm tập lệnh với "机械革命无界15+时不时闪屏"
Macro Timing Window Signal ⏱️ Macro Timing Window Signal – Check/X Indicator
This indicator displays a green check mark ✔️ or red X ✖️ in the top-right corner of the chart based on a repeating macro time cycle that divides every hour into active and inactive windows.
How it works:
• ✔️ Green Check (Active Macro Window):
Appears from xx:45 → xx:15 of the next hour (30-minute macro window).
• ✖️ Red X (Inactive Macro Window):
Appears from xx:16 → xx:44 (mid-hour cooldown window).
• Optional flash signal at the exact macro flip points (xx:45, xx:00, xx:15) to highlight transitions.
• Supports sound alerts so you never miss the start or end of a macro window.
This tool is designed for traders who incorporate macro-driven time cycles, liquidity sessions, or algorithmic delivery windows into their strategy.
The display is fixed on-screen, clean, and unobtrusive, ensuring instant recognition of the current macro state without cluttering the chart.

3D Globe - World Stock MarketsA real-time 3D rotating globe visualization showing 19 major stock exchanges worldwide with their current trading status.
█ OVERVIEW
This indicator displays an interactive 3D Earth globe that rotates in sync with the sun (sun-synchronous rotation), providing an intuitive view of which markets are currently in daylight/trading hours. Each stock exchange is plotted at its geographic location with color-coded status indicators.
█ FEATURES
- 3D Globe Rendering
- Spherical projection with proper visibility culling (hidden side not drawn)
- 27 country/region polygons derived from Natural Earth 110m data
- Optional latitude/longitude grid (meridians every 20°, parallels every 20°)
- Sun-synchronous auto-rotation: the globe rotates 15° per hour to follow real-world daylight
- 19 Stock Exchanges Tracked
NYSE, NASDAQ, TSX (Toronto), BMV (Mexico), B3 (São Paulo), LSE (London), EURONEXT (Paris), XETRA (Frankfurt), SIX (Zurich), MOEX (Moscow), TADAWUL (Riyadh), JSE (Johannesburg), NSE (Mumbai), SSE (Shanghai), HKEX (Hong Kong), TSE (Tokyo), KRX (Seoul), SGX (Singapore), ASX (Sydney)
- Real-Time Market Table (10 columns)
- Status indicator (● open / ○ closed)
- Exchange name and country with flag
- Local time with seconds (HH:MM:SS)
- Opening time
- Time to open (for closed markets)
- Time since open (for open markets)
- Time to close (for open markets)
- Index name (S&P500, FTSE, DAX, CAC40, N225, HSI, etc.)
- Daily % change with color coding
█ HOW IT WORKS
The globe uses standard 3D mathematics:
1. Geographic coordinates (lat/lon) are converted to 3D Cartesian points on a unit sphere
2. Rotation matrices are applied for X-axis tilt and Y-axis rotation (sun position)
3. Points are projected onto 2D screen space
4. Visibility culling hides points on the far side of the globe (z < 0)
Performance optimization: The globe redraws only when the minute changes, while the market table updates every tick for accurate second-by-second timing.
█ SETTINGS
Globe Group:
- Globe Size: Adjustable radius (15-60)
- Show Grid: Toggle latitude/longitude lines
- Fill Continents: Toggle solid land fill vs outline only
Style Group:
- Background, Ocean, Land, Land Border, Grid colors
- Open/Closed market indicator colors
- Globe border color
Table Group:
- Position: Left or Right side
- Show/Hide market table
█ DATA SOURCES
- Geographic data: Simplified polygons derived from Natural Earth (public domain)
- Market hours: Standard trading sessions (does not account for holidays)
- Index data: Real-time from TradingView (TVC, MOEX, TADAWUL, NSE, SSE, ASX providers)
█ LIMITATIONS
- Market hours are based on regular sessions only (no pre/post market, no holiday calendar)
- UTC offsets are fixed (no automatic DST adjustment)
- Some index symbols may not be available in all regions
█ USE CASES
- Quick visual overview of global market activity
- Identifying trading opportunities across time zones
- Understanding market session overlaps
- Educational tool for learning about world markets
Open-source under Mozilla Public License 2.0.

ICT Fair Value Gap Detector [Eˣ]⚡ Fair Value Gap Detector
Overview
The Fair Value Gap Detector automatically identifies price imbalances on your charts - the inefficiencies left behind when price moves too quickly. This indicator reveals where price is likely to return for "rebalancing", based on ICT (Inner Circle Trader) concepts of market efficiency.
━━━━━━━━━━━━━━━━━━━━━━━━━━━━
🎯 What This Indicator Does
Detects Fair Value Gaps:
• 🟢 Bullish FVG - Gap left below during aggressive upward move
• 🔴 Bearish FVG - Gap left above during aggressive downward move
• Automatically identifies 3-candle price inefficiencies
• Works on all timeframes and instruments
Smart Fill Tracking:
• Full Fill - Price completely fills the gap
• 50% Fill - Price fills half the gap (critical level)
• Partial Fill - Price touches gap edge
• Real-time fill percentage tracking
• Auto-removes filled gaps (optional)
Professional Features:
• Active Gap Highlighting - Shows nearest unfilled gap
• Distance Calculator - Displays how far price is from gaps
• Market Bias - Analysis based on gap balance
• Size Filtering - Minimum gap size to avoid noise
• Visual Clarity - Clean boxes with color-coding
━━━━━━━━━━━━━━━━━━━━━━━━━━━━
📚 Understanding Fair Value Gaps
What Are Fair Value Gaps?
Fair Value Gaps (FVGs), also known as imbalances or inefficiencies, are zones where price moved so quickly that normal trading didn't occur. They represent:
• Price Imbalance - One-sided aggressive buying or selling
• Unfair Pricing - Some participants didn't get to trade at these levels
• Market Inefficiency - Supply/demand equilibrium was disrupted
• Rebalancing Zones - Price often returns to "fill" these gaps
The ICT Concept:
Markets constantly seek equilibrium (fair value). When price moves too fast:
1. It leaves gaps where normal trading didn't happen
2. These gaps represent unfair/inefficient pricing
3. Market has a tendency to return and "rebalance"
4. Smart money knows this and trades the fills
Why FVGs Work:
• Unfilled Orders - Traders who missed the move have pending orders in the gap
• Algorithmic Trading - Algos programmed to exploit inefficiencies
• Market Psychology - Traders notice gaps and place orders there
• Institutional Behavior - Smart money uses gaps for entries/exits
FVG vs Regular Gaps:
• Regular Gaps - Occur at market open, between daily closes
• Fair Value Gaps - Occur intraday, between 3 consecutive candles
• FVGs happen more frequently and on all timeframes
• FVGs are more tradeable for intraday/swing traders
━━━━━━━━━━━━━━━━━━━━━━━━━━━━
🟢 Bullish Fair Value Gaps Explained
How They Form:
Bullish FVG requires 3 candles:
1. Candle 1 - Any candle (sets the high reference)
2. Candle 2 - Strong bullish candle (aggressive buying)
3. Candle 3 - Continuation candle
The Gap: Candle 3's LOW is above Candle 1's HIGH = Gap left unfilled
Visual Example:
```
Candle 3: Low at $105 ──────────┐
│ ← GAP (Bullish FVG)
Candle 2: Strong bullish │
│
Candle 1: High at $100 ──────────┘
```
What It Means:
• Price jumped from $100 to $105+ so fast, no trading occurred in between
• This $100-$105 zone is "unfair" - buyers/sellers didn't get to trade there
• Market may return to this zone to "rebalance"
• When price returns, it often acts as support
Trading Bullish FVGs:
Strategy:
• Wait for price to retrace down into the bullish FVG (green box)
• Look for rejection/bounce from the gap zone
• Enter long when price respects the FVG as support
• Stop loss: Below the FVG
• Target: Previous high or opposite FVG
Best Entry Points:
• 50% Fill: Price enters middle of gap (highest probability)
• Full Fill: Price touches bottom of gap (aggressive entry)
• Tap & Reject: Price quickly enters and exits gap (strong signal)
Example Trade:
• Bullish FVG forms: $50,000 - $50,500 (500 point gap)
• Price rallies to $52,000 then retraces
• Price drops to $50,250 (50% of gap filled)
• Bullish reversal candle appears
• Enter long at $50,500, stop at $49,800
• Target: $52,000+
━━━━━━━━━━━━━━━━━━━━━━━━━━━━
🔴 Bearish Fair Value Gaps Explained
How They Form:
Bearish FVG requires 3 candles:
1. Candle 1 - Any candle (sets the low reference)
2. Candle 2 - Strong bearish candle (aggressive selling)
3. Candle 3 - Continuation candle
The Gap: Candle 3's HIGH is below Candle 1's LOW = Gap left unfilled
Visual Example:
```
Candle 1: Low at $100 ───────────┐
│ ← GAP (Bearish FVG)
Candle 2: Strong bearish │
│
Candle 3: High at $95 ───────────┘
```
What It Means:
• Price dropped from $100 to $95 so fast, no trading occurred in between
• This $95-$100 zone is "unfair" - buyers/sellers didn't get to trade there
• Market may return to this zone to "rebalance"
• When price returns, it often acts as resistance
Trading Bearish FVGs:
Strategy:
• Wait for price to retrace up into the bearish FVG (red box)
• Look for rejection/reversal from the gap zone
• Enter short when price respects the FVG as resistance
• Stop loss: Above the FVG
• Target: Previous low or opposite FVG
Best Entry Points:
• 50% Fill: Price enters middle of gap (highest probability)
• Full Fill: Price touches top of gap (aggressive entry)
• Tap & Reject: Price quickly enters and exits gap (strong signal)
Example Trade:
• Bearish FVG forms: $48,000 - $48,500 (500 point gap)
• Price drops to $46,000 then retraces
• Price rallies to $48,250 (50% of gap filled)
• Bearish reversal candle appears
• Enter short at $48,000, stop at $48,700
• Target: $46,000-
━━━━━━━━━━━━━━━━━━━━━━━━━━━━
📊 How To Use This Indicator
Strategy 1: FVG Rebalancing (Classic)
Best For: Swing trading, reversal trading
Timeframes: 15min, 1H, 4H
Win Rate: 65-75%
Entry Rules:
1. Identify unfilled FVG (bright color, not gray)
2. Wait for price to return to the gap
3. Best entry: 50% fill of the gap
4. Look for reversal confirmation:
• Bullish FVG: Pin bar, engulfing, hammer
• Bearish FVG: Shooting star, bearish engulfing
5. Enter when price bounces/rejects from FVG
6. Stop: Beyond opposite side of FVG
7. Target: 2-3R or previous high/low
Why It Works: 70%+ of FVGs get filled, and 60%+ show reaction
Strategy 2: FVG + Order Block Confluence
Best For: High-probability setups
Timeframes: 1H, 4H
Win Rate: 75-85%
Entry Rules:
1. Find FVG that overlaps with Order Block
2. This creates a "super zone" of confluence
3. Wait for price to return to this zone
4. Enter on first touch of confluence zone
5. Stop: Beyond the confluence zone
6. Target: 3-4R
Why It Works: Double institutional concepts = highest probability
Strategy 3: Multi-Timeframe FVG
Best For: Position trading, major moves
Timeframes: Combine Daily + 4H or 4H + 1H
Win Rate: 70-80%
Entry Rules:
1. Identify large FVG on higher timeframe (Daily/4H)
2. Wait for price to enter this HTF FVG
3. Switch to lower timeframe (4H/1H)
4. Look for LTF FVG within HTF FVG in same direction
5. Trade the LTF FVG fill
6. Stop: Below LTF FVG
7. Target: Exit HTF FVG or beyond
Why It Works: Timeframe alignment = institutional consensus
Strategy 4: FVG Rejection Trade
Best For: Quick scalps, day trading
Timeframes: 5min, 15min
Win Rate: 60-70%
Entry Rules:
1. Price enters FVG zone
2. Immediate rejection (strong reversal candle)
3. Enter on close of rejection candle
4. Tight stop beyond FVG
5. Quick target: 1-2R
Why It Works: Strong rejection = institutional defense of level
Strategy 5: FVG-to-FVG Trading
Best For: Momentum trading
Timeframes: 15min, 1H
Win Rate: 55-65%
Entry Rules:
1. Identify bullish FVG below and bearish FVG above
2. Enter long at bullish FVG, target bearish FVG
3. Or enter short at bearish FVG, target bullish FVG
4. Price often moves from one imbalance to another
5. Stop: Beyond trading FVG
6. Target: Opposite FVG
Why It Works: Price rebalances from one inefficiency to another
━━━━━━━━━━━━━━━━━━━━━━━━━━━━
⚙️ Settings Explained
Display Settings
Show Bullish/Bearish FVG
• Toggle each type on/off independently
• Customize colors for each FVG type
• Default: Green (bullish), Red (bearish)
• Tip: Use colors that contrast with your chart
Max FVG to Display (Default: 20)
• Limits how many gaps are shown at once
• Lower (10-15): Cleaner chart, recent gaps only
• Higher (30-50): More historical context
• Recommended: 15-25 for most trading
Show FVG Labels (Default: ON)
• Displays "FVG+" and "FVG-" text on gaps
• Shows 🎯 on active (nearest) gap
• Shows fill percentage (e.g., "FVG+ 35%")
• Turn OFF for minimal appearance
• Recommended: Keep ON for clarity
Extend Gaps (bars) (Default: 50)
• How far to extend gap boxes to the right
• Lower (20-30): Shorter boxes
• Higher (100+): Longer boxes, easier to see
• Gaps auto-extend until filled or limit reached
• Recommended: 40-60 bars
Filters
Min Gap Size % (Default: 0.05)
• Minimum gap size as percentage of price
• Filters out tiny, insignificant gaps
• Crypto: 0.05-0.15% (high volatility)
• Forex: 0.03-0.10% (moderate volatility)
• Stocks: 0.05-0.20% (varies by stock)
• Indices: 0.05-0.15%
• Adjust based on instrument's average move
Show Filled Gaps (Default: OFF)
• When ON: Shows gray boxes for filled gaps
• When OFF: Gaps disappear after mitigation
• Use ON: For learning and backtesting
• Use OFF: For clean, active trading view
Advanced Settings
Auto-Detect Mitigation (Default: ON)
• Automatically tracks when gaps are filled
• Updates fill percentage in real-time
• Marks gaps as "mitigated" when filled
• Recommended: Keep ON
Mitigation Type (Default: Full)
• Full: Gap considered filled when price closes through entire gap
• 50%: Gap considered filled at 50% (critical level)
• Partial: Gap considered filled on first touch
• For learning: Use "Full"
• For aggressive trading: Use "50%"
• For conservative trading: Use "Partial"
Highlight Nearest Gap (Default: ON)
• Highlights the closest unfilled gap to current price
• Active gap shown with 🎯 emoji and brighter color
• Helps focus on most relevant opportunity
• Recommended: Keep ON
━━━━━━━━━━━━━━━━━━━━━━━━━━━━
📱 Info Panel Guide
Bullish FVG Count
• Number of active (unfilled) bullish fair value gaps
• Higher number = More potential support zones below
• Multiple bullish FVGs = Strong rebalancing demand
Bearish FVG Count
• Number of active (unfilled) bearish fair value gaps
• Higher number = More potential resistance zones above
• Multiple bearish FVGs = Strong rebalancing supply
Bias Indicator
• ⬆ Bullish: More bullish FVGs than bearish
• ⬇ Bearish: More bearish FVGs than bullish
• ↔ Neutral: Equal FVGs on both sides
• Market tends to fill nearby gaps first
Target Indicator
• Shows nearest unfilled gap and distance
• Example: "Bull FVG -1.25%" = Bullish gap is 1.25% below price
• Example: "Bear FVG +0.85%" = Bearish gap is 0.85% above price
• Watch for price to reach these targets
━━━━━━━━━━━━━━━━━━━━━━━━━━━━
📱 Alert Setup
This indicator includes 4 alert types:
1. Price Entering Bullish FVG
• Fires when price drops into a bullish gap
• Action: Watch for bounce/reversal
• High-probability long setup developing
2. Price Entering Bearish FVG
• Fires when price rallies into a bearish gap
• Action: Watch for rejection/reversal
• High-probability short setup developing
3. New Bullish FVG Detected
• Fires when a new bullish gap forms
• Action: Mark zone for future fill
• New rebalancing target below identified
4. New Bearish FVG Detected
• Fires when a new bearish gap forms
• Action: Mark zone for future fill
• New rebalancing target above identified
To Set Up Alerts:
1. Click "Alert" button (clock icon)
2. Select "Fair Value Gap Detector"
3. Choose your alert condition
4. Configure notification method
5. Click "Create"
Pro Tip: Set "Price Entering" alerts to catch fills in real-time
━━━━━━━━━━━━━━━━━━━━━━━━━━━━
💎 Pro Tips & Best Practices
✅ DO:
• Wait for 50% fill - Middle of gap has highest win rate (65-70%)
• Use confirmation - Don't trade just because price touched gap
• Combine with structure - FVG + support/resistance = high probability
• Trade first fill - Unfilled gaps have better success rate than refilled
• Respect full fills - Once fully filled, gap is less reliable
• Use multiple timeframes - HTF FVGs are stronger than LTF
• Check session timing - FVGs work best during London/NY sessions
• Follow the bias - More bullish FVGs = favor longs
⚠️ DON'T:
• Don't blindly fade gaps - Wait for price action confirmation
• Don't ignore momentum - Strong trends can blow through FVGs
• Don't trade every gap - Quality over quantity
• Don't assume all gaps fill - About 70-80% fill, 20-30% don't
• Don't use tight stops - Allow room for wick into gap
• Don't overtrade - Wait for confluence and confirmation
• Don't fight trends - Best FVG trades are with higher TF trend
• Don't ignore fill percentage - 50% is often the sweet spot
🎯 Best Timeframes:
• Scalpers: 1min, 5min (many gaps, quick fills)
• Day Traders: 5min, 15min, 1H (balanced)
• Swing Traders: 1H, 4H, Daily (larger, more reliable gaps)
• Position Traders: 4H, Daily, Weekly (major imbalances)
🔥 Best Instruments:
• Excellent: BTC, ETH, ES, NQ, Forex majors (clean price action)
• Good: Gold, Oil, Major indices, Large-cap stocks
• Moderate: Altcoins, small-cap stocks (more noise)
• Best Markets: Trending markets with clear swings
⏰ Best Times for FVG Trading:
• London Session: High volume = reliable gap fills
• NY Session: Strong moves create quality gaps
• London-NY Overlap: Best time for gap creation and fills
• Asian Session: Lower probability, wait for London
━━━━━━━━━━━━━━━━━━━━━━━━━━━━
🎓 Advanced FVG Concepts
FVG Mitigation Levels
Understanding fill percentages:
• 0-25% Fill: Gap barely touched, often continues without fill
• 25-50% Fill: Partial rebalancing, may reverse here
• 50% Fill: CRITICAL LEVEL - Highest probability reversal zone
• 50-75% Fill: Deep rebalancing, strong reversal likely
• 75-100% Fill: Full rebalancing, gap's purpose fulfilled
Why 50% Matters: Market seeks equilibrium, and 50% represents perfect balance
FVG Inversions
When price breaks through a gap completely:
• Bullish FVG that's broken becomes bearish (support → resistance)
• Bearish FVG that's broken becomes bullish (resistance → support)
• Inverted gaps are weaker than fresh gaps
• Trading: Can fade the inverted gap but with caution
FVG Confluence Zones
Multiple FVGs at similar level:
• Creates "super gap" or confluence zone
• Much higher probability of reaction
• Wider zone for entries (more room for stops)
• Often aligns with other institutional concepts
FVG + Order Block Combo
When FVG overlaps with Order Block:
• Double institutional concept
• Extremely high probability setup (75-85% win rate)
• Price drawn to fill gap AND test order block
• Use tight stops, generous targets (3-5R possible)
Nested FVGs (Multi-Timeframe)
Small FVG inside larger FVG:
• Daily FVG contains 4H FVG contains 1H FVG
• Trade the smallest FVG in direction of larger ones
• Highest probability when all aligned
• Progressive targets: Fill small → medium → large gaps
FVG Exhaustion
When price creates multiple FVGs in same direction:
• Indicates strong momentum/impulsive move
• Each gap represents acceleration
• Last gap often signals exhaustion
• Watch for reversal after filling final gap
━━━━━━━━━━━━━━━━━━━━━━━━━━━━
📈 Common FVG Patterns
Pattern 1: The Perfect Rebalance
• FVG forms during strong move
• Price continues 100+ pips
• Clean return to 50% of gap
• Immediate reversal
• Textbook setup, 70%+ win rate
Pattern 2: The Double Fill
• Price partially fills gap (25%)
• Weak reaction, continues
• Returns again for deeper fill (75%)
• Strong reversal on second fill
• Second fill often better entry
Pattern 3: The Blow-Through
• Price approaches gap
• Completely ignores it, no reaction
• Keeps going in same direction
• Sign of very strong momentum
Pattern 4: The Magnet Effect
• Price slowly grinds toward gap
• Accelerates as it gets close
• Quickly fills and reverses
• Common in ranging markets
Pattern 5: The False Fill
• Price wicks into gap briefly
• Immediately reverses without filling
• "Stop hunt" or liquidity grab
• Gap remains unfilled
• Often precedes strong move
━━━━━━━━━━━━━━━━━━━━━━━━━━━━
🚀 What Makes This Different?
Unlike basic gap indicators, Fair Value Gap Detector:
• ICT Methodology - Based on proven institutional concepts
• Real-Time Fill Tracking - Shows percentage filled as it happens
• 3 Mitigation Types - Full, 50%, Partial for different strategies
• Active Gap Highlighting - Shows most relevant opportunity
• Smart Filtering - Minimum size to avoid noise
• Visual Clarity - Clean, professional appearance
• Auto-Management - Removes filled gaps automatically
• Distance Tracking - Know exactly where price needs to go
Based On Professional Concepts:
• ICT Fair Value Gap theory
• Market efficiency principles
• Price rebalancing dynamics
• Institutional order flow analysis
━━━━━━━━━━━━━━━━━━━━━━━━━━━━
📈 FVG Statistics & Probabilities
Based on ICT concepts and trader observations:
Gap Fill Rates:
• 70-80% of FVGs get filled eventually
• 60-70% show some reaction when filled
• 50% fill level has ~65% reversal rate
• Full fills have ~55% reversal rate
Timeframe Reliability:
• Daily FVGs: ~75-85% fill rate, strongest reactions
• 4H FVGs: ~70-80% fill rate, strong reactions
• 1H FVGs: ~65-75% fill rate, good reactions
• 15min FVGs: ~60-70% fill rate, moderate reactions
• 5min FVGs: ~55-65% fill rate, weaker reactions
Best Practices:
• First touch of gap = 65-70% win rate
• 50% fill = 65% win rate
• FVG + Order Block = 75-85% win rate
• Multi-timeframe aligned FVG = 70-80% win rate
• FVG in trending market = 60-70% win rate
Common Failures:
• Strong momentum blows through gaps (20-30% of time)
• Gaps in low-volume periods less reliable
• Very small gaps (<0.05%) often ignored
• Counter-trend gaps have lower success rate
━━━━━━━━━━━━━━━━━━━━━━━━━━━━
🙏 If You Find This Helpful
• ⭐ Leave your feedback
• 💬 Share your experience in the comments
• 🔔 Follow for updates and new tools
Questions about Fair Value Gaps? Feel free to ask in the comments.
━━━━━━━━━━━━━━━━━━━━━━━━━━━━
Version History
• v1.0 - Initial release with 3-candle FVG detection and real-time fill tracking

ShooterViz Lazy Trader EMA SystemShooterViz Lazy Trader EMA System - Complete User Guide
What This Script Does
This is a position scaling indicator that tells you exactly when to enter, add to, and exit trades using a simplified 5-EMA system. It removes the guesswork and decision fatigue from trading by giving you clear visual signals.
The Core Concept
3 entry signals that build your position from 20% → 50% → 100%
2 exit signals that scale you out at 50% → 50% (complete exit)
1 higher timeframe filter that keeps you on the right side of the trend
No Fibonacci calculations, no RSI divergence, no multi-indicator confusion. Just EMAs and price action.
What You'll See On Your Chart
1. Colored EMA Lines
Blue Lines (Entry Zone):
3 EMA (lightest blue) - Early reversal detector
5 EMA (darker blue) - Confirmation line
Green Lines (Add Zone):
21 EMA (bright green) - First add location
34 EMA (lighter green) - Final add location
Red Lines (Exit Zone):
89 EMA (lighter red) - First exit trigger
144 EMA (darker red) - Final exit trigger
Orange Lines (Hyper Frame - optional):
Hyper 21 EMA (from higher timeframe) - Trend direction
Hyper 34 EMA (from higher timeframe) - Bias confirmation
2. Triangle Signals
Green Triangles (Below Price) = BUY/ADD:
Lime triangle with "20%" = Entry 1: Price reclaimed 3→5 EMA (starter position)
Green triangle with "30%" = Entry 2: Price bounced off 21 EMA (first add)
Teal triangle with "50%" = Entry 3: Price broke out from 34 EMA compression (final add)
Red Triangles (Above Price) = SELL:
Orange triangle with "50% OFF" = Exit 1: Price broke below 89 EMA (take half off)
Red triangle with "EXIT ALL" = Exit 2: Price broke below 144 EMA (close remaining position)
3. Background Color (Trend Bias)
Light green background = Hyper frame EMAs trending up (bias LONG)
Light red background = Hyper frame EMAs trending down (bias SHORT)
Gray background = Neutral/choppy (be cautious)
4. Info Table (Top Right Corner)
A live status dashboard showing:
Which entry signals are currently active (✓ or —)
Which exit signals are currently active (⚠ or ⛔)
Current hyper frame bias (🟢 LONG / 🔴 SHORT / ⚪ NEUTRAL)
Which timeframe you're using for hyper frame filtering
How to Install and Set Up
Step 1: Add the Script to TradingView
Open TradingView
Click "Pine Editor" at the bottom of the screen
Copy the entire script code
Paste it into the Pine Editor
Click "Add to Chart"
Step 2: Configure Your Settings
Click the gear icon ⚙️ next to "LazyEMA" in your indicators list.
Critical Settings to Configure:
Hyper Frame Selection (Most Important!)
Location: "Hyper Frame (Pick ONE)" section
Setting: "Timeframe"
What to choose:
Trading 15min or 1H charts? → Use "240" (4-hour)
Trading 4H or Daily charts? → Use "D" (Daily)
Trading Daily or Weekly charts? → Use "W" (Weekly)
Why this matters: This filter keeps you aligned with the bigger trend. Only take longs when this timeframe is green, shorts when it's red.
MA Type (Optional, default is fine)
Location: "MA Config" section
Default: EMA (recommended)
Options: EMA, SMA, WMA, HMA, RMA, VWMA
Most traders should stick with EMA
Visual Toggles (Customize your view)
Entry Zone: Turn individual EMAs on/off (3, 5, 21, 34)
Exit Zone: Turn individual EMAs on/off (89, 144)
Hyper Frame: Toggle the higher timeframe EMAs on/off
Step 3: Clean Up Your Chart
Turn OFF these if visible:
Volume bars (they clutter the view)
Any other indicators you have loaded
Grid lines (optional, but cleaner)
Keep ONLY:
Price candles
Your ShooterViz Lazy Trader EMA System
Maybe support/resistance levels if you manually draw them
How to Trade With This Script
The Basic Workflow
Before the Market Opens:
Check the background color and info table bias
Green background? Look for LONG setups only
Red background? Look for SHORT setups only
Gray background? Stay flat or trade small
During the Trading Session:
LONGS (When hyper frame is bullish):
Wait for Entry 1 signal:
Lime triangle appears with "20%"
Price has reclaimed the 5 EMA after dipping to 3 EMA
Action: Enter 20% of your intended position
Stop loss: Place below the 5 EMA or recent swing low
Wait for Entry 2 signal:
Green triangle appears with "30%"
Price pulled back to 21 EMA and bounced
Action: Add 30% more (you're now at 50% total)
Move stop: Trail it up to below 21 EMA
Wait for Entry 3 signal:
Teal triangle appears with "50%"
Price compressed at 34 EMA and broke out
Action: Add final 50% (you're now 100% loaded)
Move stop: Trail it up to below 34 EMA
Wait for Exit 1 signal:
Orange triangle appears with "50% OFF"
Price broke below 89 EMA
Action: Exit 50% of your position immediately
Move stop on rest: Trail to 89 EMA or lock in profits
Wait for Exit 2 signal:
Red triangle appears with "EXIT ALL"
Price broke below 144 EMA
Action: Exit remaining 50% (you're now flat)
Or: Stop gets hit at 89 EMA (same result)
SHORTS (When hyper frame is bearish):
Same process, but inverted
Triangles appear above price instead of below
Look for breakdowns below EMAs instead of bounces off them
Exit when price reclaims 89 and 144 EMAs
Real-World Example Walkthrough
Setup: Trading ES (S&P 500 Futures) on 1H Chart
Chart Configuration:
Timeframe: 1 Hour
Hyper Frame: 240 (4-hour)
Ticker: ES
Pre-Market Check:
Background is light green
Info table shows "🟢 LONG" for Hyper Bias
Decision: Only look for long entries today
9:30 AM - Market Opens
Price dips and touches 3 EMA
Watch for: Reclaim of 5 EMA
9:45 AM - Entry 1 Triggers
Lime triangle appears below bar
Price closed above 5 EMA at $4,550
Action taken:
Enter long 20% position (2 contracts if targeting 10 total)
Stop loss at $4,545 (below 5 EMA)
Risk: $10 per contract × 2 = $20 risk
10:30 AM - Entry 2 Triggers
Price rallied to $4,565, pulls back
Green triangle appears at 21 EMA ($4,555)
Action taken:
Add 30% (3 more contracts, now have 5 total)
Move stop to $4,550 (below 21 EMA)
Current P/L: +$25 ($5 gain on original 2 contracts, break-even on new 3)
11:15 AM - Entry 3 Triggers
Price consolidates at 34 EMA around $4,560
Teal triangle appears as price breaks to $4,568
Action taken:
Add final 50% (5 more contracts, now have 10 total)
Move stop to $4,555 (below 34 EMA)
Current P/L: +$70
1:00 PM - Price Extends
Price rallies to $4,595 (on track)
89 EMA is at $4,575
No action yet, let it run
2:15 PM - Exit 1 Triggers
Price pulls back from $4,600
Orange triangle appears as price breaks below 89 EMA at $4,580
Action taken:
Exit 50% (5 contracts closed at $4,580)
Keep 5 contracts with stop at 89 EMA ($4,575)
Banked: +$150 average gain on closed 5 contracts
2:45 PM - Exit 2 Triggers
Price continues down
Red triangle appears as price breaks 144 EMA at $4,570
Action taken:
Exit remaining 5 contracts at $4,570
Banked: +$100 on remaining 5 contracts
Final Results:
Total gain: $250 on the trade
Initial risk: $50 (if stopped out at Entry 1)
Risk/Reward: 5:1
Time in trade: ~5 hours
Common Questions
"What if I miss Entry 1? Can I still take Entry 2?"
Yes! Each entry is independent. If you miss the 3→5 reclaim, wait for the 21 EMA bounce. You'll start with a 30% position instead of 20%, but that's fine.
Rule: Never chase. Wait for the next EMA setup.
"What if multiple entry signals trigger at the same bar?"
Rare, but possible. If you see both Entry 1 and Entry 2 trigger together:
Take Entry 1 first (20%)
If the next bar confirms Entry 2 is still valid, add 30%
When in doubt, scale in gradually
"The hyper frame is green but I'm seeing short signals?"
Don't take them. The hyper frame is your bias filter. If it says "go long," ignore short setups. They're usually lower probability and will get stopped out.
"Can I use this for swing trading overnight?"
Absolutely. Just switch your hyper frame:
If you're on Daily charts, use Weekly hyper frame
If you're on 4H charts, use Daily hyper frame
Adjust position sizes for overnight risk
"What if the signal appears right at market close?"
Don't chase it. Wait for the next bar (next day) to confirm. Signals that appear in the last 5 minutes are often noise.
"How do I set up alerts?"
Right-click on the chart
Select "Add Alert"
Choose "LazyEMA" from the condition dropdown
Select which signal you want alerts for:
Entry 1: 3→5 Reclaim
Entry 2: 21 EMA Add
Entry 3: 34 EMA Breakout
Exit 1: 89 EMA Break
Exit 2: 144 EMA Break
Click "Create"
Pro tip: Set up all 5 alerts so you never miss a signal.
Position Sizing Guide see
swingtradenotes.substack.com
Critical Rule: Know your total risk BEFORE you take Entry 1. Don't wing it.
Customization Tips
For Day Traders (Scalpers)
Use 5min or 15min charts
Hyper frame: 1H or 4H
Expect 2-4 setups per day
Tighter stops (0.5% risk per entry)
For Swing Traders
Use 4H or Daily charts
Hyper frame: Daily or Weekly
Expect 1-2 setups per week
Wider stops (1-2% risk per entry)
For Position Traders
Use Daily or Weekly charts
Hyper frame: Weekly or Monthly
Expect 1-2 setups per month
Widest stops (2-3% risk per entry)
The "Don't Be Stupid" Checklist
Before taking ANY signal from this script, ask:
✅ Is the hyper frame bias pointing in my direction?
✅ Is the signal clean (not at a weird time or during news)?
✅ Do I know my stop loss level?
✅ Do I know my position size?
✅ Can I afford to lose if this trade fails?
If you answered "no" to ANY of these, skip the trade.
Troubleshooting
"I'm not seeing any signals"
Possible causes:
The "Show Lazy Trader System" toggle is off (turn it on)
Your chart timeframe is too high (try 1H or 4H)
Market is in a tight range (EMAs are compressed)
You need to refresh the chart
"Too many signals, getting whipsawed"
Fixes:
Increase your chart timeframe (go from 15m to 1H)
Switch to a less volatile ticker
Only trade when hyper frame bias is STRONG (not neutral)
Add a minimum bar count between signals
"The info table is covering my price action"
Fix:
Edit the script
Find the line: table.new(position.top_right, ...
Change position.top_right to position.bottom_right or position.top_left
"Signals appear then disappear"
This is normal (repainting). Some signals (especially compression breakouts) can disappear if the next bar reverses. This is why you:
Wait for bar close before acting
Use alerts that only fire on confirmed bars
Don't chase signals mid-bar
Final Thoughts
This script is a decision-making tool, not a crystal ball. It shows you high-probability setups based on EMA dynamics and trend structure. You still need to:
Manage your risk
Choose your position size
Stick to the rules
Accept losses when they happen
The system works when YOU work the system.
Print this guide, tape it next to your monitor, and follow it religiously for 20 trades before making ANY changes.
Good luck, and stay lazy (the smart way).

Cold Brew Ranges🧭 Core Logic and Calculation
The fundamental logic for each range (OR and CR) is identical:
Time Definition: Each range is defined by a specific Start Time and a fixed 30-second duration. The timestamp function, using the "America/New_York" time zone, is used to calculate the exact start time in Unix milliseconds for the current day.
Example: t0200 = timestamp(TZ, yC, mC, dC, 2, 0, 0) sets the start time for the 02:00 OR to 2:00:00 AM NY time.
Range Data Collection: The indicator uses the request.security_lower_tf() function to collect the High (hArr) and Low (lArr) prices of all bars that fall within the defined 30-second window, using a user-specified, sub-chart-timeframe (openrangetime, defaulted to "1" second, "30S", or "5" minutes). This ensures high precision in capturing the exact high and low during the 30-second window.
High/Low Determination: It iteratively finds the absolute highest price (OR_high) and the absolute lowest price (OR_low) recorded by the bars during that 30-second window.
Range Locking: Once the current chart bar's time (lastTs) passes the 30-second End Time (tEnd), the High and Low are locked (OR_locked = true), meaning the range calculation is complete for the day.
Drawing: Upon locking, the range is drawn on the chart using line.new for the High, Low, and Equilibrium, and box.new for the shaded fill. The lines are extended to a subsequent time anchor point (e.g., the 02:00 OR is extended to 08:20, the 09:30 OR is extended to 16:00).
Equilibrium (EQ): This is calculated as the simple average (midpoint) of the High and Low of the range.
EQ=
2
OR_High+OR_Low
⏰ Defined Trading Ranges
The indicator defines and tracks the following specific 30-second ranges:
Range Name Type Start Time (NY) Line Extension End Time (NY) Common Market Context
02:00 OR Opening 02:00:00 08:20:00 Asian/European Market Overlap
08:20 OR Opening 08:20:00 16:00:00 Pre-New York Open
09:30 OR Opening 09:30:00 16:00:00 New York Stock Exchange Open (Most significant OR)
18:00 OR Opening 18:00:00 20:00:00 Futures Market Open (Sunday/Monday)
20:00 OR Opening 20:00:00 Next Day's session start Asian Session Start
15:50 CR Closing 15:50:00 20:00:00 New York Close Range
⚙️ Key User Inputs and Customization
The script offers extensive control over which ranges are displayed and how they are visualized:
Range Time & History
openrangetime: Sets the sub-timeframe (e.g., "1" for 1 second) used to calculate the precise High/Low of the 30-second range. Crucial for accuracy.
showHistory: A toggle to show the ranges from previous days (up to a histCap of 50 days).
Range Toggles and Styling
On/Off Toggles: Independent input.bool (e.g., OR_0200_on) to enable or disable the display of each individual range.
Colors & Width: Separate color and width inputs for the High/Low lines (hlC), the Equilibrium line (eqC), and the background fill (fillC) for each range.
Line Styles: Global inputs for the line styles of High/Low (lineStyleInput) and Equilibrium (eqLineStyleInput) lines (Solid, Dotted, or Dashed).
showFill: Global toggle to enable the shaded background box that highlights the area between the High and Low.
Extensions
The script calculates and plots extensions (multiples of the initial range) above the High and below the Low.
showExt: Toggles the visibility of the extension lines.
useRangeMultiples: If true, the step size for each extension level is equal to the initial range size:
Step=Range=OR_High−OR_Low
If false, the step size is a fixed value defined by stepPts (e.g., 60.0 points, which is a common value for NQ futures).
stepCnt: Determines how many extension levels (multiples) are drawn above and below the range (default is 10).
📈 Trading Strategy Implications
The Cold Brew Ranges indicator is a tool for session-based support and resistance and range breakout/reversal strategies.
Key Support/Resistance: The High and Low of these defined opening ranges often act as strong, predefined price levels. Traders look for price rejection off these boundaries or a breakout with conviction.
Equilibrium (Midpoint): The EQ often represents a fair value for that specific session's opening. Movements away from it are seen as opportunities, and a return to it is common.
Extensions: The range extensions serve as potential profit targets or stronger, layered support/resistance levels if the market trends aggressively after the opening range is set.
The core idea is that the activity in the first 30 seconds of a significant trading session (like the NYSE or a market session open) sets a bias and initial boundary for the trading period that follows.

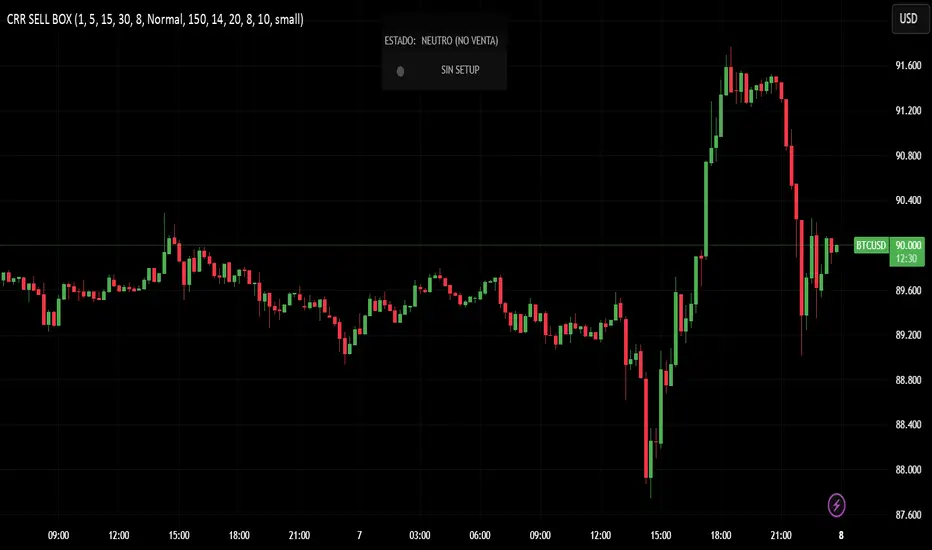
CRR SELL BOX MICROWhat it analyzes
Multi-TF:
1m, 5m, 15m, 30m (tf1–tf4).
In each timeframe it looks at:
EMA 15 / 30 / 200 → trend.
MACD → momentum.
RSI → strength.
From this it derives:
t1, t2, t3, t4 = +1 bullish, -1 bearish, 0 neutral.
A bearScore = how many TFs are bearish → multiTfBear.
Volatility / momentum:
ATR in pips (atrPips) → checks for sufficient movement (sufAtr).
1m candlestick body in pips → momentumBear1
(large bearish candle + MACD bearish + RSI bearish).
Strong downward candle in ticks (bigDrop) → type of large vertical red candle.
Global sensitivity:
Mode: Normal / High / Turbo
Automatically adjusts:
Minimum drop in ticks,
Minimum candlestick body,
Minimum ATR.
2️⃣ Main Sell Signal
SELL WITHOUT PULLBACK 1m
sellNoPull:
EMA 15 < EMA 30 < EMA 200 (strong bearish trend 1m),
MACD crosses bearish,
Price below EMA30 1m.
Multi-TF Bear
multiTfBear:
Normal Mode: 1m bearish and 5m–15m–30m not bullish,
High/Turbo Mode: at least 2 bearish TFs (bearScore >= 2).
Final condition (what triggers the setup)
Conservative:
condSellConservative = sellNoPull + multiTfBear + sufAtr + momentumBear1
Aggressive:
condSellAggressive = (t1 == -1 or bigDrop) + 15m not bullish + sufAtr
Final:
condSellFinal
If aggressiveMicro = true → uses aggressive logic.
Otherwise → uses conservative logic.
When condSellFinal is true:
It is considered a valid sell setup for scalping / micro. 3️⃣ States it shows you
Depending on what it detects:
🔴 "MICRO SELL 10-20p"
(aggressive mode ON + everything aligned for a quick drop).
🟥 "SCALPING SELL"
(if you're in conservative mode).
🟧 "NORMAL SELL"
(multi-timeframe bearish but without a strong trigger).
⚪ "NEUTRAL (NO SELL)"
(no setup).
Extra info (below the light bulb):
"STRONG DROP" if there's a large red candlestick indicating a sharp decline.
"MULTI TF BEARISH" if several timeframes are bearish.
"NO SETUP" if conditions are not met.
4️⃣ HUD + Session Clock
Compact HUD at the top center:
Row 1: STATUS: MICRO SELL / NORMAL SELL / NEUTRAL.
Row 2: Light bulb ● (red, orange, or gray) + extra info text.
New York Clock:
Detects session: TOKYO / LONDON / NEW YORK
(for trading time context only).
5️⃣ Alerts
When condSellFinal is met, it triggers:
"CRR SCALPING/MICRO SELL - sell signal activated"
🧠 In simple terms:
It's your specialized SELL radar:
It combines multi-timeframe analysis, momentum, ATR, and strong bearish candlesticks to alert you when gold is ready for a quick 10-20 pip short trade or a more serious bearish scalp.
CRR BUY What it analyzes
4 timeframes:
1m, 5m, 15m, and 30m.
In each timeframe it looks at:
EMA 15 / 30 / 200 → trend.
MACD → momentum.
RSI → strength.
From this it derives:
t1, t2, t3, t4 = +1 bullish, -1 bearish, 0 neutral.
A multi-timeframe bullScore (how many timeframes are bullish).
2️⃣ Volatility / momentum filters
ATR in pips → checks if there is enough movement (suffAtr).
1m candlestick body in pips → momentumBull1
(strong bullish candle with bullish MACD + bullish RSI).
Strong upward candle (bigPump) measured in ticks/pips.
Sensitivity mode:
Normal / High / Turbo → loosens or tightens filters for:
Strong candle,
Minimum body,
Minimum ATR.
3️⃣ Buy logic
There are three levels:
condBuyConservative
CLASSIC BUY WITHOUT RETRACEMENT:
Strong 1m trend, bullish MACD crossover, price above EMA30, + 1m momentum, + sufficient ATR, + multi-timeframe bullish.
condBuyAggressive (if using aggressive mode):
It's enough to have:
1m bullish (t1 == 1) or bigPump,
15m not bearish,
Sufficient ATR.
condBuyFinal
If aggressiveMicro = true → uses condBuyAggressive.
Otherwise → uses condBuyConservative.
Based on this, it displays states:
✅ "MICRO BUY 10-20p" (aggressive mode ON and everything aligned)
✅ "SCALPING BUY" (conservative mode with confirmations)
✅ "NORMAL BUY" (multi-timeframe bullish but without a strong trigger)
⛔ "NEUTRAL (NO BUY)" (no setup)
And triggers an alert:
CRR SCALPING BUY when condBuyFinal is met.
4️⃣ HUD and sessions
Detects session by New York time:
TOKYO / LONDON / NEW YORK (different color). Compact HUD at the top center with:
STATUS (buy or neutral text),
Green/teal/gray light bulb icon (●),
Extra info:
"STRONG UPTREND" if there's a big pump,
"MULTI TF BULLISH" if many timeframes are bullish,
"NO SETUP" if there's nothing.
🧠 In simple terms:
It's a BUY ONLY bullish radar for scalping/micro trading, which combines multi-timeframe analysis + momentum + ATR + strong candlestick patterns, summarizes it in a HUD, and sends you an alert when there's a real setup to go long.Qué analiza
4 marcos de tiempo:
1m, 5m, 15m y 30m.
En cada TF mira:
EMA 15 / 30 / 200 → tendencia.
MACD → impulso.
RSI → fuerza.
De ahí saca:
t1, t2, t3, t4 = +1 toro, -1 oso, 0 neutro.
Un bullScore multi–TF (cuántos TF están alcistas).
2️⃣ Filtros de volatilidad / momentum
ATR en pips → comprueba si hay suficiente movimiento (sufAtr).
Cuerpo de la vela 1m en pips → momentumBull1
(vela alcista fuerte con MACD bull + RSI bull).
Vela de subida fuerte (bigPump) medida en ticks/pips.
Modo sensibilidad:
Normal / Alta / Turbo → relaja o endurece filtros de:
Vela fuerte,
Cuerpo mínimo,
ATR mínimo.
3️⃣ Lógica de compra
Hay tres niveles:
condBuyConservador
BUY SIN RETRO clásico:
Tendencia 1m fuerte, cruce MACD bull, precio sobre EMA30, + momentum 1m, + ATR ok, + multi–TF bull.
condBuyAgresivo (si usas modo agresivo):
Basta con:
1m toro (t1 == 1) o bigPump,
15m no bajista,
ATR suficiente.
condBuyFinal
Si aggressiveMicro = true → usa condBuyAgresivo.
Si no → usa condBuyConservador.
Según eso, muestra estados:
✅ "COMPRA MICRO 10-20p" (modo agresivo ON y todo alineado)
✅ "COMPRA SCALPING" (modo conservador con confirmaciones)
✅ "COMPRA NORMAL" (multi–TF alcista pero sin trigger fuerte)
⛔ "NEUTRO (NO COMPRA)" (no hay setup)
Y dispara alerta:
CRR COMPRA SCALPING cuando condBuyFinal se cumple.
4️⃣ HUD y sesiones
Detecta sesión por hora de New York:
TOKIO / LONDRES / NEW YORK (color distinto).
HUD compacto arriba al centro con:
ESTADO (texto de compra o neutro),
Bombillo (●) verde/teal/gris,
Info extra:
"SUBIDA FUERTE" si hay bigPump,
"MULTI TF ALCISTA" si muchos TF están bull,
"SIN SETUP" si no hay nada.
🧠 En simple:
Es un radar de COMPRA SOLO BULL para scalping/micro, que mezcla multi–TF + momentum + ATR + vela fuerte, te lo resume en un HUD y te manda alerta cuando hay setup real para disparar largo.

CRR - GANAEMAs on the chart (visual trend)
EMA 15 (white), 30 (yellow), 200 (red).
2️⃣ DASH Engine 1m–5m–15m (+ 1H and 1D)
For each TF (1m, 5m, 15m) it calculates a bull/bear score using:
EMA structure (15, 30, 50, 100, 200).
MACD.
RSI.
Relationship with EMA 30 and VWAP.
FVG in favor.
ATR change (volatility **increasing**).
From this it derives:
t1 (1m), t2 (5m), t3 (15m),
t4 (1H) and t5 (1D) (only for EMA200).
It detects:
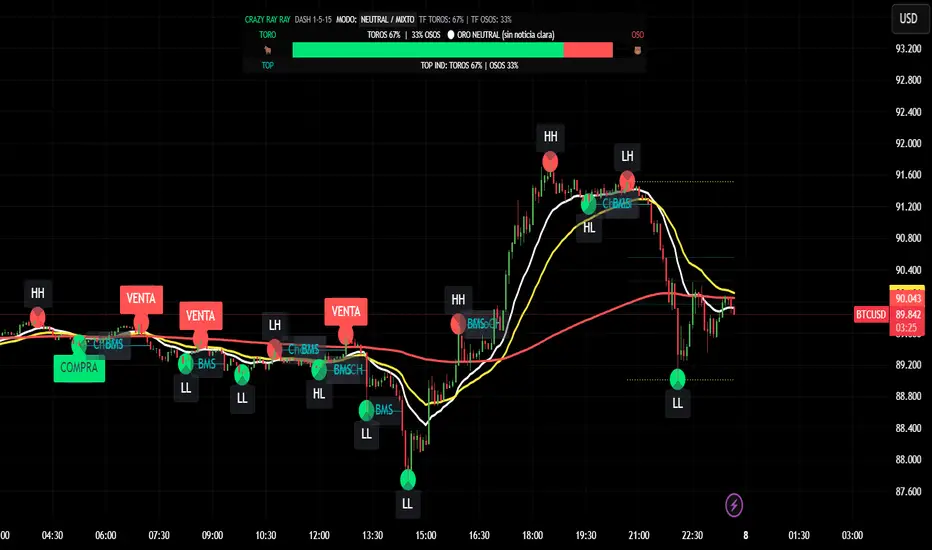
ALL BULL → “BULLISH - BUYS ONLY”.
ALL BEAR → “BEARISH - SELLS ONLY”.
Otherwise → “NEUTRAL / MIXED”.
In addition:
Calculates BULL TF vs BEAR TF (%) between 1m–5m–15m.
Displays a visual bar 🐂🟩 vs 🐻🟥.
3️⃣ GOLD News (manual)
Special bar that says:
Neutral
BUY (positive)
SELL (negative)
Paints the HUD with color according to the news you select.
4️⃣ NO RETRACEMENT Alerts (beast mode 💣)
Very strict conditions using the 5 TFs:
BUY NO RETRACEMENT if:
4 or more TFs in bull mode (bullTF_all >= 4),
1m ultra bull (EMA bull, RSI>60, MACD bull, high volume, price above EMA15 and VWAP, FVG ≥ 0).
SELL NO RETRACEMENT is the same but bearish.
Creates alerts:
CRR BUY NO RETRACEMENT
CRR SELL NO RETRACEMENT
5️⃣ PRO LITE Patterns: Double Top / Double Bottom
Detects double tops and double bottoms with:
Minimum bar distance.
Tolerance in %. Optional filters:
MACD, RSI, ATR (volatility), volume, FVG.
If everything aligns:
Plots SELL at double top.
Plots BUY at double bottom.
6️⃣ TOP Indicators Block (SMI + WaveTrend + Supertrend)
SMI (momentum), WaveTrend, and Supertrend:
Counts which are in bull mode and which are in bear mode.
Displays:
TOP IND: BULLS XX% | BEARS YY%.
7️⃣ Integrated Internal SMC Module
Structure HH, LH, HL, LL.
BMS (break of structure) and ChoCH (change of character).
Filter with ATR + volume + MACD + gaps.
Internal Fibonacci of the last range (38.2, 50, 61.8).
Dotted yellow lines of the current range (swing high/low).
🧠 In short:
It's your command center for XAUUSD:
Global mode (buy only / sell only / mixed),
% of timeframes favoring bulls/bears,
gold news,
no-lag alerts,
filtered double top/bottom,
TOP indicators,
and complete SMC (structure + BMS/ChoCH + Fibonacci + range)...
all integrated into a single CRAZY RAY RAY HUD
Top 20 Adaptive Momentum [Trend Aligned]his script is an automated End-of-Day Momentum Dashboard designed to predict the next trading day's directional bias for the top 20 most volatile stocks. It analyzes institutional price action during the final 10 minutes of the trading session and filters signals based on the long-term trend.
How It Works
Trend Identification: The script calculates a 50-Day Moving Average proxy (using 5-minute data) to determine if a stock is in a Long-Term Uptrend or Downtrend.
Adaptive Signal Logic: Instead of a simple reversal strategy, the script adapts its prediction based on the trend context:
Trend Following: If a stock closes strong (Green) in an Uptrend, it signals Bullish Momentum (continuation).
Mean Reversion: If a stock closes strong (Green) in a Downtrend, it signals Bearish Reversion (fade the bounce).
Dip Buying: If a stock closes weak (Red) in an Uptrend, it signals Bullish Reversion (buy the dip).
Live Backtesting: The dashboard features a "Win Rate (3M)" column. This metric backtests the strategy over the past 3 months for each specific ticker, calculating the percentage of time the predicted bias resulted in a winning trade the following day.
Dashboard Columns
Ticker: The stock symbol.
Prev Day: The overall close vs. open of the previous session.
Trend (50d): The long-term trend direction (UP or DOWN).
BIAS TODAY: The actionable signal for the current session (📈 BULLISH or 📉 BEARISH).
Win Rate: The historical probability of success for this strategy on this specific stock.
Usage: Use this tool pre-market to identify high-probability setups where the previous day's closing momentum aligns with the long-term trend.
To effectively use the Top 20 Adaptive Momentum script, you need to treat it as a Pre-Market Screener. It performs the heavy lifting of analyzing trend, momentum, and historical probability instantly, giving you a "Cheat Sheet" for the trading day.
Here is a step-by-step guide on how to integrate it into your routine:
1. The Setup
Timeframe: Set your chart to 5 Minutes. The logic specifically hunts for the 15:50 (3:50 PM) and 15:55 (3:55 PM) candles, so the calculation works best on this timeframe.
Timing: Check this dashboard before the market opens (e.g., 9:00 AM EST) or shortly after the close (4:05 PM EST) to plan for the next session.
2. Reading the Dashboard Columns
Column What to Look For Actionable Insight
Trend (50d) UP (Green) or DOWN (Red) This tells you the "Big Picture." Only trade in this direction. If Trend is UP, you only want to see Bullish signals. If Trend is DOWN, you only want Bearish signals.
BIAS TODAY 📈 BULLISH Plan: Look for Long/Buy setups at the open. The algorithm predicts price will close higher today.
📉 BEARISH Plan: Look for Short/Sell setups at the open. The algorithm predicts price will close lower.
Win Rate (3M) Percentage (e.g., 65%) Confidence Filter. Only take trades on stocks with a Win Rate above 55-60%. This proves the stock historically respects this specific strategy.
3. The Strategy Scenarios (How to Trade)
Scenario A: The "Trend Continuation" (High Probability)
Dashboard: Trend is UP + Bias is BULLISH.
Context: The stock is strong long-term, and it closed strong yesterday (Momentum).
Execution: Watch for an opening gap up or an early breakout above the pre-market high. Go Long.
Scenario B: The "Dip Buy" (High Probability)
Dashboard: Trend is UP + Bias is BULLISH.
Context: The stock is strong long-term, but it pulled back yesterday (Weak Close). The script identifies this as a discount, not a reversal.
Execution: Watch for the stock to find support early. Use the "Master Sniper" (from your other script) to find a Discount Entry FVG.
Scenario C: The "Trap" (Avoid)
Dashboard: Win Rate is < 50%.
Context: The stock is choppy or news-driven. It does not follow technical momentum rules reliably.
Execution: Skip this stock. Move to the next one on the list.
4. Execution Workflow
Scan: Glance at the dashboard. Identify the 2-3 stocks with Green Bias + Green Trend (for Buys) or Red Bias + Red Trend (for Shorts).
Filter: Ensure their "Win Rate" is decent (over 55%).
Trade: Open the charts for those specific stocks. Use your execution indicators (like the Master Sniper) to time the entry on the 1-minute or 5-minute chart.
By using this dashboard, you stop guessing which stock to trade and focus entirely on executing the best setups.

BB Breakout-Momentum + Reversion Strategies# BB Breakout-Momentum + Reversion Strategies
## Overview
This indicator combines two complementary Bollinger Band trading strategies that automatically adapt to market conditions. Strategy 1 capitalizes on trending markets with breakout-pullback-momentum setups, while Strategy 2 exploits mean reversion in ranging markets. Advanced filtering using ADX and BB Width ensures each strategy only fires in its optimal market environment.
---
## Strategy 1: Breakout → Pullback → Renewed Momentum (Long B / Short B)
### Best Market Conditions
- **Trending Markets**: ADX ≥ 25
- **High Volatility**: BB Width ≥ 1.0× average
- Directional price action with sustained momentum
### Entry Logic
**Long B (Bullish Breakout):**
1. **Initial Breakout**: Price breaks above upper Bollinger Band with strong momentum
2. **Controlled Pullback**: Price pulls back 1-12 bars but holds above lower band (stays in trend)
3. **Defended Zone**: Pullback creates a support zone based on swing lows (validated by multiple touches)
4. **Renewed Momentum**: Price reclaims with green candle, volume confirmation, bullish MACD
5. **Position Check**: Entry must have cushion below upper band and room to reach targets
**Short B (Bearish Breakdown):**
- Mirror logic for downtrends: breakdown below lower band, pullback stays below upper band, renewed selling pressure
### Risk Management
- **Stop Loss**: Lower of (zone floor/previous low) OR (1.5 × ATR from entry)
- **Targets**:
- T1: Entry + 0.85R (0.85 × 1.5 ATR)
- T2: Entry + 1.40R (1.40 × 1.5 ATR)
- T3: Entry + 2.50R (2.50 × 1.5 ATR)
- T4: Entry + 4.50R (4.50 × 1.5 ATR)
- Risk is calculated using ATR (ATRX = 1.5 ATR), stop uses tighter of structural level (ATRL) or ATRX
---
## Strategy 2: Bollinger Band Mean Reversion (Long R / Short R)
### Best Market Conditions
- **Ranging Markets**: ADX ≤ 20
- **Low Volatility**: BB Width ≤ 0.8× average
- Price oscillating around the mean without sustained trend
### Entry Logic
**Long R (Long Reversion):**
1. **Overextension**: Price breaks below lower Bollinger Band (2 consecutive closes)
2. **Snap Back**: Price crosses back above lower band (re-enters the range)
3. **Entry Window**: Within 2 candles of re-entry, look for:
- **Green candle** (close > open) confirming bullish strength
- Close above previous candle (close > close )
4. **Trigger**: First qualifying candle within 2-bar window executes the trade
**Short R (Short Reversion):**
1. **Overextension**: Price breaks above upper Bollinger Band (2 consecutive closes)
2. **Snap Back**: Price crosses back below upper band (re-enters the range)
3. **Entry Window**: Within 2 candles of re-entry, look for:
- **Red candle** (close < open) confirming bearish pressure
- Close below previous candle (close < close )
4. **Trigger**: First qualifying candle within 2-bar window executes the trade
### Risk Management
- **Stop Loss**: Lower of (previous high/low) OR (1.5 × ATR from entry)
- **Targets**: Same as Strategy 1 (0.85R, 1.4R, 2.5R, 4.5R based on 1.5 ATR)
- Betting on return to Bollinger Band basis (mean)
---
## Advanced Filtering System
### ADX Filter (Average Directional Index)
- **Purpose**: Measures trend strength vs choppy/ranging conditions
- **Trending**: ADX ≥ 25 → Enables Strategy 1 (Breakout)
- **Ranging**: ADX ≤ 20 → Enables Strategy 2 (Reversion)
- **Neutral**: ADX 20-25 → No signals (indecisive market)
### BB Width Filter
- **Purpose**: Confirms volatility expansion/contraction
- **Wide Bands**: Current width ≥ 1.0× 50-bar average → Trending environment
- **Narrow Bands**: Current width ≤ 0.8× 50-bar average → Ranging environment
- **Logic**: Both ADX and BB Width must agree on market state before signaling
### Combined Logic
- **Strategy 1 fires**: When BOTH ADX shows trending AND bands are wide
- **Strategy 2 fires**: When BOTH ADX shows ranging AND bands are narrow
- **Visual Display**: Table at bottom-right shows ADX value, BB Width ratio, and current market state
---
## Visual Elements
### Bollinger Bands
- **Gray line**: 20-period SMA (basis/mean)
- **Green line**: Upper band (basis + 2 standard deviations)
- **Red line**: Lower band (basis - 2 standard deviations)
### Strategy 1 Markers
- **Long B**: Green triangle below bar with "Long B" text
- **Short B**: Orange triangle above bar with "Short B" text
- **Defended Zones**: Green/red boxes showing pullback support/resistance areas
- **Targets**: Green/orange crosses showing T1-T4 and stop loss levels
### Strategy 2 Markers
- **Long R**: Blue label below bar with "Long R" text
- **Short R**: Purple label above bar with "Short R" text
- **Trade Levels**: Horizontal lines extending 50 bars forward
- Blue solid = Entry price
- Red dashed = Stop loss
- Green/Orange dotted = Targets (T1-T4)
### Market State Table
- **ADX**: Current value with color coding (green=trending, orange=ranging, gray=neutral)
- **BB Width**: Ratio vs 50-bar average (e.g., "1.15x" = 15% wider than average)
- **State**: TREND / RANGE / NEUTRAL classification
---
## Settings & Customization
### Bollinger Bands
- **BB Length**: 20 (default) - period for moving average
- **BB Std Dev**: 2.0 (default) - standard deviation multiplier
### ATR & Risk
- **ATR Length**: 14 (default) - period for Average True Range calculation
- All stop losses and targets are derived from 1.5 × ATR
### Trend/Range Filters
- **ADX Length**: 14 (default)
- **ADX Trending Threshold**: 25 (higher = stronger trend required)
- **ADX Ranging Threshold**: 20 (lower = tighter ranging condition)
- **BB Width Average Length**: 50 (period for comparing current width)
- **BB Width Trend Multiplier**: 1.0 (width must be ≥ this × average)
- **BB Width Range Multiplier**: 0.8 (width must be ≤ this × average)
- **Use ADX Filter**: Toggle on/off
- **Use BB Width Filter**: Toggle on/off
### Strategy 1 (Breakout-Momentum)
- **Breakout Lookback**: 15 bars (how far back to search for initial breakout)
- **Min Pullback Bars**: 1 (minimum consolidation period)
- **Max Pullback Bars**: 12 (maximum consolidation period)
- **Show Defended Zone**: Display support/resistance boxes
- **Show Signals**: Display Long B / Short B markers
- **Show Targets**: Display stop loss and target levels
### Strategy 2 (Reversion)
- **Show Signals**: Display Long R / Short R markers
- **Show Trade Levels**: Display entry, stop, and target lines
---
## How to Use This Indicator
### Step 1: Identify Market State
- Check the table in bottom-right corner
- **TREND**: Look for Strategy 1 signals (Long B / Short B)
- **RANGE**: Look for Strategy 2 signals (Long R / Short R)
- **NEUTRAL**: Wait for clearer conditions
### Step 2: Wait for Signal
- Signals only fire when ALL conditions are met (structural + momentum + filters + room-to-target)
- Signals are relatively rare but high-probability
### Step 3: Execute Trade
- **Entry**: Close of signal candle
- **Stop Loss**: Shown as red cross (Strategy 1) or red dashed line (Strategy 2)
- **Targets**: Scale out at T1, T2, T3, T4 or hold for maximum R:R
### Step 4: Management
- Consider moving stop to breakeven after T1
- Trail stop using swing lows/highs in Strategy 1
- Exit full position at T2-T3 in Strategy 2 (mean reversion has limited upside)
---
## Key Principles
### Why This Works
1. **Market Adaptation**: Uses right strategy for right conditions (trend vs range)
2. **Confluence**: Multiple confirmations required (structure + momentum + volatility + room)
3. **Risk-Defined**: Every trade has pre-calculated stop and targets based on ATR
4. **Probability**: Filters reduce noise and increase win rate by waiting for ideal setups
### Common Pitfalls to Avoid
- ❌ Taking signals in NEUTRAL market state (indicators disagree)
- ❌ Overriding the stop loss (it's calculated for a reason)
- ❌ Expecting signals on every swing (quality over quantity)
- ❌ Using Strategy 1 in ranging markets or Strategy 2 in trending markets
- ❌ Ignoring the room-to-target check (signal won't fire if targets are blocked)
### Complementary Analysis
This indicator works best when combined with:
- Higher timeframe trend analysis
- Key support/resistance levels
- Volume analysis
- Market structure (swing highs/lows)
- Risk management rules (position sizing, max daily loss, etc.)
---
## Technical Details
### Indicators Used
- **Bollinger Bands**: 20-period SMA ± 2 standard deviations
- **ATR**: 14-period Average True Range for volatility measurement
- **ADX**: 14-period Average Directional Index for trend strength
- **EMA**: 10 and 20-period exponential moving averages (Strategy 1 filter)
- **MACD**: 12/26/9 settings (Strategy 1 momentum confirmation)
- **Volume**: Compared to 15-bar average (Strategy 1 confirmation)
### Calculation Methodology
- **ATRL** (Structural Risk): Previous swing high/low or defended zone boundary
- **ATRX** (ATR Risk): 1.5 × 14-period ATR from entry price
- **Stop Loss**: Minimum of ATRL and ATRX (tightest protection)
- **Targets**: Always calculated from ATRX (consistent R-multiples)
- **BB Width Ratio**: Current BB width ÷ 50-period SMA of BB width
---
## Performance Notes
### Strengths
- Adapts to changing market conditions automatically
- Clear, objective entry and exit criteria
- Pre-defined risk on every trade
- Filters reduce false signals significantly
- Works across multiple timeframes and instruments
### Limitations
- Signals are infrequent (by design - quality over quantity)
- Requires patience to wait for all conditions to align
- May miss explosive moves if pullback doesn't form properly (Strategy 1)
- Ranging markets can transition to trending (Strategy 2 risk)
- Filters may delay entry in fast-moving markets
### Best Timeframes
- **Strategy 1**: 1H, 4H, Daily (needs time for proper pullback structure)
- **Strategy 2**: 15M, 30M, 1H (mean reversion works best intraday)
- Both strategies can work on any timeframe if market conditions are right
### Best Instruments
- **Liquid markets**: Major stocks, indices, forex pairs, liquid crypto
- **Sufficient volatility**: ATR should be meaningful relative to price
- **Clear trend/range cycles**: Markets that respect technical levels
---
## IMPORTANT DISCLAIMER
### Risk Warning
**TRADING INVOLVES SUBSTANTIAL RISK OF LOSS AND IS NOT SUITABLE FOR ALL INVESTORS.**
This indicator is provided for **educational and informational purposes only**. It does not constitute financial advice, investment advice, trading advice, or any other sort of advice. You should not treat any of the indicator's content as such.
### No Guarantee of Profit
Past performance is not indicative of future results. No trading strategy, including this indicator, can guarantee profits or protect against losses. The market is inherently unpredictable and all trading involves risk.
### User Responsibility
- **Do Your Own Research**: Always conduct your own analysis before making trading decisions
- **Test First**: Backtest and paper trade this strategy before risking real capital
- **Risk Management**: Never risk more than you can afford to lose
- **Position Sizing**: Use appropriate position sizes relative to your account
- **Stop Losses**: Always use stop losses and respect them
- **Market Conditions**: Understand that market conditions change and past behavior may not repeat
### No Liability
The creator of this indicator accepts no liability for any financial losses incurred through the use of this tool. All trading decisions are made at your own risk. You are solely responsible for evaluating the merits and risks associated with the use of any trading systems, signals, or content provided.
### Not Financial Advice
This indicator does not take into account your personal financial situation, investment objectives, risk tolerance, or specific needs. You should consult with a licensed financial advisor before making any investment decisions.
### Technical Limitations
- Indicators can repaint or lag in real-time
- Past signals may look different than real-time signals
- Code bugs or errors may exist despite testing
- TradingView platform limitations may affect functionality
### Market Risks
- Markets can gap, causing stops to be executed at worse prices
- Slippage and commissions can significantly impact results
- High volatility can cause unexpected losses
- Counterparty risk exists in all leveraged products
---
## Version History
- **v1.0**: Initial release combining breakout-momentum and mean reversion strategies
- Includes ADX and BB Width filtering
- ATRL/ATRX risk calculation system
- 2-candle entry window for reversion trades
---
## Credits & License
This indicator combines concepts from classical technical analysis including Bollinger Bands (John Bollinger), ATR (Welles Wilder), and ADX (Welles Wilder). The specific implementation and combination of filters is original work.
**Use at your own risk. Trade responsibly.**
---
*For questions, suggestions, or to report bugs, please comment below or contact the author.*
**Remember: The best indicator is the one between your ears. Use this tool as part of a comprehensive trading plan, not as a standalone solution.**

3-bar Swing Liquidity Grab📊 3-BAR SWING LIQUIDITY GRAB
WHAT IT DOES
Automatically detects 3-bar swing highs/lows and alerts you to liquidity grab moments — when price breaks structural levels to trigger stop-losses, then reverses.
SIGNALS AT A GLANCE
Signal What It Means Trade Idea
SH 🟠▼ Swing High (Resistance) Reference level
SL 🔵▲ Swing Low (Support) Reference level
LQH 🔴❌ Fake break ABOVE resistance SHORT ⬇️
LQL 🟢❌ Fake break BELOW support LONG ⬆️
HOW TO TRADE IT
Spot the trend — Is price going up or down?
Wait for signal — LQL (green) in uptrend, LQH (red) in downtrend
Enter on signal — Place order on that bar
Stop Loss — Just outside the swing level
Take Profit — At the next swing level
SETTINGS EXPLAINED
Swing length: 1 = 3-bar swing, 2 = 5-bar swing (use 1 for scalp, 2 for larger TF)
Lookback bars: Time window to find liquidity grabs (10-20 for scalp, 50+ for position)
Toggles: Show/hide swing markers and signals
BEST ON THESE TIMEFRAMES
TF Type Settings
M5-M15 Scalp SL: 1, LB: 10-15
M15-H1 Intraday SL: 1, LB: 15-20
H1-H4 Swing SL: 1-2, LB: 20-50
D+ Position SL: 2, LB: 50+
KEY RULES
✅ DO:
Trade signals aligned with major trend
Always use stop loss
Use 2-5% risk per trade
Confirm with price action
❌ DON'T:
Trade choppy/sideways markets
Ignore the trend
Chase signals
Overtrade
REAL EXAMPLE
LONG Trade (LQL Signal):
text
Uptrend → Swing Low forms at 1.0950
→ Price dips to 1.0930 (below SL)
→ Closes at 1.0955 (above SL) = GREEN ❌ (LQL)
→ BUY at 1.0960
→ Stop Loss: 1.0920
→ Take Profit: 1.1050 (previous Swing High)
WORKS ON
✅ Crypto (Bitcoin, Ethereum, Altcoins)
✅ Forex (EUR/USD, GBP/USD, etc.)
✅ Stocks & Indices
✅ Commodities (Gold, Oil, etc.)
Any asset, any timeframe, any market.
DISCLAIMER
This is a technical analysis tool, not financial advice. Past performance does not guarantee future results. Always use proper risk management and test on a demo account first.

Helix Protocol 7HELIX PROTOCOL 7
Overview
Helix Protocol 7 is an advanced trend-adaptive signal engine that dynamically adjusts its buy/sell thresholds based on real-time market regime detection. Unlike static indicators that use fixed overbought/oversold levels, Helix 7 recognizes that optimal entry and exit points shift dramatically depending on whether the market is trending strongly, ranging, or reversing.
The indicator fuses multiple analytical frameworks—momentum oscillators, trend strength metrics, volatility analysis, volume confirmation, and price structure—into a unified signal system that adapts to changing market conditions in real-time.
Core Philosophy
"Don't fight the trend—adapt to it."
In a strong uptrend, you want to buy dips early (before extreme oversold) and let winners run longer
In a downtrend, you want to sell bounces quickly and only buy true capitulation
In a neutral/ranging market, standard overbought/oversold levels apply
Helix Protocol 7 automatically detects which regime you're in and applies the appropriate thresholds.
Key Features
🔄 Trend-Adaptive Signal Thresholds
The indicator classifies markets into four states and adjusts Fisher Transform and RSI thresholds accordingly:
Trend StateDetection CriteriaBUY TriggersSELL TriggersSTRONG UPTRENDADX rising, ADX > 25, +DI > -DIFisher < 1.0, RSI < 50Fisher > 2.5, RSI > 70STRONG DOWNTRENDADX rising, ADX > 25, -DI > +DIFisher < -2.5, RSI < 25Fisher > 1.5, RSI > 60WEAK DOWNTRENDADX falling, -DI > +DIFisher < -2.5, RSI < 25Fisher > 1.5, RSI > 60NEUTRALDefault fallbackFisher < -2.0, RSI < 30Fisher > 2.0, RSI > 65
📊 Dynamic Envelope Bands
Adaptive bands that expand and contract based on:
ATR (Average True Range) - Base volatility measure
ADX (Trend Strength) - Bands widen in strong trends
Chaikin Oscillator - Volume-weighted band adjustment
🎯 Multi-Trigger Signal System
Signals can fire from multiple sources:
Trend-Based Signals - Fisher + RSI thresholds met for current regime
Band Touch Signals - Price touches upper/lower band (support/resistance)
EXTREME Signals - Price penetrates band by significant amount (bypasses cooldown)
⚡ Extreme Move Detection
When price makes an explosive move that penetrates the band by more than 30% of ATR (configurable), the signal fires with EXTREME priority and bypasses the normal cooldown period. This ensures you never miss major reversal opportunities.
📈 GXS Scoring System
A proprietary multi-factor scoring system (-1.0 to +1.0) that weighs:
Trend Strength (30%) - ADX direction and magnitude
Momentum (25%) - RSI, MACD, Stochastic, CCI, ROC consensus
Volume (20%) - OBV trend and volume surge detection
Price Structure (15%) - Band position and volatility percentile
Price Action (10%) - Bullish/bearish candle ratio
🔀 RSI Divergence Detection
Automatically detects and displays:
Regular Bullish Divergence - Price lower low + RSI higher low (reversal up)
Regular Bearish Divergence - Price higher high + RSI lower high (reversal down)
Hidden Bullish Divergence - Trend continuation signal (uptrend)
Hidden Bearish Divergence - Trend continuation signal (downtrend)
📉 BBWP Volatility Meter
Bollinger Band Width Percentile measures current volatility relative to historical norms:
LOW (< 30%) - Volatility compression, breakout imminent
MEDIUM (30-70%) - Normal market conditions
HIGH (> 70%) - Extended volatility, potential exhaustion
Visual Components
Money Line
A dynamic centerline (Linear Regression or Weighted EMA) colored by slope:
🟢 Green - Rising (bullish momentum)
🔴 Red - Falling (bearish momentum)
🟡 Yellow - Flat (consolidation)
Envelope Cloud
Shaded region between upper and lower bands, colored by Money Line slope direction for instant trend visualization.
Signal Labels
Clear entry/exit labels showing:
Price level
Trigger type (UPTREND DIP, CAPITULATION, BAND TOUCH, EXTREME, etc.)
Color coding (Green=Buy, Red=Sell, Lime=Extreme Buy, Fuchsia=Extreme Sell)
ADX Trend Bar
Bottom indicator showing trend state:
🟢 Lime - Strong Uptrend
🔴 Red - Downtrend
🟠 Orange - Weak/Transitional (ADX 15-24)
⚪ White - Ranging (ADX < 15)
🔵 Blue - Strong trend, neutral direction
Info Panel
Real-time dashboard displaying:
Current trend state
GXS Score
Active divergences
Volatility level (BBWP)
ADX value and direction
DI Spread
Fisher Transform value
RSI value
Context-sensitive BUY/SELL thresholds for current regime
Alert System
JSON Webhook Alerts (Bot-Ready)
json{
"action": "BUY",
"symbol": "BTC/USDT",
"price": "93500.00",
"trigger": "EXTREME",
"rsi": "28.5",
"fisher": "-2.31",
"adx": "32.4",
"trend_state": "STRONG DOWN"
}
Available Alert Conditions
Buy Signal / Sell Signal
Lower Band Touch / Upper Band Touch
EXTREME Lower Band / EXTREME Upper Band
Strong Uptrend Started
Downtrend Started
Neutral Trend Started
Trend State Change
Recommended Settings
Scalping (1m-5m)
Signal Cooldown: 3-5 bars
Extreme Penetration: 0.2 (more sensitive)
ADX Length: 10-12
Swing Trading (15m-4H)
Signal Cooldown: 5-8 bars
Extreme Penetration: 0.3 (default)
ADX Length: 14 (default)
Position Trading (Daily+)
Signal Cooldown: 8-12 bars
Extreme Penetration: 0.4-0.5 (less sensitive)
ADX Length: 14-20
Input Parameters
Core Settings
Money Line Type (Linear Regression / Weighted EMA)
Money Line Length
RSI Period
Fisher Period
Dynamic Bands
ATR Period & Multiplier
Adaptive Bands toggle
Chaikin Weight
Extreme Band Penetration threshold
Trend Detection
ADX Length & Slope Lookback
Strong Trend ADX Threshold
DI Spread for Neutral detection
Signal Thresholds (by Trend State)
Fully customizable Fisher/RSI/ADX levels for each regime
Separate BUY and SELL parameters
Display Options
Toggle bands, cloud, labels, panels
Cooldown period
Debug panel for troubleshooting
Best Practices
Confirm with price action - Signals are high-probability setups, not guarantees
Respect the trend state - The panel shows current thresholds for a reason
Watch for EXTREME signals - These indicate significant reversals
Use divergences as confluence - Especially powerful at band touches
Monitor volatility - Low BBWP often precedes big moves
Version: 7.0
Author: ralis24

IDWM Master StructureExecutive Summary
The IDWM Master Structure is a Multi-Timeframe (MTF) trading tool designed to force discipline by aligning traders with the "Parent" trend. It functions by locking onto the "Completed Auction" of a higher timeframe candle (like a Daily or Weekly bar) and projecting that structure onto your lower timeframe chart. Its primary goal is to define the "Dealing Range"—the hard boundaries where value was previously established—so you don't get lost in the noise of smaller price movements.
1. The Principle of Completed Auctions (Hierarchy)
Most technical indicators curve dynamically with every price tick. This script acts differently because it relies on "Settled Arguments." A closed Daily candle represents a finished battle between buyers and sellers; the High and Low are the historical results of that battle.
To enforce this, the script automatically selects a "Parent" timeframe based on your view:
Scalping (charts below 15 minutes) uses the 4-Hour Auction.
Intraday trading (15 minutes to 4 Hours) uses the Daily Auction.
Swing trading (Daily chart) uses the Weekly Auction.
2. Liquidity Pools & The Sticky Range
The High and Low lines drawn by the indicator are not just support and resistance; they represent Liquidity Pools. In market theory, stop-losses (Sell Stops below Lows, Buy Stops above Highs) accumulate at these edges.
Smart money often pushes price just past these lines to grab this liquidity (a "Stop Hunt") before reversing direction. To account for this, the script uses a "Sticky Range" mechanism. It refuses to redraw the box simply because price touched the line. Instead, it uses an Average True Range (ATR) Buffer. A new structure is only formed if the candle closes decisively outside the range plus this volatility buffer. This ensures you are trading real breakouts, not liquidity sweeps.
3. Internal Range Mechanics (Premium vs. Discount)
Inside the Master Box, the script applies Equilibrium Theory to help with trade location.
The most important internal line is the Equilibrium (EQ), which marks the exact 50% point of the range.
Premium Zone (Above EQ): Price is mathematically "expensive" relative to the recent range. Algorithms generally look to establish Short positions here.
Discount Zone (Below EQ): Price is considered "cheap." Algorithms generally look to establish Long positions here.
It also plots the Master Open, which acts as a "Line in the Sand." If price is currently trading above the Master Open, the higher timeframe candle is Green (Bullish), suggesting longs have a higher probability. If below, the candle is Red (Bearish).
4. Wick Theory (Failed Auctions)
The script places special emphasis on the wicks of the Master Candle because a wick represents a "Failed Auction"—a price level the market tried to explore but ultimately rejected.
The indicator highlights the background of the wick area (from the High to the Body). On a retest, these zones often act as supply or demand blocks because the market remembers the previous failure.
It also calculates the "Consequent Encroachment," which is the 50% midpoint of the wick. The rule of thumb here is that if a candle body can close past 50% of a wick, the rejection is nullified, and price will likely travel to fill the entire wick.
5. Energy Expansion (Breakout Targets)
Market energy transfers from Consolidation (inside the box) to Expansion (the breakout). When the price finally breaks the "Sticky Range" (confirming via the ATR buffer), the script projects where that energy will go.
It uses the height of the previous range to calculate Fibonacci extensions. Specifically, it targets the 1.618 Extension, often called the "Golden Ratio." This is a statistically significant level where expansion moves tend to exhaust themselves and reverse.
6. Safety Protocol: Live Detection
A dashboard monitors the state of the parent candle. If the text turns Magenta with a warning symbol, it means the Higher Timeframe candle is "Live" (still forming).
Trading off a live structure is considered higher risk because the "Auction" isn't finished—the High or Low can still shift. The safest approach is to trade when the dashboard indicates a standard, locked, historical structure.

Quantrader📊 Overview
This custom indicator combines intraday session analysis with multi-timeframe trend confirmation to identify high-probability trading opportunities. It features:
Custom intraday session tracking (GMT+7 timezone)
Multi-level moving average confluence (SMA 20, 100, 200)
Bollinger Bands mean reversion signals
Key intraday reference levels
⚙️ Core Components
1. Custom Intraday Session Tracking
Session Start: 7:00 AM GMT+7 (Vietnamese market open)
Calculates per session:
Intraday High/Low (resets at 7:00 AM daily)
Intraday Midline = (Session High + Session Low) / 2
Pre-Day Center = Previous day's midline (carried forward)
Open Day = First 15-minute candle's open price
2. Trend Analysis Framework
SMA 20 (Short-term momentum)
SMA 100 (Medium-term trend)
SMA 200 (Long-term trend direction)
Bollinger Bands (20-period, 2 standard deviations)
3. Signal Detection Logic
Bullish Mean Reversion Setup:
javascript
Condition 1: Green candle closes ABOVE Upper Bollinger Band
Condition 2: Following candle is ALSO green
→ Triggers: Green highlight + Triangle below bar
Bearish Mean Reversion Setup:
javascript
Condition 1: Red candle closes BELOW Lower Bollinger Band
Condition 2: Following candle is ALSO red
→ Triggers: Red highlight + Triangle above bar
🎯 Visual Elements
Element Color Description
Intraday Midline Blue Real-time session midpoint
Pre-Day Center Yellow Yesterday's midline (reference)
Open Day Purple (dashed) Day's opening price
SMA 20 Red Short-term trend
SMA 100 Green Medium-term trend
SMA 200 Orange Long-term trend
Bollinger Bands Red/Green/Blue Volatility boundaries
Bull Signal Green triangle ↓ Oversold bounce potential
Bear Signal Red triangle ↑ Overbought rejection potential
📈 Trading Applications
1. Trend Confirmation
Bullish Alignment: Price > All SMAs + Above Intraday Midline
Bearish Alignment: Price < All SMAs + Below Intraday Midline
2. Mean Reversion Opportunities
Overbought Scenario: Consecutive green candles above Upper BB → Potential reversal
Oversold Scenario: Consecutive red candles below Lower BB → Potential bounce
3. Intraday Level Trading
Intraday Midline: Dynamic support/resistance
Pre-Day Center: Psychological reference level
Open Day: Key opening price level
⚡ Key Features
Automatic Session Reset: Daily at 7:00 AM GMT+7
Multi-Timeframe Confluence: Combines intraday, daily, and trend analysis
Clean Visual Design: Non-cluttered, focused on key levels
Real-Time Calculation: All levels update with each new candle
🛠️ Recommended Settings
Timeframe: 15-minute to 1-hour charts
Markets: Forex, Indices, Commodities
Best Pairs: EURUSD, XAUUSD, VN30, USDJPY
Trading Style: Swing trading, Day trading
📖 Usage Tips
Trend Trading: Enter in direction of SMA alignment (20 > 100 > 200 for bullish)
Mean Reversion: Use BB signals at key intraday levels (Midline, Pre-Day Center)
Confirmation: Wait for candle close above/below key levels
Risk Management: Place stops beyond opposite intraday extreme
🎨 Customization Options
Users can modify:
Session start time (line 6)
Bollinger Band parameters (length, multiplier)
SMA periods
Color schemes

ORB_RDORB_RD - Opening Range Box (Ryan DeBraal)
This indicator automatically draws a high/low box for the first portion of
each trading day, automatically stepping the range window from 15, 30, 45,
up to 60 minutes after the session starts. The box updates live as the range
forms, then optionally extends across the rest of the session.
FEATURES
-----------------------------------------------------------------------------
• Opening Range Detection
- Automatically ladders the range window: 0–15, 0–30, 0–45, 0–60 minutes
- Automatic reset at each new trading day
- Live high/low updates while inside the 0–60 minute window
• Auto-Drawing Range Box
- Draws a dynamic rectangle as the range forms
- Top and bottom update with every new high/low
- Extends sideways in real time during formation
- Optional full-day extension after the 60-minute range finalizes
• Customizable Visuals
- Adjustable fill transparency
- Mild green tint by default for clarity
PURPOSE
-----------------------------------------------------------------------------
This tool highlights the evolving opening range, a widely used intraday
reference for breakout traders, mean-reversion setups, and session structure
analysis. Ideal for:
• Identifying early support and resistance
• Framing breakout and pullback decisions
• Tracking intraday trend bias after the morning range

Multi-Tool VWAP + EMAs (Multi-Timeframe) + Key LevelsDescription
This indicator combines several commonly used technical analysis tools into a single script, especially useful for traders using the free version of TradingView or anyone looking to reduce the number of indicators on their chart.
The goal is to provide clear visual references for trend, structure, and key levels—without generating buy/sell signals or automated trading functions.
Included Features
1. VWAP (session-anchored)
Source: HLC3
Purple line, thickness 2
Useful as a reference for daily institutional average price.
2. EMAs of the current timeframe
EMA 200 (red, thickness 3)
EMA 9 (green, thickness 1)
These EMAs help visualize long-term trend and short-term momentum.
3. Dynamic EMAs (MTF – Multi-Timeframe)
The indicator displays the 200 EMA from higher timeframes as dynamic horizontal levels:
5 minutes
15 minutes
30 minutes
1 hour
4 hours
1 day
Each level includes a descriptive label such as “15 min EMA 200”.
These EMAs serve as reference points for potential support/resistance areas coming from higher timeframes.
4. Automatic Key Levels
The indicator plots several important price levels:
Previous day:
PDH (Previous Day High)
PDL (Previous Day Low)
Previous Day 50% Fibonacci level
Pre-market (04:00–09:30 exchange time):
PMH (Pre-Market High)
PML (Pre-Market Low)
Current session:
Open (session opening price)
Previous Close (prior day’s closing price)
Purpose and Scope
This script is designed to provide basic visual reference points to support discretionary analysis.
It does not generate signals or trading suggestions, and it is not intended to predict future price movements.
How to Use It
Enable or disable each block in the Inputs section according to your analysis style.
Observe how the levels, EMAs, and VWAP interact with market structure.
Use it as a visual complement to your personal technical analysis.
Limitations
This indicator is not a trading system and does not guarantee results.
It does not include alerts, backtesting, or entry/exit logic.
Some values (such as PMH/PML) depend on the symbol’s exchange trading hours.
Credits
Designed as an educational and analytical tool for traders seeking to simplify their charts without losing key information.

Dual TF Bearish Divergence (Working)//@version=6
indicator("Dual TF Bearish Divergence (Working)", overlay=true)
// ----------------- SIMPLE BEARISH DIVERGENCE FUNCTION -------------------
bearDiv(src, rsiLen, lookbackMin, lookbackMax) =>
r = ta.rsi(src, rsiLen)
ph = ta.pivothigh(src, lookbackMin, lookbackMin)
ph_rsi = ta.pivothigh(r, lookbackMin, lookbackMin)
ph2 = ph
ph2_rsi = ph_rsi
priceHH = not na(ph) and not na(ph2) and ph > ph2
rsiLH = not na(ph_rsi) and not na(ph2_rsi) and ph_rsi < ph2_rsi
barsOk = lookbackMin >= lookbackMin and lookbackMin <= lookbackMax
priceHH and rsiLH and barsOk
// ----------------- TF CALLS -------------------
b60 = request.security(syminfo.tickerid, "60", bearDiv(close, 14, 10, 15))
b240 = request.security(syminfo.tickerid, "240", bearDiv(close, 14, 10, 15))
dual = b60 and b240
// ----------------- PLOT -------------------
plotshape(dual, title="Dual Bear Div", style=shape.labeldown,
color=color.red, size=size.small, text="🔻BearDiv")
// ----------------- ALERT -------------------
alertcondition(dual, "Dual Bearish Div 60+240",
"Bearish Divergence on both 60m & 240m")

EMA Market Structure [BOSWaves]EMA Market Structure - Trend-Driven Structural Mapping with Adaptive Swing Detection
Overview
The EMA Market Structure indicator provides an advanced framework for visualizing market structure through dynamically filtered trend and swing analysis.
Unlike conventional EMA overlays, which merely indicate average price direction, this model integrates trend acceleration, swing highs/lows, and break-of-structure (BOS) logic into a unified, visually intuitive display.
Each element adapts in real time to price movement, offering traders a living map of support, resistance, and trend bias that reacts fluidly to market momentum.
The result is a comprehensive, trend-aware representation of price structure.
EMA slope and acceleration guide trend perception, while swing points identify key inflection zones.
Breaks of prior highs or lows are highlighted with visual BOS labels and stop-loss projections, giving traders actionable context for continuation or reversal setups.
Unlike static lines or simple moving averages, the EMA Market Structure indicator fuses dynamic trend analysis with structural awareness to provide a clear picture of market bias and potential turning points.
Theoretical Foundation
The EMA Market Structure builds on principles of momentum filtering and structural analysis.
Standard moving averages track average price but ignore acceleration and context; this indicator captures both the directional slope of the EMA and its rate of change, providing a proxy for trend strength.
Simultaneously, swing detection identifies statistically significant highs and lows, while BOS logic flags decisive breaks in structure, aligned with trend direction.
At its core are three interacting components:
EMA Trend & Acceleration : Smooths price data while highlighting acceleration changes, producing gradient-driven color cues for trend momentum.
Swing Detection Engine : Identifies swing highs and lows over configurable bar lengths, ensuring key turning points are captured with minimal clutter.
Break-of-Structure Logic : Detects price breaches of previous swings and aligns them with EMA trend for actionable BOS signals, including projected stop-loss levels for tactical decision-making.
By integrating these elements, the system scales effectively across timeframes and assets, maintaining structural clarity while visualizing trend dynamics in real time. Traders receive both macro and micro perspectives of market movement, with clear cues for trend continuation or reversal.
How It Works
The EMA Market Structure indicator operates through layered processing stages:
EMA Slope & Acceleration : Calculates the EMA and its rate of change, normalizing via ATR and a smoothing function to produce gradient color coding. This allows instant visual identification of bullish or bearish momentum.
Swing Identification : Swing highs and lows are computed using configurable left/right bar lengths, filtered through a cool-off mechanism to prevent redundant signals and maintain chart clarity.
Structural Lines & Zones : Swing points are connected with lines, and shaded zones are drawn between successive highs/lows to highlight key support and resistance regions.
Break-of-Structure Detection : BOS events occur when price breaches a prior swing in alignment with the EMA trend. Bullish and bearish BOS signals include enhanced label effects and projected stop-loss lines and zones, providing immediate tactical reference.
Dynamic Background Mapping : The chart background adapts to EMA trend direction, reinforcing trend context with subtle visual cues.
Through these processes, the indicator creates a living, adaptive map of market structure that reflects both trend strength and swing-based inflection points.
Interpretation
The EMA Market Structure reframes market reading from simple trend following to structured awareness of price behavior:
Uptrend Phases : EMA is rising with positive acceleration, swings confirm higher lows, and BOS events occur above prior highs, signaling trend continuation.
Downtrend Phases : EMA slope is negative, swings form lower highs, and BOS events occur below prior lows, confirming bearish bias.
Trend Reversals : Flat or decelerating EMA with BOS failures may indicate impending structural change.
Critical Zones : Swing-based lines and shaded zones highlight areas where price may pause, reverse, or accelerate, providing high-probability decision points.
Visually, EMA color gradients, structural lines, and BOS labels combine to provide both statistical trend confirmation and actionable structural cues.
Strategy Integration
EMA Market Structure integrates seamlessly into trend-following and swing-based trading systems:
Trend Alignment : Confirm higher-timeframe EMA slope before entering continuation trades.
BOS Entry Triggers : Use BOS events aligned with EMA trend for tactical entries and stop placement.
Support/Resistance Mapping : Swing lines and zones help define areas for scaling, exits, or reversals.
Volatility Context : ATR-based smoothing and stop-loss buffers accommodate varying market volatility, ensuring robustness across conditions.
Multi-Timeframe Coordination : Combine higher-timeframe EMA trend and swings with lower-timeframe structural events for precision entries.
Technical Implementation Details
Core Engine : EMA slope and ATR-normalized acceleration for gradient-driven trend visualization.
Swing Framework : Pivot-based high/low detection with configurable bar lengths and cool-off intervals.
Structural Visualization : Lines, zones, and labels for high-fidelity mapping of support/resistance and BOS events.
BOS Engine : Detects structural breaks aligned with EMA trend, automatically plotting stop-loss lines and visual cues.
Performance Profile : Lightweight, optimized for real-time responsiveness across multiple timeframes.
Optimal Application Parameters
Timeframe Guidance:
1 - 5 min : Ideal for intraday swing spotting and microstructure trend tracking.
15 - 60 min : Medium-range structural analysis and BOS-driven entries.
4H - Daily : Macro trend mapping and key swing-based support/resistance identification.
Suggested Configuration:
EMA Length : 50
Swing Length : 5
Swing Cooloff : 10 bars
BOS Cooloff : 15 bars
SL Buffer : 0.1%
These suggested parameters should be used as a baseline; their effectiveness depends on the asset volatility, liquidity, and preferred entry frequency, so fine-tuning is expected for optimal performance.
Performance Characteristics
High Effectiveness:
Trending markets with defined swings and structural consistency.
Markets where EMA slope and acceleration reliably indicate momentum changes.
Reduced Effectiveness:
Choppy or sideways markets with minimal swing definition.
Random walk assets lacking clear structural anchors.
Integration Guidelines
Confluence Framework : Combine with volume, momentum, or BOSWaves structural indicators
to validate entries.
Directional Control: Follow EMA slope and BOS alignment for high-conviction trades.
Risk Calibration: Use SL projections for disciplined exposure management.
Multi-Timeframe Synergy: Confirm higher-timeframe trend before executing lower-timeframe structural trades.
Disclaimer
The EMA Market Structure is a professional-grade trend and structure visualization tool. It is not predictive or guaranteed profitable; performance depends on parameter tuning, market regime, and disciplined execution. BOSWaves recommends using it as part of a comprehensive analytical stack integrating trend, liquidity, and structural context.

Global BB Resonance [by TESTEDED]📈 Global BB Resonance Hunter
1. Design Philosophy: Dimensional Reduction
In modern trading, "Information Overload" is the enemy. Traders often clutter their charts with 15+ Bollinger Band lines across 1H, 4H, Daily, and Weekly timeframes, resulting in a "spaghetti chart" that is impossible to read quickly.
The core logic of this indicator is "Dimensional Reduction." Instead of drawing every single line, this script runs a background algorithm to detect "Confluence" (Resonance).
The Thesis: A single Bollinger line (e.g., 1H Upper) is easily broken. However, when multiple dimensions overlap (e.g., 1H Upper + Daily Mid + Weekly Low) at the exact same price level, a "Market Consensus" is formed. These are the critical "Walls" of the market.
The Solution: We sort all data by Price, not Time. If lines cluster together within a specific threshold (e.g., 0.15%), the script draws a single Resonance Box instead of multiple confusing lines.
2. Key Features
🛡️ Multi-Timeframe Monitoring: Simultaneously monitors 1H, 4H, Daily, Weekly, and Monthly Bollinger Bands in the background, regardless of your chart's current timeframe.
⚡ Smart Resonance Detection: Automatically groups overlapping levels into "Resonance Boxes."
⚡ (2-Line Confluence): Watch closely.
⚡⚡ (3-Line Confluence): Strong Support/Resistance.
⚡⚡⚡ (4+ Lines): "Iron Wall" Resonance.
📊 Volatility State Perception: Detects if the bands are Squeezing (accumulating energy) or Expanding (trending).
Style Options: Choose between Icons (🧊/🔥) or Geek Symbols (>.< / <^>).
🧘 Focus Mode (Sniper View): A unique feature that hides all individual lines, leaving only the Resonance Boxes and the Dashboard. This keeps your chart clean and distraction-free.
🔔 Smart Alerts: Get notified immediately when Price touches a Resonance Box or when a Squeeze occurs.
3. Visual Guide
A. The Symbols (State Indicators)
You can switch styles in the settings.
B. The Resonance Boxes
Red Box: Resistance Zone (Above Price).
Green Box: Support Zone (Below Price).
Label: E.g., ⚡⚡ 1H Up + D Mid. This tells you exactly which levels are overlapping.
4. Usage Strategy
The "Reversal" Setup: Look for a Green Resonance Box below price with High Confluence (⚡⚡). Ensure the state is NOT Expanding (<^> or 🔥).
The "Breakout" Setup: Look for the Squeeze Symbol (>.< or 🧊) on the dashboard. If price approaches a Resonance Box while Squeezing, expect a breakout.
The "Sniper" Method: Turn on Focus Mode. Set Alerts. Only look at the chart when price hits a "Wall."
How to use: youtu.be
📈 布林带多维共振捕猎者
1. 设计哲学:降维打击
在现代交易中,“信息过载”是最大的敌人。交易者经常在图表上叠加 1H、4H、日线、周线等 15 条以上的布林带线条,导致图表像“盘丝洞”一样难以阅读。
本指标的核心逻辑是“降维打击”与“数据可视化”。 我们不再画出每一条线,而是在后台运行算法来捕捉**“共振”(Confluence)**。
核心理念:单一周期的布林线(如 1H 上轨)很容易被刺破。但是,当多个维度的力量(如 1H 上轨 + 日线中轨 + 周线下轨)在同一个价格水平重叠时,就形成了**“市场合力”**。这些位置才是市场真正的“铜墙铁壁”。
解决方案:系统按价格而非时间对数据进行排序。如果多条线在特定阈值(如 0.15%)内聚集,脚本会画出一个**“共振框”**,而不是无数条混乱的线。
2. 核心功能
🛡️ 全维幽灵监控:无论当前图表周期如何,脚本都会在后台实时监控 1H, 4H, 日线, 周线, 月线 的数据。
⚡ 智能共振雷达:自动检测并合并重叠的关键位。
⚡ (2线共振):值得关注。
⚡⚡ (3线共振):强力支撑/阻力。
⚡⚡⚡ (4线以上):核弹级/铁壁共振。
📊 波动率状态感知:自动识别布林带是处于 挤压蓄势 还是 扩张爆发 阶段。
风格切换:支持 图标模式 (🧊/🔥) 或 极客符号模式 (>.< / <^>)。
🧘 专注模式 (Focus Mode):一键隐藏所有单线,只保留共振框和仪表盘。让您的图表瞬间清空,像狙击手一样只关注目标。
🔔 智能警报:当价格触及共振框,或出现极度压缩信号时,立即发送警报。
3. 视觉指南
A. 状态符号说明
您可以在设置中切换显示风格。
B. 共振框说明
红色方框:上方阻力区 (Resistance)。
绿色方框:下方支撑区 (Support)。
标签示例:⚡⚡ 1H Up + D Mid —— 明确告知您是哪几条线发生了共振。
4. 实战策略
“反转”交易:寻找价格下方的绿色共振框,且具有高星级 (⚡⚡)。前提是当前状态不是扩张状态 (<^> 或 🔥)。
“突破”交易:在仪表盘上看到 挤压符号 (>.< 或 🧊)。如果价格在挤压状态下逼近共振框,不要逆势阻挡,大概率会发生强力突破。
“狙击”模式:开启 专注模式。设置好警报。不要盯着 K 线波动,直到价格撞上“墙壁”触发警报时再介入。
使用说明: youtu.be
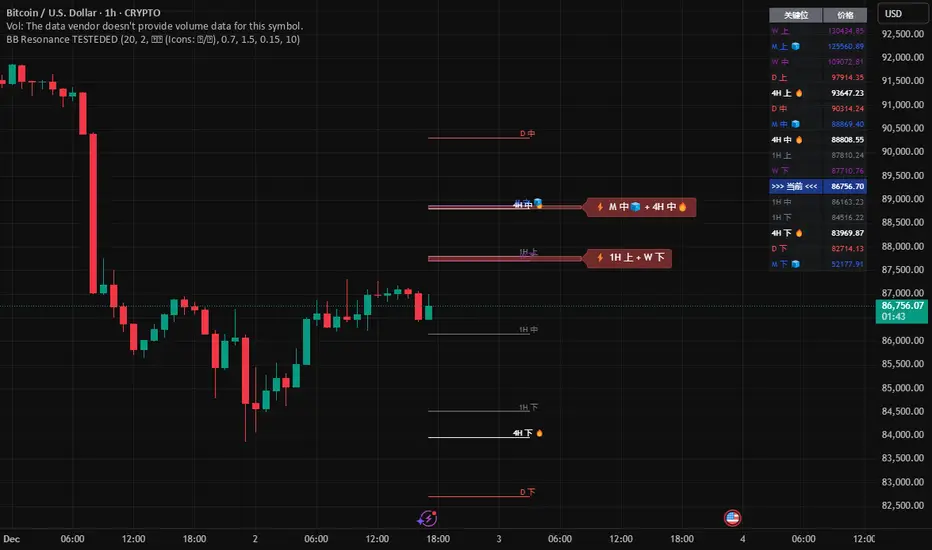
MTF RSI Stacked + AI + Gradient MTF RSI Stacked + AI + Gradient
Quick-start guide & best-practice rules
What the indicator does
Multi-Time-Frame RSI in one pane
• 10 time-frames (1 m → 1 M) are stacked 100 points apart (0, 100, 200 … 900).
• Each RSI is plotted with a smooth red-yellow-green gradient:
– Red = RSI below 30 (oversold)
– Yellow = RSI near 50
– Green = RSI above 70 (overbought)
• Grey 30-70 bands are drawn for every TF so you can see extremities at a glance.
Built-in AI (KNN) signal
• On every close of the chosen AI-time-frame the script:
– Takes the last 14-period RSI + normalised ATR as “features”
– Compares them to the last N bars (default 1 000)
– Votes of the k = 5 closest neighbours → BUY / SELL / NEUTRAL
• Confidence % is shown in the badge (top-right).
• A thick vertical line (green/red) is printed once when the signal flips.
How to read it
• Gradient colour tells you instantly which TFs are overbought/obove sold.
• When all or most gradients are green → broad momentum up; look for shorts only on lower-TF pullbacks.
• When most are red → broad momentum down; favour longs only on lower-TF bounces.
• Use the AI signal as a confluence filter, not a stand-alone entry:
– If AI = BUY and 3+ higher-TF RSIs just crossed > 50 → consider long.
– If AI = SELL and 3+ higher-TF RSIs just crossed < 50 → consider short.
• Divergences: price makes a higher high but 1 h/4 h RSI (gradient) makes a lower high → possible reversal.
Settings you can tweak
AI timeframe – leave empty = same as chart, or pick a higher TF (e.g. “15” or “60”) to slow the signal down.
Training bars – 500-2 000 is the sweet spot; bigger = slower but more stable.
K neighbours – 3-7; lower = more signals, higher = smoother.
RSI length – 14 is standard; 9 gives earlier turns, 21 gives fewer false swings.
Practical trading workflow
Open the symbol on your execution TF (e.g. 5 m).
Set AI timeframe to 3-5× execution TF (e.g. 15 m or 30 m) so the signal survives market noise.
Wait for AI signal to align with gradient extremes on at least one higher TF.
Enter on the first gradient reversal inside the 30-70 band on the execution TF.
Place stop beyond the swing that caused the gradient flip; target next opposing 70/30 level on the same TF or trail with structure.
Colour cheat-sheet
Bright green → RSI ≥ 70 (overbought)
Bright red → RSI ≤ 30 (oversold)
Muted colours → RSI near 50 (neutral, momentum pause)
That’s it—one pane, ten time-frames, colour-coded extremes and an AI confluence layer.
Keep the chart clean, use price action for precise entries, and let the gradient tell you when the wind is at your back.

Trend Trader//@version=6
indicator("Trend Trader", shorttitle="Trend Trader", overlay=true)
// User-defined input for moving averages
shortMA = input.int(10, minval=1, title="Short MA Period")
longMA = input.int(100, minval=1, title="Long MA Period")
// User-defined input for the instrument selection
instrument = input.string("US30", title="Select Instrument", options= )
// Set target values based on selected instrument
target_1 = instrument == "US30" ? 50 :
instrument == "NDX100" ? 25 :
instrument == "GER40" ? 25 :
instrument == "GOLD" ? 5 : 5 // default value
target_2 = instrument == "US30" ? 100 :
instrument == "NDX100" ? 50 :
instrument == "GER40" ? 50 :
instrument == "GOLD" ? 10 : 10 // default value
// User-defined input for the start and end times with default values
startTimeInput = input.int(12, title="Start Time for Session (UTC, in hours)", minval=0, maxval=23)
endTimeInput = input.int(17, title="End Time Session (UTC, in hours)", minval=0, maxval=23)
// Convert the input hours to minutes from midnight
startTime = startTimeInput * 60
endTime = endTimeInput * 60
// Function to convert the current exchange time to UTC time in minutes
toUTCTime(exchangeTime) =>
exchangeTimeInMinutes = exchangeTime / 60000
// Adjust for UTC time
utcTime = exchangeTimeInMinutes % 1440
utcTime
// Get the current time in UTC in minutes from midnight
utcTime = toUTCTime(time)
// Check if the current UTC time is within the allowed timeframe
isAllowedTime = (utcTime >= startTime and utcTime < endTime)
// Calculating moving averages
shortMAValue = ta.sma(close, shortMA)
longMAValue = ta.sma(close, longMA)
// Plotting the MAs
plot(shortMAValue, title="Short MA", color=color.blue)
plot(longMAValue, title="Long MA", color=color.red)
// MACD calculation for 15-minute chart
= request.security(syminfo.tickerid, "15", ta.macd(close, 12, 26, 9))
macdColor = macdLine > signalLine ? color.new(color.green, 70) : color.new(color.red, 70)
// Apply MACD color only during the allowed time range
bgcolor(isAllowedTime ? macdColor : na)
// Flags to track if a buy or sell signal has been triggered
var bool buyOnce = false
var bool sellOnce = false
// Tracking buy and sell entry prices
var float buyEntryPrice_1 = na
var float buyEntryPrice_2 = na
var float sellEntryPrice_1 = na
var float sellEntryPrice_2 = na
if not isAllowedTime
buyOnce :=false
sellOnce :=false
// Logic for Buy and Sell signals
buySignal = ta.crossover(shortMAValue, longMAValue) and isAllowedTime and macdLine > signalLine and not buyOnce
sellSignal = ta.crossunder(shortMAValue, longMAValue) and isAllowedTime and macdLine <= signalLine and not sellOnce
// Update last buy and sell signal values
if (buySignal)
buyEntryPrice_1 := close
buyEntryPrice_2 := close
buyOnce := true
if (sellSignal)
sellEntryPrice_1 := close
sellEntryPrice_2 := close
sellOnce := true
// Apply background color for entry candles
barcolor(buySignal or sellSignal ? color.yellow : na)
/// Creating buy and sell labels
if (buySignal)
label.new(bar_index, low, text="BUY", style=label.style_label_up, color=color.green, textcolor=color.white, yloc=yloc.belowbar)
if (sellSignal)
label.new(bar_index, high, text="SELL", style=label.style_label_down, color=color.red, textcolor=color.white, yloc=yloc.abovebar)
// Creating labels for 100-point movement
if (not na(buyEntryPrice_1) and close >= buyEntryPrice_1 + target_1)
label.new(bar_index, high, text=str.tostring(target_1), style=label.style_label_down, color=color.green, textcolor=color.white, yloc=yloc.abovebar)
buyEntryPrice_1 := na // Reset after label is created
if (not na(buyEntryPrice_2) and close >= buyEntryPrice_2 + target_2)
label.new(bar_index, high, text=str.tostring(target_2), style=label.style_label_down, color=color.green, textcolor=color.white, yloc=yloc.abovebar)
buyEntryPrice_2 := na // Reset after label is created
if (not na(sellEntryPrice_1) and close <= sellEntryPrice_1 - target_1)
label.new(bar_index, low, text=str.tostring(target_1), style=label.style_label_up, color=color.red, textcolor=color.white, yloc=yloc.belowbar)
sellEntryPrice_1 := na // Reset after label is created
if (not na(sellEntryPrice_2) and close <= sellEntryPrice_2 - target_2)
label.new(bar_index, low, text=str.tostring(target_2), style=label.style_label_up, color=color.red, textcolor=color.white, yloc=yloc.belowbar)
sellEntryPrice_2 := na // Reset after label is created

Ultimate_Price_Action_Tool_V2 by chaitu50cUltimate_Price_Action_Tool_V2 by chaitu50c — Session-Based SR Box Engine
This indicator builds clean, session-aware support and resistance “zones” from pure price action. It is designed for intraday and positional traders who want objective, rule-based zones instead of manual drawing.
Core Logic
Price-action based MAIN zones
Detects bullish and bearish breakouts using a strict body-structure:
Single-candle and double-candle breakout patterns.
Breakouts are confirmed only when closes break beyond previous highs/lows.
From each valid breakout, the tool builds a MAIN Support or MAIN Resistance box:
For bullish breaks, the zone is created from a combined low to the nearest open/close in the breakout combo.
For bearish breaks, the zone is created from a combined high to the nearest open/close in the breakout combo.
Optional first-box logic:
Can create the very first MAIN zone in a session from a simple opposite-color pair (without a full breakout), if enabled.
SUB zones on break
When price breaks a MAIN Support downwards with a red candle, the MAIN box is removed/frozen and:
A new SUB Resistance box is created above, using the current bar’s structure.
When price breaks a MAIN Resistance upwards with a green candle:
A new SUB Support box is created below.
SUB zones are optional and can be fully disabled if the user prefers a clean MAIN-only view.
Session Handling
The script is fully session-aware and can work in different market structures:
Session Mode options
Clock Session
Uses a fixed time window (e.g., 09:15–15:30).
Zones can be shown only inside the session or kept visible outside, depending on settings.
New Day
Each new trading day is treated as a fresh session.
Auto Gap
A new session starts whenever the time gap between candles exceeds a user-defined threshold (in minutes).
Session IDs and history
Each new session gets its own ID.
You can display zones for the last N sessions (including current).
Older sessions fade out visually but remain internally tracked to control visibility.
Main Features & Options
Initial Right Offset
Every new zone is projected to the right by a configurable number of bars.
All active boxes continuously extend with this offset, keeping zones clearly projected into the future.
Single MAIN per side (per session)
Optional constraint to have only:
One active MAIN Support and
One active MAIN Resistance
per session on the chart.
This prevents overcrowding and focuses on the most recent key structure.
MAIN vs SUB Overlap Control
When a new MAIN zone overlaps an existing SUB zone, you can choose:
Suppress MAIN (ignore the new MAIN if it clashes with a SUB),
Remove SUB (delete overlapping SUB zones and keep the new MAIN), or
Allow Both (plot everything and let the trader decide).
Vertical overlap is evaluated using a configurable minimum overlap percentage.
SUB suppression under MAIN
SUB boxes that overlap strongly with active MAIN zones can be auto-suppressed to avoid redundant clutter.
This suppression uses the same percent-based overlap logic.
Broken MAIN box handling
When a MAIN zone is broken:
Option 1: Fully delete it (classic behavior).
Option 2: Convert it into a 1-bar “marker” box at its origin, so you still see where the original zone formed without extending into the future.
Break candle coloring
The candle that breaks a MAIN zone can be optionally painted:
Red when breaking support.
Green when breaking resistance.
Helps visually confirm genuine breaks vs. simple intrabar tests.
Visual & Styling Controls
Separate style controls for:
MAIN Support / MAIN Resistance
Independent fill and border colors.
SUB Support / SUB Resistance
Independent fill and border colors.
Opacity and border colors are internally managed so that:
Recent sessions are clearly visible.
Older sessions are softly faded to maintain context without noise.
Typical Use Cases
Intraday traders looking for:
Clean, rule-based supply and demand zones.
Zones that respect actual session structure (clock, daily, or gap-based).
Swing traders who:
Want to track how current price reacts to the most recent 1–N sessions’ zones.
Price action traders who:
Prefer breakout-based zones rather than indicator-driven levels.
Need automatic zone management (creation, extension, break handling, and suppression).
This tool is built to be modular and configurable: you can run it minimal (only MAIN zones, single side per session) or fully featured (MAIN + SUB, multi-session history, overlap handling, and break paints). All logic is strictly price-action based with no dependency on volume or external indicators.
