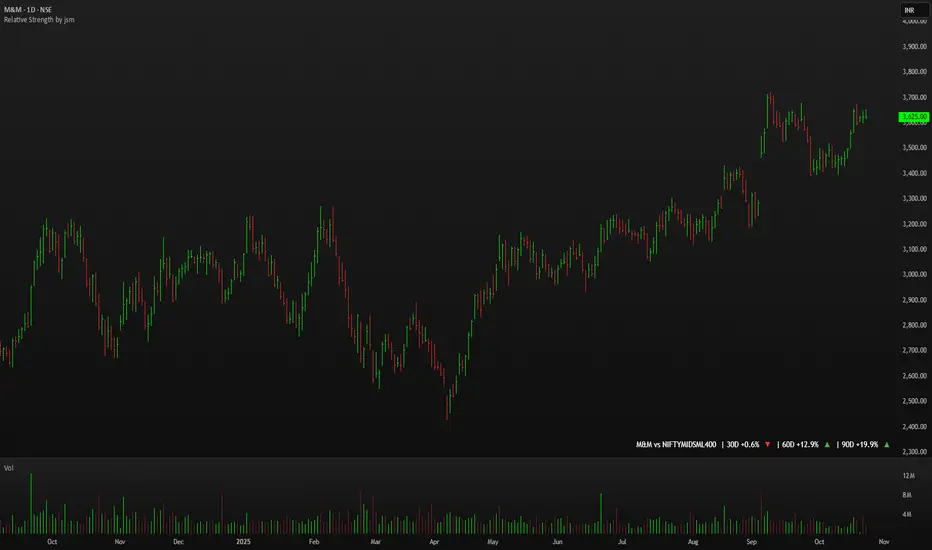
Relative Strength by jsm
1) Compare any stock against an Indian sector/index quickly and clearly.
2) Quickly gauge if your stock is outperforming or lagging its sector.
3) Instant relative strength tracker for Indian stocks & indices.
4) See 30D / 60D / 90D returns vs NIFTY, BANKNIFTY & more.
5) Smart visual tool to spot sector outperformance at a glance.
What it shows
A compact one-line readout (top-right by default):
TICKER vs INDEX | 30D +x.x% ▲ | 60D +y.y% ▼ | 90D +z.z% ▲
- +x.x% → stock return over the past 30 trading days (always uses daily bars).
- Arrow indicates relative performance vs the selected index: green ▲ = stock outperformed, red ▼ = stock underperformed, - = neutral (within tolerance).
- Percent values are shown with one decimal and a leading + for positives (e.g. +3.4%, -1.2%).
How it works
Apply the indicator to the stock chart (bottom chart in a dual-chart layout).
Choose the sector/index to compare from the “Compare with any Indian Index / Sector” dropdown. The indicator immediately calculates:
- Stock % change over 30 / 60 / 90 daily bars
- Index % change over the same periods
- Displays an arrow that reflects stock% − index% (colored only on the arrow to keep the numbers readable).
Inputs
- Pick Sector : preset list of Indian indices/sectors (no free-text by default).
- Box placement : Top/Bottom × Left/Right.
- Box Size : Tiny / Small / Normal / Large / Huge (controls font size).
- Dark Mode : toggles text color for dark/light charts.
- Show 30D / Show 60D / Show 90D : enable/disable individual periods.
- Equality tolerance (%) : small tolerance window to treat values as “equal” (shows neutral symbol).
Behavior & design choices
- Uses daily series for lookbacks (so 30D/60D/90D = 30/60/90 trading days) — works correctly on intraday charts too.
- Arrow only is colored (green/red/gray) for quick visual scanning; numbers remain neutral for readability.
- No intrusive background box by default — flat overlay that blends with your chart.
- Defaults: Bottom-right placement, Normal size, Light mode = off (so dark charts show white text).
Limitations / notes
- Not financial advice — use as a quick comparative visual, not a trade signal.
- The indicator calculates using the preset index symbols; if your broker/data feed lacks a symbol, the cell shows n/a.
- Due to TradingView table rendering, a tiny pixel gap may appear between a percent and its colored arrow (kept minimal on purpose).
Example
On SMSPHARMA chart with NSE:NIFTY selected:
SMSPHARMA vs NIFTY | 30D +13.0% ▲ | 60D +18.5% ▲ | 90D +13.5% ▲
— stock has outperformed NIFTY in all periods.
Sensex
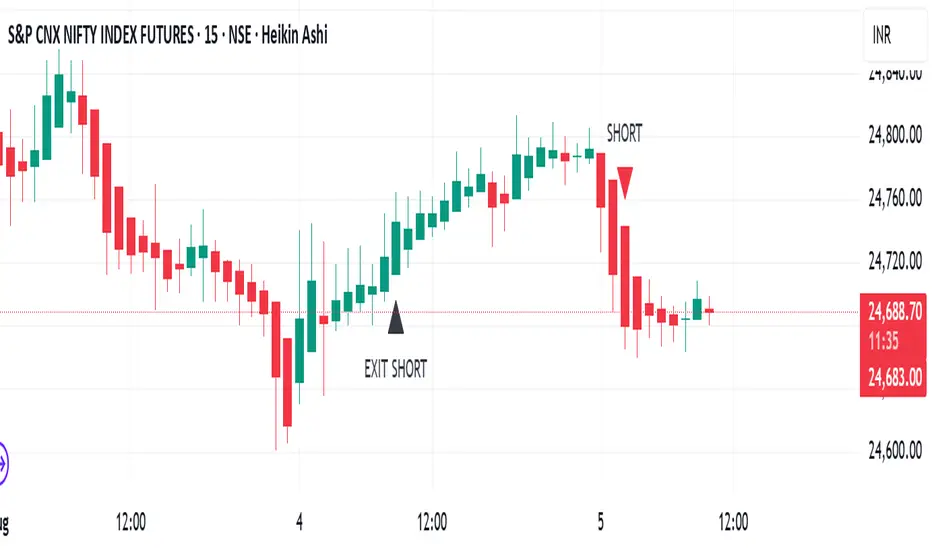
TrendRiderThis is an indicator to capture and ride trends in indices like Nifty50, Banknifty, Finnifty, Sensex, Gold,silver and crude oil. To be used mainly in futures and options.
Usage of this indicator:
1. 15 mins Timeframe to be set on chart
2. Candletype to made Heiken Ashi
3. Use on Futures charts of Nifty50, Banknifty, Finnifty, Sensex, Gold, Silver and Crude oil.
4. On trending days, can target minimum 100 points on Nifty50 and Finnifty, 200 pts on Banknifty, 250 pts on Sensex, 300 pts on Gold, 500 pts on Silver, 30 pts on Crude oil. All on futures. SL to be kept the same as target points, so R:R ratio is 1:1.
5. For options buy ATM CE/PE and can capture - 10% of premium on Nifty50 and Finnifty, 20% of premium on Banknifty, Sensex, Gold and Silver, 5% premium on Crude oil. SL to be kept same % as target.
6. Strictly exit as soon as you receive Exit signal whether in profit or loss.
7. Non repaint signals so you can enter as soon as you get buy/short signals and also exit as soon as you get exit signal.
8. You can target the fixed points as mentioned above, or just wait and ride till exit signal.
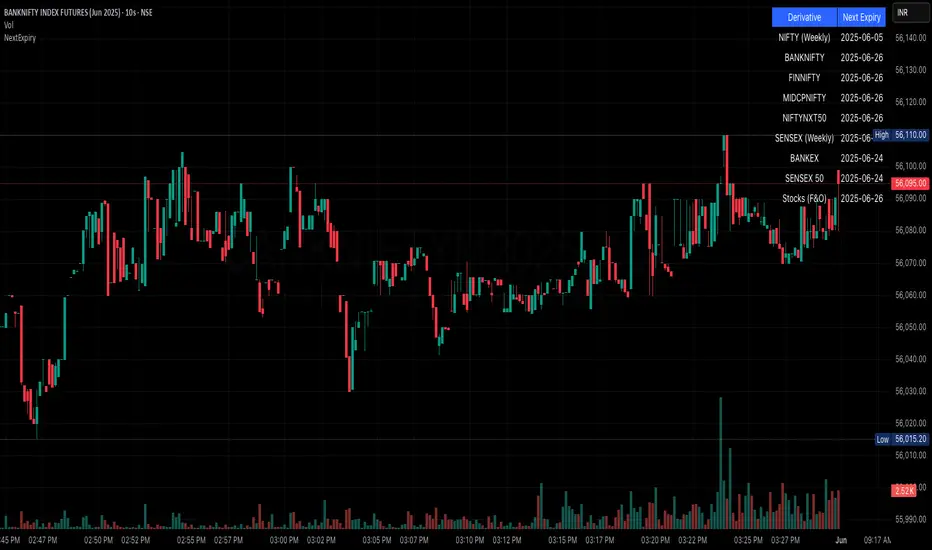
NSE/BSE Derivative - Next Expiry Date With HolidaysNSE & BSE Expiry Tracker with Holiday Adjustments
This Pine Script is a TradingView indicator that helps traders monitor upcoming expiry dates for major Indian derivative contracts. It dynamically adjusts these expiry dates based on weekends and holidays, and highlights any expiry that falls on the current day.
⸻
Key Features
1. Tracks Expiry Dates for Major Contracts
The script calculates and displays the next expiry dates for the following instruments:
• NIFTY (weekly expiry every Thursday)
• BANKNIFTY, FINNIFTY, MIDCPNIFTY, NIFTYNXT50 (monthly expiry on the last Thursday of the month)
• SENSEX (weekly expiry every Tuesday)
• BANKEX and SENSEX 50 (monthly expiry on the last Tuesday of the month)
• Stocks in the F&O segment (monthly expiry on the last Thursday)
2. Holiday Awareness
Users can input a list of holiday dates in the format YYYY-MM-DD,YYYY-MM-DD,.... If any calculated expiry falls on one of these holidays or a weekend, the script automatically adjusts the expiry to the previous working day (Monday to Friday).
3. Customization Options
The user can:
• Choose the position of the expiry table on the chart (e.g. top right, bottom left).
• Select the font size for the expiry table.
• Enable or disable the table entirely (if implemented as an input toggle).
4. Visual Expiry Highlighting
If today is an expiry day for any instrument, the script highlights that instrument in the display. This makes it easy to spot significant expiry days, which are often associated with increased volatility and trading volume.
⸻
How It Works
• The script calculates the next expiry for each index using built-in date/time functions.
• For weekly expiries, it finds the next occurrence of the designated weekday.
• For monthly expiries, it finds the last Thursday or Tuesday of the month.
• Each expiry date is passed through a check to adjust for holidays or weekends.
• If today matches the adjusted expiry date, that row is visually emphasized.
⸻
Use Case
This script is ideal for traders who want a quick glance at which instruments are expiring soon — especially those managing options, futures, or expiry-based strategies.
JARVISJARVIS is a technical indicator primarily designed for Nifty Bank. But, it also works on other instruments like stocks for example. You may apply it on other instruments if you find it useful.
Once the indicator is plotted, it will have bars with 3 colours
1) Blue - It's watching
2) Green - It's bullish
3) Red - It's bearish
So, it's that easy to interpret.
Following are few examples on NSE:BANKNIFTY
September 20, 2019 - Indicator turned green and remained so till end of the day. If you would have followed this, you would have made more than 2000 points.
September 25, 2019 - Indicator turned red and remained so till end of the day. If you would have followed this, you would have made more than 100 points.
September 26, 2019 and September 27, 2019 - Indicator remained blue and you see that the market was just consolidating.
Above are just a few examples of what this is capable of. Apart from Nifty Bank, it also works well on popular stocks like Reliance, TCS, SBIN etc
Recommended time frame for this is 15 mins, but, you may experiment with other time frames as well. It's all about finding the right time frame for that particular instrument, for example it works best on 2H when applied on Nifty.
Should you have any doubts, feel free to DM me.

MULTITIMEFRAME_VWAP_MANOJVWAP is a powerful concept.
It denotes the fair price that is traded in the market.
In other words, it represents a variance of POINT OF CONTROL (POC) which is a Market Profile / Volume Profile Concept.
It is a leading indicator as it is dependent on the price and volume .
Usually VWAP is used for intraday trades and Trading view as an in built indicator which works only for intraday.
This script plots daily vwap , monthly vwap , quarterly vwap and yearly vwap .
The suggested combination is :
intraday charts - daily vwap
daily charts - monthly and / or quarterly vwap
weekly charts - quarterly and / or yearly vwap

INSIDE BAR This indicator identifies Inside Bar.
Inside Bar is an indecisive setup where traders are not sure of the direction which is reflected in the bar range which is usually narrower.
The day following Inside Bar usually would be a decisive bar with wide range.
This decisive bar can be exploited if traded with discipline.
The steps to follow are :
At EOD :
1) Use daily charts for locating Inside Bar with this indicator on.
2) Ensure you keep the parameter prev range Vs inside bar as 0.25 irrespective of default value. This means that the previous bar range is greater than the inside bar range by 25%.
3) Try going through all FNO scrips to locate inside bar (as there is no scanner in Trading View).
4) Once an Inside Bar scrip is located, earmark them or send them to watchlist.
5) Now you will have a watchlist with around 5-6 scrips.
Next trading day at market opening:
5) When the market opens, wait till 9.45 am (first half an hour).
6) Mark the first half an hour high and low. These are opening range high and opening range low.
7) If price breaks out decisively on the upside above opening range high, buy with a stop of opening range low. Target can be based on super trend or ema or any other method. If price breaks out decisively on the downside below opening range low, short with a stop of opening range high.
8) Ensure you follow disciplined position sizing.
Good luck.
