Flux Charts - SFX Screener💎 GENERAL OVERVIEW
The SFX Screener by Flux Charts is a multi-timeframe market scanner that extracts and visually organizes key conditions detected by the SFX Algo indicator across multiple assets in real-time. It does not perform independent analysis or generate new signals—instead, it pulls data directly from the SFX Algo’s calculations to ensure full alignment across different timeframes and tickers.
The SFX Algo is a multi-factor trading indicator that integrates trend analysis, signal generation, market overlays, and take-profit/stop-loss levels into a single system. It evaluates multiple trend components, including EMA direction, momentum shifts, and volatility cycles, to determine market conditions. Signal generation is based on an Adjusted Weighted Majority Algorithm, filtering out weaker signals by prioritizing the most reliable market indicators. Market overlays, such as Volatility Bands and the Retracement Wave, provide dynamic support, resistance, exit points, and entry points. Its adaptable structure allows traders to customize settings based on strategy preferences, making it effective for scalping, swing trading, and long-term trend analysis.
The SFX Screener’s purpose is to give traders a dashboard view of these SFX Algo signals across multiple tickers and timeframes in real-time.
📌 HOW DOES IT WORK ?
The SFX Algo indicator employs an Adjusted Weighted Majority algorithm to generate "buy" and "sell" signals. It evaluates multiple market indicators ("experts"), including momentum, ATR trends, and EMA trends, and assigns weights based on their recent performance. The "Time Weighting" setting allows users to balance between using more historical data or prioritizing recent trends. Unlike traditional weighted majority methods, SFX also dynamically penalizes larger losses. Signals are confirmed based on the consensus of the most successful indicators within the selected time period, filtering out weaker signals during underperforming phases.
The SFX Screener extracts these calculated outputs and visually organizes them into a real-time dashboard. Each signal, status, and volatility condition displayed in the screener is a direct output from the SFX Algo indicator.
🚩 UNIQUENESS
Unlike traditional screeners that rely on preset filters or static conditions, the SFX Screener dynamically updates its dashboard based on live outputs from the SFX Algo’s adaptive algorithm.
Traditional Screeners → Use predefined filters like “price above EMA” or “RSI overbought.” They do not adjust to market dynamics.
SFX Screener → Displays outputs directly from an adaptive algorithm that continuously evaluates trends, volatility, and momentum changes.
The SFX Screener can show SFX Algo's status on 8 different tickers on different timeframes. Key factors that make it unique include:
✅ Real-time sync with SFX Algo → Displays live conditions, not static filters.
✅ Comprehensive Dashboard – This screener provides a complete and customizable dashboard designed to enhance traders' decision-making by consolidating crucial SFX Algo insights into one user-friendly interface.
✅ Multi-Ticker & Multi-Timeframe Analysis – With support for up to 8 tickers and timeframes, traders can effortlessly analyze the bigger market picture, identifying trends and opportunities across different assets and timeframes.
By combining multiple analytical elements in a single view, this screener empowers traders with the insights needed to navigate the market more effectively.
🎯 SFX SCREENER FEATURES:
SFX Algo Signals : This tool can detect SFX Algo signals across different tickers & timeframes.
Volatility Bands : Detection of Volatility Bands Status & Retests.
Retracement Wave : Detection of Retracement Wave Status & Retests.
Highly Configurable : Offers multiple parameters for fine-tuning detection settings.
Up to 8 Tickers : Allows traders to analyze multiple tickers & timeframes simultaneously for enhanced accuracy.
📊 SFX SCREENER DATA BREAKDOWN
Signal ->
Buy -> The latest signal is a buy signal.
Sell -> The latest signal is a sell signal.
The rating of the signal is shown after the signal type.
Δ⭐ ->
Shows the rating change (delta) after the signal is triggered. Positive values mean that the rating is increased after the signal is given, negative values mean that it's decreased.
Status ->
Displays the amount of time passed after the signal is given.
TP Targets ->
Shows the Take-Profit targets of the signal, if a target was achieved, there is a ✅ symbol near it and the next target it displayed.
V. Bands ->
The Volatility Bands dynamically adjust to market conditions, expanding during high volatility and contracting during low volatility. When the volatility bands are tight, or the upper and lower bands are close to each other, the market is not volatile. During periods of low volatility, it’s common for price to consolidate or move sideways. An early indication of a large price move can occur when the bands widen or open up after being tight. When the volatility bands are wide, it reflects a period of increased volatility, typically during strong price trends or after a breakout. The volatility bands can also act as support and resistance areas. The upper band acts as resistance while the lower band acts as support. These mark out good areas for potential reversals. Breakouts can also occur when price moves beyond the bands, signaling a potential trend in the breakout direction.
Outside -> The price is currently outside of the Volatility Bands.
Inside | Upper -> The price is currently inside the Upper Volatility Band.
Inside | Lower -> The price is currently inside the Lower Volatility Band.
R. Wave ->
The Retracement Wave is used to identify entry points during pullbacks in trending markets. It can also be used to find exit points for open trades. The wave is bullish when price is above it and bearish when the price is below it. The retracement wave can be used as an area to enter during a pullback in a trending market. The wave can also be helpful for managing risk and closing out positions.
Outside | Bullish -> The Retracement Wave is currently Bullish, and the price is outside of it.
Outside | Bearish -> The Retracement Wave is currently Bearish, and the price is outside of it.
Inside | Bullish -> The Retracement Wave is currently Bullish, and the price is inside of it.
Inside | Bearish -> The Retracement Wave is currently Bearish, and the price is inside of it.
Profit & Loss (P&L) ->
Shows the amount of profit or loss the position is currently in. All values are shown in terms of percentage, and positive values mean the position is in profit while negative values mean that the position is in loss.
⚠ Timeframe Restriction : The selected timeframes for analysis cannot be lower than the chart’s current timeframe to ensure proper data alignment.
⏰ ALERTS
This screener supports alerts, so you never miss a key market move. You can choose to receive alerts when a buy or sell signal is given, helping you spot potential trading opportunities. Additionally, you can enable alerts for take-profit or stop-loss levels, which notify you when the price achieves those levels. The alerts will work for each enabled ticker in the settings. You can also toggle webhook format for alerts, and choose to include ticker metadata in it.
⚙️ SETTINGS
1. Algorithm Settings
Sensitivity: The sensitivity setting is a key parameter that influences the frequency of signals the SFX Algo generates. By adjusting this parameter, you can control the frequency of signals produced by the algorithm. Using a lower sensitivity setting generates more frequent signals that are highly responsive to minor price fluctuations. Using a higher sensitivity setting reduces the frequency of signals, focusing on more significant price movements and filtering out minor fluctuations.
Signal Strength: The Signal Strength setting filters signals based on their quality, allowing traders to focus on the most reliable opportunities. This feature helps traders balance the quantity and reliability of the algorithm’s signals to suit their trading strategy. Using a lower signal strength will display more signals, including those with lower signal ratings, for broader market coverage. Using a higher signal strength will display fewer signals by prioritizing those with higher signal ratings, reducing market noise.
Time Weighting: The Time Weighting setting in the SFX Algo determines how historical market data is analyzed to generate signals.
a) Recent Trends
Focuses on the most recent movements for short-term analysis. This setting is good for scalpers and intraday traders who need to react quickly to market changes.
b) Mixed Trends
Balances recent and historical price movements for a comprehensive market view. This setting is well-suited for swing traders and those who want to capture medium-term opportunities by combining the benefits of short-term responsiveness with the reliability of long-term trends.
c) Long-term Trends
Relies on extended historical market data to identify broader market trends, making it an excellent choice for traders focused on long-term strategies.
Minimum Star Rating : The Minimum Star Rating setting allows you to filter signals based on their strength, showing only those that meet or exceed your chosen threshold. For instance, setting the minimum star rating to 3 ensures you only receive signals with a rating of 3 stars or higher.
2. Take Profit / Stop Loss Methods
Key Levels
The Key Levels method uses pivot points to set take profit and stop-loss levels. The TP and SL levels are shown when a new signal is generated.
Volatility Bands
This TP/SL method uses the Volatility Bands overlay to set dynamic TP and SL levels. These levels are not predetermined so they will not be shown in advance when a signal is generated.
Signal Rating
Sets take profit and stop-loss levels based on changes in a signal's rating strength. These levels are not predetermined so they will not be shown in advance when a signal is generated.
Auto Stop-Loss
The auto method can only be applied to the SL. The auto method allows the algorithm to detect SL automatically when a momentum shift is detected. You can adjust the risk tolerance of the Auto SL by adjusting the ‘Auto Risk Tolerance’ setting. You can choose between Low, Medium, and High. A high-risk tolerance will result in stop losses being triggered less often.
3. Tickers
You can set, then enable or disable up to 8 tickers in this section to get informed about their latest SFX Algo signal.
‼️ Important Notes
TradingView has limitations when running advanced screeners, resulting in the following restrictions:
Computation Errors:
The computation of using MTF features and viewing several tickers is very intensive on TradingView. This can sometimes cause calculation timeouts. When this occurs simply force the recalculation by modifying one indicator’s settings or by removing the indicator and adding it to your chart again.
Inconsistencies:
You may notice inconsistencies when viewing the screener on a chart with a specific symbol because screener tickers originate from different markets. Since the cryptocurrency market operates 24/7, while stock markets have defined opening and closing hours, the screener may return varying information depending on whether you're currently viewing a cryptocurrency, stock, or currency pair.
SFX

Flux Charts SFX Algo (Premium)Flux Charts SFX Algo indicator is a comprehensive and sophisticated all-in-one toolkit designed to cater to all the technical analysis needs of traders. Developed and designed by Russell W., head developer at Flux Charts.
The Flux Charts SFX Algo indicator stands apart with its unique ability to seamlessly integrate with various forms of technical analysis, while also offering the option to function as a standalone toolkit adaptable to any trading style. The indicator has been designed to take into account the dynamic nature of market conditions, ensuring that every feature included remains relevant, reliable, and effective.
Traders have countless possibilities when utilizing this indicator, allowing for the exploration and analysis of an array of cutting-edge features over time. This enables traders to selectively employ the features that align best with their individual trading styles and build a personal trading strategy.
The Flux Charts SFX Algo indicator is set to revolutionize the way traders approach technical analysis, providing them with the tools and insights needed to navigate complex financial markets with confidence and precision.
Flux Charts SFX Algo works in all markets (stocks, crypto, forex, futures, bonds, options, etc) and has many features including:
Buy signals (Not to be followed blindly)
Sell signals (Not to be followed blindly)
Buy & Sell Signal Ratings (Higher rating doesn't necessarily mean a "better" signal)
Algorithm Weighting Customization
Algorithm Sensitivity Customization
Algorithm Signal Strength Filter
Take Profit signals
Take Profit Retest signals
Take Profit Level Optimization
Trend Candle Coloring
Volatility Bands
+ more
What it does
The indicator uses an Adjusted Weighted majority algorithm to generate "buy" and "sell" signals. The algorithm takes into account several market metrics and weights them based on their recent performance. How far back the algorithm checks is based on the “Time Weighting” setting. This allows users to choose between having more data points or having more recency bias within the algorithm, but less data to decipher.
How it works and what differentiates it
There are many popular strategies in the market all of which go in and out of successful periods. The SFX algorithm effectively uses popular indicators or "experts" and weights them using a period decided through the "Time Weighting" Setting. The "experts" include popular indicators that cover Momenutmn, ATR trends, and EMA trends. Adjusted Weighted Majority typically weighs only through binary events however the SFX also uses a dynamic system to punish larger losses. The total weighting is then used to confirm a signal is agreeing with the most successful "experts" or indicators within the time period. This effectively will filter poor signals during periods of underperformance compared to other indicators and the converse during performant periods.
This weighting algorithm was inspired by the Princeton University lecture "Multiplicative Weight Algorithm" by Sanjeev Arora!
Usage
CME_MINI:ES1! 3 minute timeframe, July 7 2023.
Indicator Settings: (Sensitivity: 70, Signal Strength: 40, Time Weighting: Recent Trends)
The star-rated signals show the strength of the signals based on our weighting system
The colored candles (green & red) simplify the market into basic uptrends/downtrends
The volatility bands show areas of potential reversals
The volatility bands also show potential breakouts (Tight bands = consolidation, which could lead to an impulsive move)
The take profit signals suggest areas where profits should be taken in a trade
Settings and their Usage
Algorithm Settings Explained
Sensitivity determines how frequently signals appear. A higher sensitivity would lead to more frequent signals (Buy & Sell) appearing on your chart
Signal Strength helps filter out low-rated signals based on our Stochastic Weighting Algorithm. A higher signal strength will lead to fewer signals on your chart. A higher-rated signal doesn't necessarily make it a better signal than a lower-rated signal.
Time Weighting allows you to choose how much historic data you want the indicator to use when interpreting data for the signals. There are three options to choose from including:
- Recent Trends
- Mixed Trends
- Longterm Trends
Using the "Recent Trends" option will only use recent market data when looking at the market metrics our algorithm uses for generating "Buy" and "Sell" signals. Thus, there will be a recency bias which means the metrics the algorithm is weighing more heavily have recently performed well.
Using the "Longterm Trends" option will use more historic market data when looking at the market metrics our algorithm uses. This will give more data points for the algorithm to use, but it won't count for recent performances, but rather an overall performance in the past. Thus, if one metric has been doing poorly recently, it will still receive the same weight, even though it was performing well at the start of our lookback period for data.
Using the "Mixed Trends" option will give you a choice that is in between these two options. This will give you a good balance between having enough data points for market metrics, while also sustaining a good bit of market recency bias.

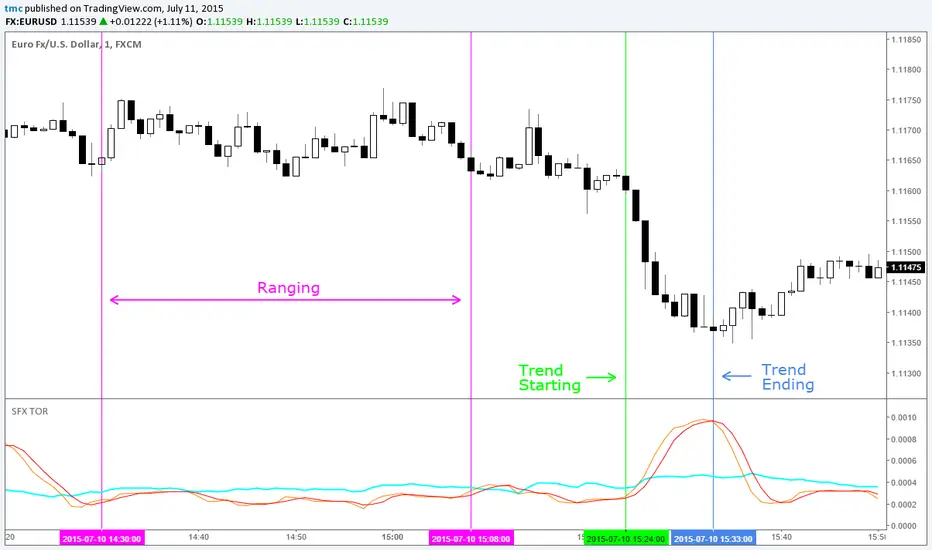
SFX Trend or RangeA remarkably simple but very useful indicator. Earlier and clearer signals than ADX or VHF. More positive ranging signal than any other indicators.
Aqua = ATR
Orange = StdDev
Red = Smoothed Moving Average of the StdDev
Usage:
Any pair, any time frame. Best used on majors and M15 period or higher
Orange breaks above Red when below Aqua = Trend building
Orange breaks below Red when above Aqua = Trend exhausting
Orange below Red when below Aqua = Ranging/Sideways market