Short-Term Weekly Refuges (Shelters)## // Introduction // (Spanish Texts Below)
═══════════════════════════
Short-Term Weekly Refuges (Shelters) (WR or RS) is a structural analysis indicator designed to track price action during the current week. It combines a configurable ZigZag with Fibonacci retracements anchored to recent phases, using the Weekly Opening Price (W.O.P.) as a key reference level.
This indicator is optimized for 4H timeframe but also works on 1H and 15min charts.
## // Theoretical Foundation of the Indicator //
═════════════════════════════════════════════════
The WR (RS) indicator provides a structural framework for following price action during the current trading week.
The core concept: Recent ZigZag phases, combined with the Weekly Opening Price, create dynamic support and resistance levels that institutional traders often monitor and use for intraweek positioning. The indicator allows you to select which recent phase (1-10) serves as the Fibonacci anchor.
## // Indicator Objectives //
═════════════════════════════
1) Display a configurable ZigZag showing recent price structure with numbered phases (1 = most recent). Users should configure the ZigZag parameters based on whether they are analyzing a Major Degree Pattern (larger swings, less noise) or a Minor Degree Pattern (smaller swings, more detail), following standard Elliott Wave terminology. Configure the ZigZag to match the degree of your analysis: use higher Depth values for Major Degree Patterns, or lower values for Minor Degree Patterns.
2) Draw Fibonacci retracements on a user-selected phase, with two modes:
• "On ZigZag": Traditional Fibonacci on the selected phase.
• "Relative to W.O.P.": Fibonacci from phase anchor (i0) to Weekly Opening Price.
3) Show Weekly Opening Price lines as horizontal references, with the current week's line extended into the future.
4) Provide Pivot Up/Down markers for additional confirmation of local highs and lows.
5) Support multiple simultaneous indicator loads with visual identifier labels to distinguish between different analysis degrees (e.g., "Major Degree Pattern" vs "Minor Degree Pattern").
6) Optional Embedded Indicator: Enable Intraday Shelters (RID) - percentage-based support/resistance levels calculated from the Daily Opening Price, useful for 1H and 15min trading.
## // Key Features //
═════════════════════
• **Flexible ZigZag**: Adjustable Depth, Deviation, and Backstep parameters to adapt to any asset's volatility and degree pattern.
• **Phase Selection**: Choose from the 10 most recent phases for Fibonacci anchoring.
• **Dual Fibonacci Modes**: Trace on the ZigZag phase itself, or relative to the Weekly Opening Price.
• **New Age Color Palette**: Professional Fibonacci color scheme used by old school experienced traders.
• **Weekly Opening Price (W.O.P.)**: Historical weekly opens plus current week projection.
• **"Show Only W.O.P." Mode**: Isolate just the Weekly Opening Price line for cleaner charts on non-4H timeframes.
• **Optional Intraday Shelters (RID)**: 11 percentage levels (±0.382%, ±1%, ±1.5%, ±2%, ±2.5%) based on Daily Opening Price.
• **Multi-Load Support**: Visual identifier tags and Large Label for running multiple indicator instances simultaneously.
## // Recommended Workflow //
═════════════════════════════
1) Load the indicator on a 4H chart.
2) Adjust ZigZag parameters (Depth, Deviation) until the phases match your visual analysis of recent price structure.
3) Select the phase you want to use as Fibonacci anchor (typically Phase 2, 3 or higher).
4) Choose Fibonacci mode: "On ZigZag" for phase analysis, or "Relative to W.O.P." for analysis based on weekly opening price context.
5) Monitor how price interacts with the Fibonacci levels and Weekly Opening Price throughout the week.
6) Optionally enable RID for intraday high precision order placements on 1H or 15min charts.
## // Integration with Other Refuge Indicators //
═════════════════════════════════════════════════
This indicator WR (RS) is part of our complete refuge-based analysis ecosystem:
• LTR (RLP) (Long-Term Refuges): For automatic determination of the predominant phase of a ZigZag, which institutional investors choose as the basis for a Fibo whose levels calculate the projection for order placement over the following months and years.
• LTRS (RLPS) (Simple Long-Term Refuges): Simplified version of LTR in which the known coordinates of the predominant phases (obtained with the LTR indicator) of up to five assets are easily captured for permanent long-term operation.
• WR (RS) (Short-Term Weekly Refuges): For short-term tactical analysis (4H, 1H) based on chosen phases of a ZigZag that define Fibo levels effective during the near past week(s).
• IDR (RID) (Intra-Day Refuges): For daily operations relying on intraday levels on timeframes of 1H or less. Ideal for scalping traders.
By combining LTR, LTRS, WR and IDR, you obtain a multi-level framework that allows you to operate with clarity at any time horizon, from intraday positions to investments spanning months and years.
## // Additional Notes //
═════════════════════════
1) Default parameters are optimized for volatile assets (crypto, tech stocks). For forex or less volatile instruments, consider reducing Deviation to 3-8%.
2) The "Phase in Development" (dashed line) shows the tentative current ZigZag segment that may still change as new bars form.
3) Due to TradingView's English-only publication rules, the complete Spanish version of this indicator with all tooltips and documentation will be available soon in our GitHub repository: aj-poolom-maasewal.
4) Bug reports, improvement proposals for the ZigZag generator, pattern determination, or Fibo composition, etc., will be greatly appreciated and taken into account for a future version. Best regards and happy hunting.
════════════════════════════════════════════════════
════════════════════════════════════════════════════
TEXTO EN ESPANIOL (Sin acentos ni enies para compatibilidad con TradingView)
════════════════════════════════════════════════════
## // Introduccion //
═════════════════════
Refugios Semanales (RS o WR) es un indicador de analisis estructural diseniado para seguir la accion del precio durante la semana en curso. Combina un ZigZag configurable con retrocesos de Fibonacci anclados a fases recientes, utilizando el Precio de Apertura Semanal (P.A.S.) como nivel de referencia clave.
Este indicador esta optimizado para temporalidad de 4H pero tambien funciona en graficos de 1H y 15min.
## // Fundamento Teorico del Indicador //
═════════════════════════════════════════
El indicador RS (WR) proporciona un marco estructural para seguir la accion del precio durante la semana de operacion actual.
El concepto central: Las fases recientes del ZigZag, combinadas con el Precio de Apertura Semanal, crean niveles dinamicos de soporte y resistencia que los operadores institucionales frecuentemente monitorean para su posicionamiento intrasemanal. El indicador permite seleccionar cual fase reciente (1-10) sirve como ancla del Fibonacci.
## // Objetivos del Indicador //
════════════════════════════════
1) Mostrar un ZigZag configurable con la estructura de precios reciente y fases numeradas (1 = mas reciente). Los usuarios deben configurar los parametros del ZigZag segun esten analizando una Pauta de Grado Mayor (oscilaciones mas amplias, menos ruido) o una Pauta de Grado Menor (oscilaciones mas pequenias, mas detalle), siguiendo la terminologia estandar de Ondas de Elliott. Configure el ZigZag para que coincida con el grado de su analisis: use valores de Profundidad mas altos para Pautas de Grado Mayor, o valores mas bajos para Pautas de Grado Menor.
2) Dibujar retrocesos de Fibonacci en una fase seleccionada por el usuario, con dos modos:
• "En el ZigZag": Fibonacci tradicional sobre la fase seleccionada.
• "Respecto al P.A.S.": Fibonacci desde el ancla de la fase (i0) hasta el Precio de Apertura Semanal.
3) Mostrar lineas del Precio de Apertura Semanal como referencias horizontales, con la linea de la semana actual extendida hacia el futuro.
4) Proporcionar marcadores de Pivote Arriba/Abajo para confirmacion adicional de maximos y minimos locales.
5) Soportar multiples cargas simultaneas del indicador con etiquetas identificadoras visuales para distinguir entre diferentes grados de analisis (ej: "Pauta de Grado Mayor" vs "Pauta de Grado Menor").
6) Indicador Integrado Opcional: Habilitar Refugios Intra-Diarios (RID) - niveles de soporte/resistencia basados en porcentajes calculados desde el Precio de Apertura Diaria, util para operacion en 1H y 15min.
## // Caracteristicas Principales //
════════════════════════════════════
• **ZigZag Flexible**: Parametros ajustables de Profundidad, Desviacion y Retroceso para adaptarse a la volatilidad y grado de pauta de cualquier activo.
• **Seleccion de Fase**: Elija entre las 10 fases mas recientes para el anclaje del Fibonacci.
• **Modos Duales de Fibonacci**: Trace sobre la fase del ZigZag, o relativo al Precio de Apertura Semanal.
• **Paleta de Colores New Age**: Esquema de colores profesional de Fibonacci usado por operadores institucionales de la vieja escuela.
• **Precio de Apertura Semanal (P.A.S.)**: Aperturas semanales historicas mas proyeccion de la semana actual.
• **Modo "Solo P.A.S."**: Aisla unicamente la linea del Precio de Apertura Semanal para graficos mas limpios en temporalidades distintas a 4H.
• **Refugios Intra-Diarios Opcionales (RID)**: 11 niveles porcentuales (±0.382%, ±1%, ±1.5%, ±2%, ±2.5%) basados en el Precio de Apertura Diaria.
• **Soporte Multi-Carga**: Etiquetas identificadoras visuales y Rotulo Grande para ejecutar multiples instancias del indicador simultaneamente.
## // Flujo de Trabajo Recomendado //
═════════════════════════════════════
1) Cargue el indicador en un grafico de 4H.
2) Ajuste los parametros del ZigZag (Profundidad, Desviacion) hasta que las fases coincidan con su analisis visual de la estructura de precios reciente.
3) Seleccione la fase que desea usar como ancla del Fibonacci (tipicamente Fase 2, 3 o superior).
4) Elija el modo de Fibonacci: "En el ZigZag" para analisis de fase, o "Respecto al P.A.S." para analisis basado en el contexto del precio de apertura semanal.
5) Monitoree como el precio interactua con los niveles de Fibonacci y el Precio de Apertura Semanal durante la semana.
6) Opcionalmente habilite RID para precision intradiaria en graficos de 1H o 15min.
## // Integracion con Otros Indicadores de Refugios //
══════════════════════════════════════════
RS (WR) es parte de nuestro ecosistema completo de analisis basado en refugios:
• RLP (LTR) (Refugios de Largo Plazo): Para determinacion automatica de la fase preponderante de un ZigZag, que los inversionistas institucionales eligen como base para un Fibo cuyos niveles calculan la proyeccion para colocacion de ordenes durante los meses y anios siguientes.
• RLPS (LTRS) (Refugios de Largo Plazo Simplificado): Version simplificada de RLP en la cual las coordenadas conocidas de las fases preponderantes (obtenidas con el indicador RLP) de uno o hasta cinco activos se capturan facilmente para operacion permanente de largo plazo.
• RS (WR) (Refugios Semanales de Corto Plazo): Para analisis tactico de corto plazo (4H, 1H) basado en fases elegidas de un ZigZag que definen niveles Fibo efectivos durante la(s) semana(s) pasada(s) reciente(s).
• RID (IDR) (Refugios Intra-Diarios): Para operaciones diarias basadas en niveles intradiarios en temporalidades de 1H o menos. Ideal para operadores de scalping.
Al combinar RLP, RLPS, RS y RID, obtiene un marco multinivel que le permite operar con claridad en cualquier horizonte temporal, desde posiciones intradiarias hasta inversiones que abarcan meses y anios.
## // Notas Adicionales //
══════════════════════════
1) Los parametros por defecto estan optimizados para activos volatiles (cripto, acciones tecnologicas). Para forex o instrumentos menos volatiles, considere reducir la Desviacion a 3-8%.
2) La "Fase en Desarrollo" (linea discontinua) muestra el segmento tentativo actual del ZigZag que aun puede cambiar conforme se formen nuevas barras.
3) Debido a las reglas de publicacion de TradingView (solo ingles), la version completa en espaniol de este indicador con todos los tooltips y documentacion estara disponible proximamente en nuestro repositorio de GitHub: aj-poolom-maasewal.
4) El reporte de cualquier error encontrado, propuestas de mejoras al generador de Zigzags, determinacion de pautas, o composicion del Fibo, etc., seran ampliamente agradecidas y tomadas en cuenta para una proxima version. Saludos y buena caceria.
══════════════════════════════════════════════════
Short-term
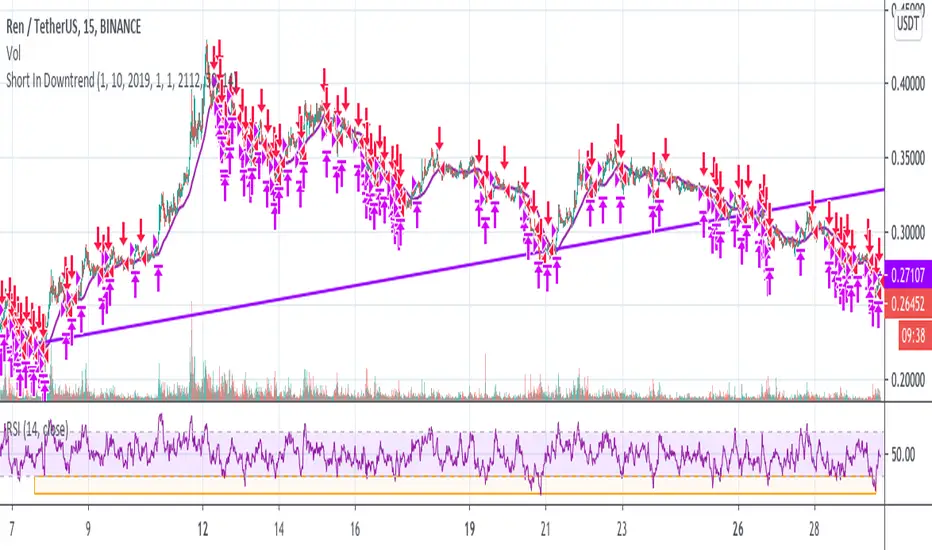
Short In Downtrend Below MA100 (Coinrule)This is a simple strategy to take advantage of downtrends. It's useful to run such a strategy as a hedge in times of market uncertainty.
The Sell Condition - Entry
The sell signal triggers when:
the coin has MA (100) greater than the price in a timeframe of 15 minutes, meaning that the coin is in a short-term downtrend.
the coin has an RSI greater than 30 in a timeframe of 15 minutes, indicating that it didn't reach oversold conditions yet, so there is still room for a further price drop.
On Coinrule, you can launch the strategy on real market conditions, setting up multiple sequential sell orders. The strategy would keep selling while the price stays below the MA(100). In that case, it's advisable to set low amounts for the sell orders. the position will grow gradually while the downtrend intensifies. Set a minimum time interval between the sell orders will also help to have control over the overall position size.
The Buy Condition - Exit
The bot connects to each trade a stop loss and a take profit. The percentages are optimized for short term trades on mid-cap coins. You can adjust the percentages depending on the specific coin you are trading. A ratio of 1:1.5 between the stop loss and the take profit could work as the strategy trades in the same direction of the trend.
Stop loss at 3% from the entry price
Take profit at 2% from the entry price
A slightly larger stop loss allows tolerating more volatility to reduce the case of stops triggering when it shouldn't.
Auto Analysis Short-term Reversals ExplorationAuto Analysis Short-term Reversals Exploration
Based on a study by Larry Lovrencic
Closing Price Reversals Automatic Analysis
Hook Reversals Automatic Analysis
Island Reversals Automatic Analysis
Key Reversals Automatic Analysis
Open/Close Reversals Automatic Analysis
Pivot Point Reversals Automatic Analysis
Hucklekiwi Pip - HLHB Trend-Catcher SystemThe strategy was authored by Hucklekiwi Pip back in 2015 and is still being updated today. She says that the system was designed to simply catch short-term forex trends. At its heart, the system is a simple EMA crossover strategy with a couple of other indicators used for confirming entries.
Strategy Rules
See her original post here:
www.babypips.com
Be sure to check out the updates and tweaks over the years!
HOW TO USE
For full information on how to use this strategy and how to correctly set the exit time, see this post:
backtest-rookies.com
T3DMA Trend DirectionI am using T3 moving averages to generate the idea of what kind of bias I should take in a current market.
So, how does this works?
When the close is higher than T3EMA10, the trend direction is upwards,
When the close is lower than T3EMA10, the trend direction is downward.
Using this, we can assume that there is higher probability for market to continue it's trend up or down, hence trade only in that direction. T3EMA5 is used to exit any open positions before trend changes it's direction.
Have a nice day trading and enjoy.
Dumb Indicator 9 - Bitfinex Shorts X LongsThis is a way to study how the crypto market is going on Bitfinex, you can see the diference between the Long and Short terms on most popular pairs.
UCS_S_Steve Primo - Strategy #8Hello Fellas,
Hope you are trading fantastic and fine. Here is another setup from Steve Primo (Stocks) Setups. He claims this can be applied on any market, and you can. Primarily focused on Stocks and Futures market.
NOTE : I DID CODE THE BOTTOM INDICATOR, NOT PUBLISHING IT, ITS JUST RSI(5)
What did I change, ofcourse I don't publish what I find, There is a bit of me in the codes.....
1. Setup only shows up at meaningful levels, Stringent Filter
Myself and tradearcher will keep this upto date. As he has volenteered to help with the track record of steve primo strategies.
docs.google.com
This is more like catching a freight train after a mini pullback.
AGAIN, This is not a holy grail, but this fits my personality of trading, Buying pullbacks on stronger stocks. Because it is harder to get a UCS_momo_Oscillator to signal a setup, primarily because of the smoothing, you can use this as an alternative to catch the excitement trade.
Do not sit on it for more than T+4 days, Unless another setup triggered in your way.
Rule - Buy/Sell the candle breakout next day after the setup - in the direction it is setting up
- Close the Position @ 100% candle extension or RSI Oversold.


