Entry Scanner Conservative Option AKeeping it simple,
Trend,
RSI,
Stoch RSI,
MACD, checked.
Do not have entry where there is noise on selection, look for cluster of same entry signals.
If you can show enough discipline, you will be profitable.
CT
Signal

SCOTTGO Advanced MACD🌟 Custom MACD: Enhanced Visuals & Crossover Signals
This indicator is a highly customized version of the traditional Moving Average Convergence Divergence (MACD) oscillator, designed to provide clear, immediate visual confirmation of signal line crossovers and zero-line crossings.
Core Features:
MACD Crossover Shadow Fill: The area between the MACD line and the Signal line is filled with a customizable shadow. This instantly visualizes whether the MACD is above (bullish crossover) or below (bearish crossover) the Signal line.
Signal Crossover Markers (Arrows & Dots):
Crossover Dot: A small, configurable solid dot is plotted exactly at the point where the MACD and Signal lines intersect, providing pinpoint accuracy for the crossover event.
Crossover Arrows: Customizable up (green) and down (red) arrows are plotted using a small numerical offset from the crossover point, ensuring visibility without cluttering the indicator lines.
Zero-Line Crossing Markers: Distinct, small markers (circles/diamonds) are used to signal when the MACD line crosses the zero line, indicating a shift in momentum relative to the baseline.
Customizable MA Type: The user can select either Exponential Moving Average (EMA) or Simple Moving Average (SMA) for both the MACD oscillator calculation and the signal line calculation.
This indicator is ideal for traders who rely on MACD crossovers and require precise, configurable visual feedback directly on the chart.

VCAI RSI Divergence +VCAI RSI Divergence+ is an RSI that shows trend, momentum, and divergence using V-CoresAI colour logic instead of a single white line.
What it shows:
Yellow RSI line → bullish momentum (RSI above its MA; buy-side pressure in control)
Purple RSI line → bearish momentum (RSI below its MA; sell-side pressure in control)
Thin blue line → fast RSI moving average that drives the colour flips
Dashed 70/30 lines → classic OB/OS zones
Background bands → soft purple in OB, soft yellow in OS to mark exhaustion areas
How to read it:
Yellow & rising → momentum shifting bullish; pullbacks into yellow OS band can be accumulation zones
Purple & falling → momentum shifting bearish; pushes into purple OB band can be distribution/sell zones
Hard colour flips (yellow ↔ purple) mark trend regime changes, not minor RSI noise
Divergence mode (on/off)
The divergence engine scans RSI and price pivot structure:
Bullish divergence (yellow) → price lower low + RSI higher low
Bearish divergence (purple) → price higher high + RSI lower high
Lines and tags appear only where a meaningful disagreement between price and RSI exists, giving early context for potential reversals or fade setups.
Together, the momentum colours + optional divergence mapping give a far clearer market read than a standard RSI, with zero clutter and no guesswork.

Swing Trading IndicatorThis script is a swing‑trading dashboard designed for BTC, ETH, S&P 500 (for now). It combines weekly RSI, USDT.D, VIX, moving averages and Fisher Transform into a single visual tool, with background highlights, an on‑chart info table and ready‑made alerts to help you time high‑probability swing entries and manage risk.
1. Overview
The indicator is intended to work on daily timeframe.
Signals are context‑aware: BTC and ETH get USDT.D conditions, SPX gets VIX and EMA‑100 logic, and all non‑ETH symbols can also use Fisher Transform as a mean‑reversion filter.
2. Conditions and background highlights
Each component sets a boolean condition and, when active, paints a background layer:
Weekly RSI condition
True when weekly RSI is below its symbol‑specific threshold.
USDT.D conditions
BTC: triggered when USDT.D is above the user threshold and the chart symbol is BTC.
ETH: same logic for ETH, but tracked separately..
VIX condition (SPX only)
True when VIX high is at or above the VIX threshold while the chart is SPX.
EMA condition (BTC & SPX)
BTC: daily close below EMA‑200.
SPX: daily close below EMA‑100.
Fisher Transform condition (non‑ETH)
Fisher Transform on the chart timeframe, using the configured period.
True when Fisher value is below the Fisher threshold.
3. Intended use and notes
This indicator is designed as a confluence tool for swing traders, not a standalone buy/sell system. It works best on assets that are in a clear uptrend, where the main idea is to accumulate during corrections within that broader bullish structure.
During larger market shocks, deep corrections, or black‑swan events, trend‑based and mean‑reversion filters can produce false signals, because volatility and correlations often behave abnormally in those periods. For that reason, this script should always be combined with independent risk management, higher‑timeframe trend analysis, and your own discretion.

Setup Keltner Banda 3 e 5 - MMS + RSI + Distância Tabela
📊 Indicator Overview: Keltner Bands + RSI + Distance Table
This custom TradingView indicator combines three powerful tools into a single, visually intuitive setup:
Keltner Channels (Bands 3x and 5x ATR)
Relative Strength Index (RSI)
Dynamic Table Displaying RSI and Price Distance from Moving Average (MMS)
🔧 Components and Functions
1. Keltner Channels (3x and 5x ATR)
Based on a Simple Moving Average (MMS) and Average True Range (ATR).
Two sets of bands are plotted:
3x ATR Bands: Used for moderate volatility signals.
5x ATR Bands: Used for high volatility extremes.
Visual fills between bands help identify overextended price zones.
2. RSI (Relative Strength Index)
Measures momentum and potential reversal zones.
Customizable overbought (default 70) and oversold (default 30) levels.
RSI values are color-coded in the table:
Green for RSI ≤ 30 (oversold)
Blue for 30 < RSI ≤ 70 (neutral)
Red for RSI > 70 (overbought)
3. Distance Table (Price vs. MMS)
Displays the real-time distance between the current price and the MMS:
In points (absolute difference)
In percentage (relative to MMS)
Helps traders assess how far price has deviated from its mean.
📈 How to Use
Trend Reversal Signals
Look for price crossing back inside the 3x or 5x Keltner Bands.
Confirm with RSI:
RSI > 70 + price re-entering from above = potential short
RSI < 30 + price re-entering from below = potential long
Volatility Zones
Price outside the 5x band indicates extreme movement.
Use this to anticipate mean reversion or breakout continuation.
Table Insights
Monitor RSI and price distance in real time.
Use color cues to quickly assess momentum and stretch.
⚙️ Customization
Adjustable parameters for:
MMS period
ATR multipliers
RSI period and thresholds
Table position on chart
Fill colors between bands
This indicator is ideal for traders who want a clean, data-rich visual tool to track volatility, momentum, and price deviation in one place.

Trend Tracer [AlgoAlpha]🟠 OVERVIEW
This tool builds a two-stage trend model that reacts to structure shifts while also showing how strong or weak the move is. It uses a mid-price band (from the highest high and lowest low over a lookback) and applies two Supertrend passes on top of it. The first pass smoothens the basis. The second pass refines that direction and produces the final trail used for signals. A gradient fill between the two trails uses RSI of price-to-trail distance to show when price is stretched or cooling off. The aim is to give traders a simple way to read trend alignment, pressure, and early turns without guessing.
🟠 CONCEPTS
The script starts with a mid-range basis. This is the average of the rolling highest high and lowest low. It acts as a stable structure reference instead of raw close or typical price. From there, two Supertrend layers are applied:
• The first Supertrend uses a shorter ATR period and lower factor. It reacts faster and sets the main regime.
• The second Supertrend uses a slightly longer ATR and higher factor. It filters noise, waits for confirmed continuation, and generates the signal line.
The interaction between these trails matters. The outer Supertrend provides context by defining the broader regime. The inner Supertrend provides timing by flipping earlier and marking possible shifts. The gradient fill uses RSI of (close − supertrend value) to display when price stretches away from the trail. This shows strength, exhaustion, or compression within the trend.
🟠 FEATURES
Bullish and bearish flip markers placed at recent highs/lows
Rejection signals off the trend tracer line
Alerts for bullish and bearish trend changes
🟠 USAGE
Setup : Add the script to your chart. Timeframe is flexible; lower timeframes show more flips while higher ones give cleaner swings. Adjust Length to change how wide the basis range is. Use the two ATR settings and factors to match the volatility of the market you trade.
Read the chart : When the refined trail (stv_) sits above price the regime is bearish; when below, it is bullish. The wide trail (stv) confirms the larger move. Watch the gradient fill: darker colors appear when price is stretched from the trail and lighter colors appear when the move is weakening. Flip markers ▲ or ▼ highlight the first clean shift of the refined trail.
Settings that matter : Increasing the Main Factor slows main-trend flips and filters chop. Increasing the Signal Factor delays the timing trail but reduces noise. Shortening Length makes the basis more reactive. ATR periods change how sensitive each Supertrend pass is to volatility.

Gravestone Doji ScannerSpeaks for itself. Set it on the chart. Use Arrow Keys to move through the watchlist.

Support Line [by rukich]🟠 OVERVIEW
The indicator displays a floating line that acts as a support level. It's important to remember that any support level can be broken.
🟠 COMPONENTS
The indicator is based on the percentage difference between the closes of the n-th bar back and the current bar. The resulting percentage is smoothed to remove noise.
The indicator is displayed as a green-red line (the colors don’t carry meaning — they are used just for visual variety). When the price touches the support level, the bar background turns green.
For convenience, there is a label on the right side of the indicator showing the current value of the line.
🟠 HOW TO USE
The indicator includes several settings that can be adjusted, though optimal defaults are provided.
Settings:
Timeframe — specifies which timeframe’s data is used to calculate the line.
Candles back — specifies how many bars back from the current one are used.
The indicator should be used according to general support-zone logic. Since no support zone guarantees a price bounce, the optimal approach is to confirm the reaction after the price touches the line.
Example of use:
In the current example, the Timeframe in the indicator settings is set to 1 hour, and the currently open chart is 5 minutes. This means that on the 5-minute chart we see a 1-hour line. After the price touches the support line, you need to see a confirmation of the reaction to understand whether the support zone is holding the price.
In the examples, reaction confirmation is shown through: the formation of an M5 shift and the invalidation of an FVG M5- (the latter is more risky than the M5 shift):
🟠 CONCLUSION
The indicator shows a floating support zone, and when tested, you should confirm the reaction on a lower timeframe.

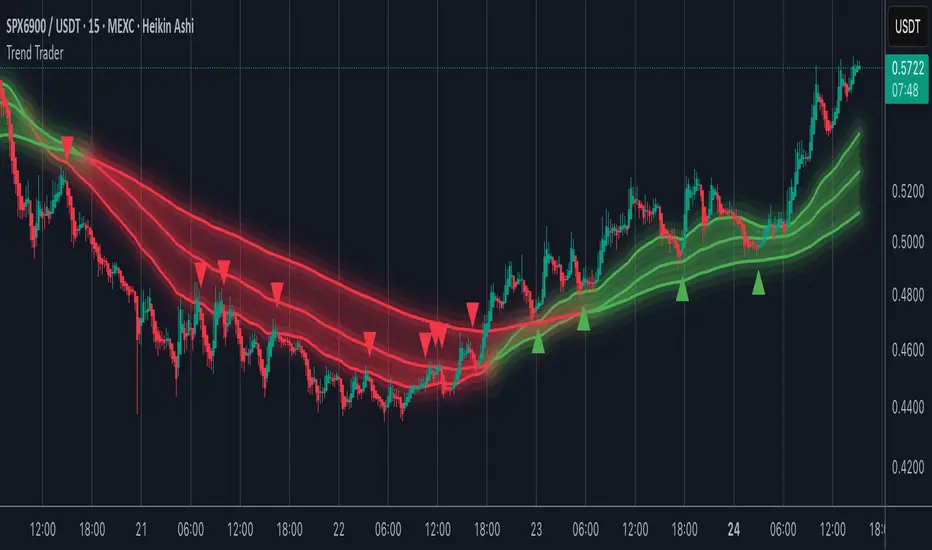
Trend TraderMost trend indicators don’t offer continuation signals or accurate bounce points, so I created this indicator that uses one of the most common trading levels (EMAs). This indicator uses the 50, 100, and 200 EMAs along with WaveTrend signals to trade trends. Buy Signals are filtered so that they only show up when the 100 EMA is above the 200. And Inverse for Sell Signals.
This indicator works well with both Stocks and Crypto. Default settings work best on 15 min, 1H, 2H, and 4H.
(Chart examples are using Heikin Ashi Candles, on Log Scale.)
*Buy and Sell Signals do not repaint.
Settings:
- Ability to show all buy and sell signals regardless of trend.
- To change the sensitivity of the buy and sell signals, change the “Average Length”
- (The lower the number the more sensitive, the higher the number the less they pop up)
- Ability to change EMA Lengths
imgur.com
Tactical Deviation🎯 TACTICAL DEVIATION - Volume-Backed VWAP Deviation Analysis
What Makes This Different?
Unlike basic VWAP indicators, Tactical Deviation combines:
• Multi-timeframe VWAP deviation bands (Daily/Weekly/Monthly)
• Volume spike intelligence - signals only appear with volume confirmation
• Pivot reversal detection at deviation extremes
• Optional multi-VWAP confluence system
• Smart defaults for quality over quantity
This unique combination filters weak setups and identifies high-probability entries at extreme price deviations from fair value.
📊 DEFAULT SETTINGS (Ready to Use)
✅ Daily VWAP with ±2σ deviation bands
✅ Volume spike detection (1.5x average required)
✅ 2σ minimum deviation for signals
❌ Weekly/Monthly VWAPs (enable for multi-timeframe)
❌ Pivot reversal requirement (enable for stronger signals)
❌ Fill zones (optional visual enhancement)
Why: Daily VWAP is most relevant for intraday trading. 2σ bands catch meaningful moves. Volume spikes ensure conviction. Clean chart focuses on what matters.
🚀 HOW TO USE
BASIC USAGE:
• Green triangles (below bars) = Long signals at oversold deviations
• Red triangles (above bars) = Short signals at overbought deviations
SIGNAL QUALITY:
• Normal size, bright colors = Volume spike (best quality)
• Small size, lighter colors = Volume momentum
• Tiny size = No volume confirmation
DEVIATION ZONES:
• ±2σ = Extreme deviation (signals appear here)
• ±1σ to ±2σ = Extended but not extreme
• Within ±1σ = Normal range
TRADING APPROACHES:
Mean Reversion:
→ Enter when price reaches ±2σ with volume spike
→ Target: Return to VWAP or opposite band
→ Stop: Beyond extreme deviation
Trend Continuation:
→ Use bands to identify pullbacks
→ Enter pullback to VWAP in trending market
→ Volume confirms continuation
Reversal Trading:
→ Enable "Require Pivot Reversal" for stronger signals
→ Signals only when deviation + pivot reversal occur
→ Higher probability, fewer signals
⚙️ EXPLORE SETTINGS FOR FULL USE
VWAP SETTINGS:
• Show Weekly/Monthly VWAP = Multi-timeframe context
• Show ±1σ Bands = Normal deviation range
• Show ±3σ Bands = Extreme extremes (rare but powerful)
SIGNAL SETTINGS:
• Min Deviation: 1σ (more signals) | 2σ (default) | 3σ (fewer, extreme only)
• Require Pivot Reversal: OFF (default) | ON (stronger but fewer)
• Volume Spike Threshold: 1.5x (default) | 2.0x+ (major spikes) | 1.2x (more signals)
CONFLUENCE SETTINGS:
• Require Multi-VWAP Confluence: OFF (default) | ON (2+ VWAPs must agree)
• Min VWAPs: 2 (Daily + Weekly/Monthly) | 3 (all must agree)
VISUAL SETTINGS:
• Show Fill Zones = Shaded areas between bands
• Fill Opacity = Transparency adjustment
• Line Widths = Customize thickness
💡 PRO TIPS
1. Start with defaults, then enable features as you learn
2. Volume spike requirement filters weak moves - keep it enabled
3. Enable Weekly/Monthly VWAPs for higher timeframe context
4. Enable confluence for swing trading setups
5. Pivot reversals: ON for reversals, OFF for continuations
6. Check top-right info table for current deviation levels
🎨 VISUAL GUIDE
• Cyan Line = Daily VWAP (fair value)
• Cyan Bands = Daily deviation zones
• Orange Line = Weekly VWAP (if enabled)
• Purple Line = Monthly VWAP (if enabled)
• Green Triangle = Long signal (oversold)
• Red Triangle = Short signal (overbought)
⚠️ IMPORTANT
Educational purposes only. Always use proper risk management. Signals are based on statistical deviation, not guarantees. Volume confirmation improves quality but doesn't guarantee outcomes. Combine with your own analysis.
The unique combination of VWAP deviation analysis, volume profile confirmation, pivot identification, and multi-timeframe confluence in a single clean interface makes Tactical Deviation different from basic VWAP indicators.
Happy Trading! 📈

Liquidation Reversal Signals [AlgoAlpha]🟠 OVERVIEW
This tool detects potential liquidation-driven reversals by combining z-score analysis of up/down volume with the classic Supertrend. It watches for abnormal surges in directional volume (on a lower timeframe) and links them to trend flips on the main chart. When both align within a short window, it flags a probable reversal caused by forced liquidations. The goal is to help traders identify exhaustion points where aggressive liquidation moves may mark the end of a trend leg.
🟠 CONCEPTS
The logic revolves around Z-score normalization of up and down volume to locate statistical extremes. When up-volume z-scores exceed a threshold during a bearish Supertrend, it implies trapped shorts being squeezed; the opposite applies for long liquidations. The script tracks these liquidation spikes and monitors whether a Supertrend regime change follows soon after. If confirmed within the allowed timeout, a colored signal marks the event.
In essence:
Z-score outliers = potential forced liquidations.
Supertrend = structural regime context.
Combined = statistically confirmed reversal signals, not random flips.
This pairing reduces false positives by ensuring that both volatility structure and order-flow extremes agree before flagging a reversal.
🟠 FEATURES
Z-score detection for liquidation spikes with adjustable lookback and threshold.
Confirmation logic linking liquidations to Supertrend flips.
Alerts for liquidation spikes and confirmed reversal starts.
On-chart “No Volume” warning to avoid misreads on illiquid assets.
🟠 USAGE
Setup : Add the script to your main chart. Choose a lower timeframe (default 15m) to capture more granular liquidation flows. Adjust Z-Score Length to control how far back the script measures normal behavior and Threshold to decide what counts as extreme. Keep Timeout Bars low (e.g. 20–50) for faster reversals, or higher for slower markets.
Read the chart :
• Circles appear below bars when long liquidations occur; above bars for short liquidations.
• A Supertrend flip with a recent liquidation spike will display an arrow and color shift.
• Fills between candles and trend lines show which side dominates: green for bullish reversal, red for bearish.
• Candle color fades based on the magnitude of liquidation pressure.
Settings that matter :
• Z-Score Length : Longer smooths noise but delays signal; shorter reacts faster.
• Z-Score Threshold : Higher means only extreme liquidations trigger; lower finds smaller squeezes.
• Timeout Bars : Defines how long after a liquidation the Supertrend flip remains valid.
• Lower Timeframe : Determines the precision of volume readings; too low may increase noise.

Volume Sentiment Breakout Channels [AlgoAlpha]🟠 OVERVIEW
This tool visualizes breakout zones based on volume sentiment within dynamic price channels . It identifies high-impact consolidation areas, quantifies buy/sell dominance inside those zones, and then displays real-time shifts in sentiment strength. When the market breaks above or below these sentiment-weighted channels, traders can interpret the event as a change in conviction, not just a technical breakout.
🟠 CONCEPTS
The script builds on two layers of logic:
Channel Detection : A volatility-based algorithm locates price compression areas using normalized highs and lows over a defined lookback. These “boxes” mark accumulation or distribution ranges.
Volume Sentiment Profiling : Each channel is internally divided into small bins, where volume is aggregated and signed by candle direction. This produces a granular sentiment map showing which levels are dominated by buyers or sellers.
When a breakout occurs, the script clears the previous box and forms a new one, letting traders visually track transitions between phases of control. The colored gradients and text updates continuously reflect the internal bias—green for net-buying, red for net-selling—so you can see conviction strength at a glance.
🟠 FEATURES
Volume-weighted sentiment map inside each box, with gradient color intensity proportional to participation.
Dynamic text display of current and overall sentiment within each channel.
Real-time trail lines to show active bullish/bearish trend extensions after breakout.
🟠 USAGE
Setup : Add the script to your chart and enable Strong Closes Only if you prefer cleaner breakouts. Use shorter normalization length (e.g., 50–80) for fast markets; longer (100–200) for smoother transitions.
Read Signals : Transparent boxes mark active sentiment channels. Green gradients show buy-side dominance, red shows sell-side. The middle dashed line is the equilibrium of the channel. “▲” appears when price breaks upward, “▼” when it breaks downward.
Understanding Sentiment : The sentiment profile can be used to show the probability of the price moving up or down at respective price levels.

Statistical Price Deviation Index (MAD/VWMA)SPDI is a statistical oscillator designed to detect potential price reversal zones by measuring how far price deviates from its typical behavior within a defined rolling window.
Instead of using momentum or moving averages like traditional indicators, SPDI applies robust statistics - a rolling median and Mean Absolute Deviation (MAD) - to calculate a normalized measure of price displacement. This normalization keeps the output bounded (from −1 to +1 by default), producing a stable and consistent oscillator that adapts to changing volatility conditions.
The second line in SPDI uses a Volume-Weighted Moving Average (VWMA) instead of a simple price median. This creates a complementary oscillator showing statistically weighted deviations based on traded volume. When both oscillators align in their extremes, strong confluence reversal signals are generated.
How It Works
For each bar, SPDI calculates the median price of the last N bars (default 100).
It then measures how far the current bar’s midpoint deviates from that rolling median.
The Mean Absolute Deviation (MAD) of those distances defines a “normal” range of fluctuation.
The deviation is normalized and compressed via a tanh mapping, keeping the oscillator in fixed boundaries (−1 to +1).
The same logic is applied to the VWMA line to gauge volume-weighted deviations.
How to Use
The blue line (Price MAD) represents pure price deviation.
The green line (VWMA Disp) shows the volume-weighted deviation.
Overbought (red) zones indicate statistically extreme upward deviation -> potential short-term overextension.
Oversold (green) zones indicate statistically extreme downward deviation -> potential rebound area.
Confluence signals (both lines hitting the same extreme) often mark strong reversal points.
Settings Tips
Lookback length controls how much historical data defines “normal” behavior. Larger = smoother, smaller = more sensitive.
Smoothing (RMA length) can reduce noise without changing the overall statistical logic.
Output scale can be set to either −1..+1 or 0..100, depending on your visual preference.
Alerts and color fills are fully customizable in the Style tab.
Summary:
SPDI transforms raw price and volume data into a statistically bounded deviation index. When both Price MAD and VWMA Disp reach joint extremes, it highlights probable market turning points - offering traders a clean, data-driven way to spot potential reversals ahead of time.

Magracia Entry-Exit 5 Min Time frame//------------------------------------------------------------------------------------------------------
// 🧭 Indicator Description
//------------------------------------------------------------------------------------------------------
// 📘 Overview:
// This indicator is a modified version of the LuxAlgo pattern logic designed to detect
// high-probability **RBD (Rally–Base–Drop)** and **DBR (Drop–Base–Rally)** reversal structures
// directly on the current candle. It automatically identifies potential BUY and SELL zones,
// plots corresponding trade signals, and dynamically calculates **Take Profit (TP)** and **Stop Loss (SL)** levels.
//
// The goal of this tool is to give clear, visually guided trade entries and exits that
// follow price structure and momentum changes without repainting historical data.
//
//------------------------------------------------------------------------------------------------------
// 🧩 How It Works:
// • **RBD (Rally–Base–Drop)** → Indicates a bearish reversal (SELL signal)
// • **DBR (Drop–Base–Rally)** → Indicates a bullish reversal (BUY signal)
// • Optional **RBR / DBD** continuation patterns can be toggled on for trend continuation setups.
// • When a signal is detected, the script automatically places:
// ▫ A BUY or SELL marker at the candle
// ▫ Dynamic TP (green dotted line) and SL (red dotted line) levels
// ▫ An EXIT marker when either TP or SL is reached
//
//------------------------------------------------------------------------------------------------------
// ⚙️ Inputs:
// • Enable or disable individual pattern types (RBD, RBR, DBD, DBR)
// • Toggle continuation patterns (RBR/DBD)
// • Customize Take Profit and Stop Loss percentages
// • Adjust rally/drop bar colors for easier pattern visualization
//
//------------------------------------------------------------------------------------------------------
// 🧠 Usage Tips:
// • Works best on volatile pairs and short–term timeframes (1m to 15m)
// • Can be combined with volume or trend filters for stronger confirmation
// • When used on higher timeframes (e.g., 4H+), increase TP/SL percentage range
//
//------------------------------------------------------------------------------------------------------
// ⚠️ Notes:
// • Signals are plotted **in real-time on the current candle** (not delayed).
// • This indicator is for visual and educational use only and does not guarantee profitability.
// • For optimal results, combine it with proper risk management and confirmation indicators.
//
//------------------------------------------------------------------------------------------------------
// © Gideon (CC BY-NC-SA 4.0 Licensed)
//------------------------------------------------------------------------------------------------------

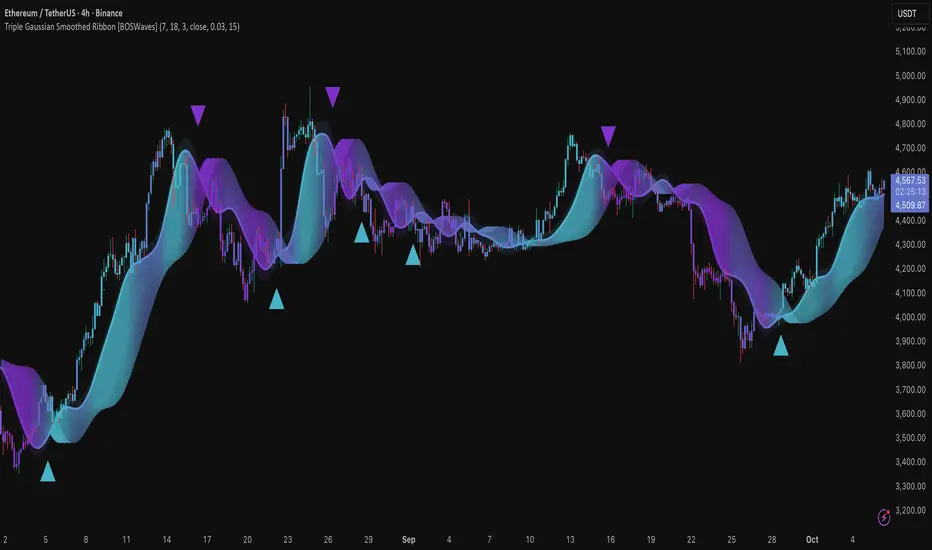
Triple Gaussian Smoothed Ribbon [BOSWaves]Triple Gaussian Smoothed Ribbon – Adaptive Gaussian Framework
Overview
The Triple Gaussian Smoothed Ribbon is a next-generation market visualization framework built on the principles of Gaussian filtering - a mathematical model from digital signal processing designed to remove noise while preserving the integrity of the underlying trend.
Unlike conventional moving averages that suffer from phase lag and overreaction to volatility spikes, Gaussian smoothing produces a symmetrical, low-lag curve that isolates meaningful directional shifts with exceptional clarity.
Developed under the Adaptive Gaussian Framework, this indicator extends the classical Gaussian model into a multi-stage smoothing and visualization system. By layering three progressive Gaussian filters and rendering their interactions as a gradient-based ribbon field, it translates market energy into a coherent, visually structured trend environment. Each ribbon layer represents a progressively smoothed component of price motion, producing a high-fidelity gradient field that evolves in sync with real-time trend strength and momentum.
The result is a uniquely fluid trend and reversal detection system - one that feels organic, adapts seamlessly across timeframes, and reveals hidden transitions in market structure long before traditional indicators confirm them.
Theoretical Foundation
The Gaussian filter, derived from the Gaussian function developed by Carl Friedrich Gauss in 1809, operates on the principle of weighted symmetry, assigning higher importance to central price data while tapering influence toward historical extremes following a bell-curve distribution. This symmetrical design minimizes phase distortion and smooths without introducing lag spikes — a stark contrast to exponential or linear filters that sacrifice temporal accuracy for responsiveness.
By cascading three Gaussian stages in sequence, the indicator creates a multi-frequency decomposition of price action:
The first stage captures immediate trend transitions.
The second absorbs mid-term volatility ripples.
The third stabilizes structural directionality.
The final composite ribbon reflects the market’s dominant frequency - a smoothed yet reactive trend spine - while an independent, heavier Gaussian smoothing serves as a reference layer to gauge whether the primary motion leads or lags relative to broader market structure.
This multi-layered Gaussian framework effectively replicates the behavior of a signal-processing filter bank: isolating meaningful cyclical movements, suppressing random noise, and revealing phase shifts with minimal delay.
How It Works
Triple Gaussian Core
Price data is passed through three successive Gaussian smoothing stages, each refining the trend further and removing higher-frequency distortions.
The result is a fluid, continuously adaptive baseline that responds naturally to directional changes without overshooting or flattening key inflection points.
Adaptive Ribbon Architecture
The indicator visualizes its internal dynamics through a five-layer gradient ribbon. Each layer represents a progressively delayed Gaussian curve, creating a color field that dynamically shifts between bullish and bearish tones.
Expanding ribbons indicate accelerating momentum and trend conviction.
Compressing ribbons reflect consolidation and volatility contraction.
The smooth color gradient provides a real-time depiction of energy buildup or dissipation within the trend, making it visually clear when the market is entering a state of expansion, transition, or exhaustion.
Momentum-Weighted Opacity
Ribbon transparency adjusts according to normalized momentum strength.
As trend force builds, colors intensify and layers become more opaque, signifying conviction.
When momentum wanes, ribbons fade - an early visual cue for potential reversals or pauses in trend continuation.
Candle Gradient Integration
Optional candle coloring ties the chart’s candles to the prevailing Gaussian gradient, allowing traders to view raw price action and smoothed wave dynamics as a unified system.
This integration produces a visually coherent chart environment that communicates directional intent instantly.
Signal Detection Logic
Directional cues emerge when the smoother, broader Gaussian curve crosses the faster-reacting Gaussian line, marking structural inflection points in the filtered trend.
Bullish shifts : short-term momentum transitions upward through the long-term baseline after a localized trough.
Bearish shifts : momentum declines through the baseline following a local peak.
To maintain integrity in choppy markets, the framework applies a trend-strength and separation filter, which blocks weak or overlapping conditions where movement lacks conviction.
Interpretation
The Triple Gaussian Smoothed Ribbon provides a layered, intuitive read on market structure:
Trend Continuation : Expanding ribbons with deep color intensity confirm directional strength.
Reversal Phases : Color gradients flip direction, indicating a phase shift or exhaustion point.
Compression Zones : Tight, pale ribbons reveal equilibrium phases often preceding breakouts.
Momentum Divergence : Fading color intensity despite continued price movement signals weakening conviction.
These transitions mirror the natural ebb and flow of market energy - captured through the Gaussian filter’s ability to represent smooth curvature without distortion.
Strategy Integration
Trend Following
Engage during strong directional expansions. When ribbons widen and color gradients intensify, the trend is accelerating with high confidence.
Reversal Identification
Monitor for full gradient inversion and fading momentum opacity. These conditions often precede transitional phases and early reversals.
Breakout Anticipation
Flat, compressed ribbons signal low volatility and energy buildup. A sudden gradient expansion with renewed opacity confirms breakout initiation.
Multi-Timeframe Alignment
Use higher timeframes to establish directional bias and lower timeframes for entry during compression-to-expansion transitions.
Technical Implementation Details
Triple Gaussian Stack : Sequential smoothing stages produce low-lag, high-purity signals.
Adaptive Ribbon Rendering : Five-layer Gaussian visualization for gradient-based trend depth.
Momentum Normalization : Opacity dynamically tied to trend strength and volatility context.
Consolidation Filter : Suppresses false signals in low-energy or range-bound conditions.
Integrated Candle Mode : Optional color synchronization with underlying gradient flow.
Alert System : Built-in notifications for bullish and bearish transitions.
This structure blends the precision of digital signal processing with the readability of visual market analysis, creating a clean but information-rich framework.
Optimal Application Parameters
Asset Recommendations
Cryptocurrency : Higher smoothing and sigma for stability under volatility.
Forex : Balanced parameters for cycle identification and reduced noise.
Equities : Moderate Gaussian length for responsive yet stable trend reads.
Indices & Futures : Longer smoothing periods for structural confirmation.
Timeframe Recommendations
Scalping (1 - 5m) : Use shorter smoothing for fast reactivity.
Intraday (15m - 1h) : Mid-length Gaussian chain for balance.
Swing (4h - 1D) : Prioritize clarity and opacity-driven trend phases.
Position (Daily - Weekly) : Longer smoothing to capture macro rhythm.
Performance Characteristics
Most Effective In :
Trending markets with recurring volatility cycles.
Transitional phases where early directional confirmation is crucial.
Less Effective In:
Ultra-low volume markets with erratic tick data.
Random, micro-chop conditions with no structural flow.
Integration Guidelines
Pair with volatility or volume expansion tools for enhanced breakout confirmation.
Use ribbon compression to anticipate volatility shifts.
Align entries with gradient expansion in the dominant color direction.
Scale position size relative to opacity strength and ribbon width.
Disclaimer
The Triple Gaussian Smoothed Ribbon – Adaptive Gaussian Framework is designed as a signal visualization and trend interpretation tool, not a standalone trading system. Its accuracy depends on appropriate parameter tuning, contextual confirmation, and disciplined risk management. It should be applied as part of a comprehensive technical or algorithmic trading strategy.
Multi-Timeframe MACD with Color Mix (Nikko)Multi-Timeframe MACD with Color Mix (Nikko) Indicator
This documentation explains the benefits of the "Multi-Timeframe MACD with Color Mix (Nikko)" indicator for traders and provides easy-to-follow steps on how to use it. Written as of 05:06 AM +07 on Saturday, October 04, 2025, this guide focuses on helping you, as a trader, get the most out of this tool with clear, practical advice before diving into the technical details.
Benefits for Traders
1. Multi-Timeframe Insight
This indicator lets you see momentum trends across 15-minute, 1-hour, 1-day, and 1-week timeframes all on one chart. This big-picture view helps you catch both quick market moves and long-term trends without flipping between charts, saving you time and giving you a fuller understanding of the market.
2. Visual Momentum Representation
The background changes from red to green based on short-term (15m) momentum, giving you a quick, easy-to-see signal—red means bearish (prices might drop), and green means bullish (prices might rise). The histogram uses a mix of red, green, and blue colors to show the combined strength of the 1-hour, 1-day, and 1-week timeframes, helping you spot strong trends at a glance (e.g., a bright mix for strong momentum, darker for weaker).
3. Enhanced Decision-Making
The background and histogram colors work together to confirm trends across different timeframes, making it less likely you’ll act on a false signal. This helps you feel more confident when deciding when to buy, sell, or hold.
4. Proactive Alert System
You can set alerts to notify you when the percentage of bullish timeframes hits your chosen levels (e.g., below 10% for bearish, above 90% for bullish). This keeps you in the loop on big momentum shifts without needing to watch the chart all day—perfect for when you’re busy.
5. Flexibility and Efficiency
You can turn timeframes on or off, adjust settings like speed of the moving averages, and tweak transparency to fit your trading style—whether you’re a fast scalper or a patient swing trader. Everything is shown on one chart, saving you effort, and the colors make it simple to read, even if you’re new to trading.
How to Use It
Getting Started
Add the Indicator: Load the "Multi-Timeframe MACD with Color Mix (Nikko)" onto your TradingView chart using the Pine Script editor or indicator library.
Pick Your Timeframes: Turn on the timeframes that match your trading—use 15m and 1h for quick trades, or 1d and 1w for longer holds—using the enable_15m, enable_1h, enable_1d, enable_1w, and enable_background options.
Reading the Colors
Background Gradient: Watch for red to signal bearish 15m momentum and green for bullish momentum. Adjust the Background_transparency (default 75%, or 25% opacity) if the chart feels too busy—try lowering it to 50 for clearer candlesticks in fast markets.
Histogram and EMA Colors:
The histogram and its Exponential Moving Average (EMA) line show a mix of red (1-week), green (1-day), and blue (1-hour) based on how strong the momentum is in each timeframe.
Brighter colors mean stronger momentum—white (all bright) shows all timeframes are pushing up hard, while darker shades (like gray or black) mean weaker or mixed momentum.
Turn off a timeframe (e.g., enable_1h = false) to see how it changes the color mix and focus on what matters to you.
Setting Alerts
Set Your Levels: Choose a threshold_low (default 10%) and threshold_high (default 90%) based on your comfort zone or past market patterns to catch big turns.
Get Notifications: Use TradingView alerts to get pings when the market hits your set levels, so you can act without staring at the screen.
Practical Tips
Pair with Other Tools: Use it with support/resistance lines or the RSI to double-check your moves and build a solid plan.
Tweak Settings: Adjust fast_length, slow_length, and signal_smoothing to match your asset’s speed, and bump up the lookback (default 50) for steadier trends in wild markets.
Practice First: Test different timeframe combos on a demo account to find what works best for you.
Understanding the Colors (Simple Explanation)
How Colors Work
The histogram and its EMA line use a color mix based on a simple idea from color theory, like mixing paints with red, green, and blue (RGB):
Red comes from the 1-week timeframe, green from 1-day, and blue from 1-hour.
When all three timeframes show strong upward momentum, they blend into bright white—the brightest color, like a super-bright light telling you the market’s roaring up.
If some timeframes are weak or pulling down, the mix gets darker (like gray or black), warning you the momentum might not be solid.
Brighter is Better
Bright Colors = Strong Opportunity: The brighter the histogram and EMA (closer to white), the more all your chosen timeframes are in agreement that prices are rising. This is your signal to think about buying or holding, as it points to a powerful trend you can ride.
Dark Colors = Caution: A darker mix (toward black) means some timeframes are lagging or bearish, suggesting you might wait or consider selling. It’s like a dim light saying, “Hold on, check again.”
Benefit in Practice: Watching the brightness helps you jump on the best trades fast. For example, a bright white histogram on a green background is like a green traffic light—go for it! A dark gray on red is like a red light—pause and rethink. This quick color check can save you from bad moves and boost your profits when the trend is strong.
Why It Helps
These colors are your fast friend in trading. A bright histogram means all your timeframes are cheering for an uptrend, giving you the confidence to act. A dull one tells you to be careful, helping you avoid traps. It’s like having a color-coded guide to pick the hottest market moments!
Technical Details
Input Parameters
Fast Length (default: 12): Short-term moving average speed.
Slow Length (default: 26): Long-term moving average speed.
Source (default: close): Price data used.
Signal Smoothing (default: 9): Smooths the signal line.
MA Type (default: EMA): Choose EMA or SMA.
Timeframe and Scaling
Timeframes: 15m, 1h, 1d, 1w, with on/off switches.
Lookback Period (default: 50): Sets the data window for trends.
Background Transparency (default: 75%): Controls background see-through level.
MACD Calculation
Per Timeframe: Uses request.security():
MACD Line: ta.ema(src, fast_length) - ta.ema(src, slow_length).
Signal Line: ta.ema(MACD, signal_length).
Histogram: (macd - signal) / 3.0.
Background Gradient
15m Normalization: norm_value = (hist_15m - hist_15m_min) / max(hist_15m_range, 1e-10), limited to 0-1.
RGB Mix: Red drops from 255 to 0, green rises from 0 to 255, blue stays 0.
Apply: color.new(color.rgb(r_val, g_val, b_val), Background_transparency).
Histogram and EMA Colors
Color Assignment:
1h: Blue (#0000FF) if hist_1h >= 0, else black.
1d: Green (#00FF00) if hist_1d >= 0, else black.
1w: Red (#FF0000) if hist_1w >= 0, else black.
Final Color: final_color = color.rgb(min(r, 255), min(g, 255), min(b, 255)).
Plotting: Histogram and EMA use final_color; MACD (#2962FF), signal (#FF6D00).
Alerts
Bullish Percentage: bullish_pct = (bullish_count / bullish_total) * 100, counting hist >= 0.
Triggers: Below threshold_low or above threshold_high.
--------------------------------------------------------------------
Conclusion
The "Multi-Timeframe MACD with Color Mix (Nikko)" is your all-in-one tool to spot trends, confirm moves, and trade smarter with its bright, easy-to-read colors. By using it wisely, you can sharpen your market edge and trade with more confidence.
This README is tailored for traders and reflects the indicator's practical value as of 05:06 AM +07 on October 04, 2025.

Signal Generator: HTF EMA Momentum + MACDSignal Generator: HTF EMA Momentum + MACD
What this script does
This indicator combines a higher-timeframe EMA trend filter with a MACD crossover on the chart’s timeframe. The goal is to make MACD signals more selective by checking whether they occur in the same direction as the broader trend.
How it works
- On the higher timeframe, two EMAs are calculated (short and long). Their difference is used as a simple momentum measure.
- On the chart timeframe, the MACD is calculated. Crossovers are then filtered with two conditions:
1.They must align with the higher-timeframe EMA trend.
2.They must occur beyond a small “zero band” threshold, with a minimum distance between MACD and signal lines.
- When both conditions are met, the script can plot BUY or SELL labels. ATR is used only to shift labels up or down for visibility.
Visuals and alerts
- Histogram bars show whether higher-timeframe EMA momentum is rising or falling.
- MACD main and signal lines are plotted with optional scaling.
- Dotted lines show the zero band region.
- Optional large BUY/SELL labels appear when conditions are confirmed on the previous bar.
- Alerts can be enabled for these signals; they trigger once per bar close.
Notes and limitations
- Higher-timeframe values are only confirmed once the higher-timeframe candle has closed.
- Scaling factors affect appearance only, not the logic.
- This is an open-source study intended as a learning and charting tool. It does not provide financial advice or guarantee performance.

Deadband Hysteresis Filter [BackQuant]Deadband Hysteresis Filter
What this is
This tool builds a “debounced” price baseline that ignores small fluctuations and only reacts when price meaningfully departs from its recent path. It uses a deadband to define how much deviation matters and a hysteresis scheme to avoid rapid flip-flops around the decision boundary. The baseline’s slope provides a simple trend cue, used to color candles and to trigger up and down alerts.
Why deadband and hysteresis help
They filter micro noise so the baseline does not react to every tiny tick.
They stabilize state changes. Hysteresis means the rule to start moving is stricter than the rule to keep holding, which reduces whipsaw.
They produce a stepped, readable path that advances during sustained moves and stays flat during chop.
How it works (conceptual)
At each bar the script maintains a running baseline dbhf and compares it to the input price p .
Compute a base threshold baseTau using the selected mode (ATR, Percent, Ticks, or Points).
Build an enter band tauEnter = baseTau × Enter Mult and an exit band tauExit = baseTau × Exit Mult where typically Exit Mult < Enter Mult .
Let diff = p − dbhf .
If diff > +tauEnter , raise the baseline by response × (diff − tauEnter) .
If diff < −tauEnter , lower the baseline by response × (diff + tauEnter) .
Otherwise, hold the prior value.
Trend state is derived from slope: dbhf > dbhf → up trend, dbhf < dbhf → down trend.
Inputs and what they control
Threshold mode
ATR — baseTau = ATR(atrLen) × atrMult . Adapts to volatility. Useful when regimes change.
Percent — baseTau = |price| × pctThresh% . Scale-free across symbols of different prices.
Ticks — baseTau = syminfo.mintick × tickThresh . Good for futures where tick size matters.
Points — baseTau = ptsThresh . Fixed distance in price units.
Band multipliers and response
Enter Mult — outer band. Price must travel at least this far from the baseline before an update occurs. Larger values reject more noise but increase lag.
Exit Mult — inner band for hysteresis. Keep this smaller than Enter Mult to create a hold zone that resists small re-entries.
Response — step size when outside the enter band. Higher response tracks faster; lower response is smoother.
UI settings
Show Filtered Price — plots the baseline on price.
Paint candles — colors bars by the filtered slope using your long/short colors.
How it can be used
Trend qualifier — take entries only in the direction of the baseline slope and skip trades against it.
Debounced crossovers — use the baseline as a stabilized surrogate for price in moving-average or channel crossover rules.
Trailing logic — trail stops a small distance beyond the baseline so small pullbacks do not eject the trade.
Session aware filtering — widen Enter Mult or switch to ATR mode for volatile sessions; tighten in quiet sessions.
Parameter interactions and tuning
Enter Mult vs Response — both govern sensitivity. If you see too many flips, increase Enter Mult or reduce Response. If turns feel late, do the opposite.
Exit Mult — widening the gap between Enter and Exit expands the hold zone and reduces oscillation around the threshold.
Mode choice — ATR adapts automatically; Percent keeps behavior consistent across instruments; Ticks or Points are useful when you think in fixed increments.
Timeframe coupling — on higher timeframes you can often lower Enter Mult or raise Response because raw noise is already reduced.
Concrete starter recipes
General purpose — ATR mode, atrLen=14 , atrMult=1.0–1.5 , Enter=1.0 , Exit=0.5 , Response=0.20 . Balanced noise rejection and lag.
Choppy range filter — ATR mode, increase atrMult to 2.0, keep Response≈0.15 . Stronger suppression of micro-moves.
Fast intraday — Percent mode, pctThresh=0.1–0.3 , Enter=1.0 , Exit=0.4–0.6 , Response=0.30–0.40 . Quicker turns for scalping.
Futures ticks — Ticks mode, set tickThresh to a few spreads beyond typical noise; start with Enter=1.0 , Exit=0.5 , Response=0.25 .
Strengths
Clear, explainable logic with an explicit noise budget.
Multiple threshold modes so the same tool fits equities, futures, and crypto.
Built-in hysteresis that reduces flip-flop near the boundary.
Slope-based coloring and alerts that make state changes obvious in real time.
Limitations and notes
All filters add lag. Larger thresholds and smaller response trade faster reaction for fewer false turns.
Fixed Points or Ticks can under- or over-filter when volatility regime shifts. ATR adapts, but will also expand bands during spikes.
On extremely choppy symbols, even a well tuned band will step frequently. Widen Enter Mult or reduce Response if needed.
This is a chart study. It does not include commissions, slippage, funding, or gap risks.
Alerts
DBHF Up Slope — baseline turns from down to up on the latest bar.
DBHF Down Slope — baseline turns from up to down on the latest bar.
Implementation details worth knowing
Initialization sets the baseline to the first observed price to avoid a cold-start jump.
Slope is evaluated bar-to-bar. The up and down alerts check for a change of slope rather than raw price crossings.
Candle colors and the baseline plot share the same long/short palette with transparency applied to the line.
Practical workflow
Pick a mode that matches how you think about distance. ATR for volatility aware, Percent for scale-free, Ticks or Points for fixed increments.
Tune Enter Mult until the number of flips feels appropriate for your timeframe.
Set Exit Mult clearly below Enter Mult to create a real hold zone.
Adjust Response last to control “how fast” the baseline chases price once it decides to move.
Final thoughts
Deadband plus hysteresis gives you a principled way to “only care when it matters.” With a sensible threshold and response, the filter yields a stable, low-chop trend cue you can use directly for bias or plug into your own entries, exits, and risk rules.

Smart Money Footprint & Cost Basis Engine [AlgoPoint]Smart Money Footprint & Cost Basis Engine
This indicator is a comprehensive market analysis tool designed to identify the "footprints" of Smart Money (institutions, whales) and pinpoint high-probability reaction zones. Instead of relying on lagging averages, this engine analyzes the very structure of the market to find where large players have shown their hand.
How It Works: The Core Logic
The indicator operates on a multi-stage confirmation process to identify and validate Smart Money zones:
Smart Money Detection (The Trigger): The engine first scans the chart for signs of intense, urgent buying or selling. It does this by identifying Fair Value Gaps (FVGs) created by large, high-volume Displacement Candles. This is our initial Point of Interest (POI).
Cost Basis Calculation (The Average Price): Once a potential Smart Money move is detected, the indicator calculates the Volume-Weighted Average Price (VWAP) for that specific move. This gives us a highly accurate estimate of the average price at which the large players entered their positions.
Historical Confirmation (The "Memory"): This is the indicator's most unique feature. It checks its historical database to see if a similar Smart Money move (in the same direction) has occurred in the same price area in the past. If a match is found, the zone's significance is confirmed.
Verified Cost Basis Zone (The Final Output): A zone that passes all the above checks is drawn on the chart as a high-probability Verified Cost Basis Zone. These are the "memory zones" where the market is likely to react upon a re-visit.
How to Use This Indicator
Cost Basis Zones (The Boxes):
Green Boxes: Bullish zones where Smart Money likely accumulated positions. When the price returns here, a BUY reaction is expected.
Red Boxes: Bearish zones where Smart Money likely distributed positions. When the price returns here, a SELL reaction is expected.
Zone Strength (★★★): Each zone is created with a star rating. More stars indicate a higher-confidence zone (based on factors like volume intensity and historical confirmation).
BUY/SELL Signals: A signal is only generated when the price enters a zone AND the confirmation filters (if enabled in the settings) are passed.
Zone Statuses:
Green/Red: Active and waiting to be tested.
Gray: The zone has been tested, and a signal was produced.
Dark Gray (Invalidated): The zone was broken decisively and is no longer considered valid support/resistance.
Key Settings
Signal Accuracy Filters: You can enable/disable three powerful filters to balance signal quantity and quality:
Momentum Confirmation (Stoch): Waits for momentum to align with the zone's direction.
Candlestick Confirmation (Engulfing): Waits for a strong reversal candle inside the zone.
Lower Timeframe MSS Confirmation: The most advanced filter; waits for a trend shift on a lower timeframe before giving a signal.
Historical Confirmation:
Require Historical Confirmation: Toggle the "Memory" feature on/off. Turn it off to see all potential SM zones.
Tolerance Calculation Method: Choose between a dynamic ATR Multiplier (recommended for all-around use) or a fixed Percentage to define the zone size.

Reverse RSI Signals [AlgoAlpha]🟠 OVERVIEW
This script introduces the Reverse RSI Signals system, an original approach that inverts traditional RSI values back into price levels and then overlays them directly on the chart as dynamic bands. Instead of showing RSI in a subwindow, the script calculates the exact price thresholds that correspond to common RSI levels (30/70/50) and displays them as upper, lower, and midline bands. These are further enhanced with an adaptive Supertrend filter and divergence detection, allowing traders to see overbought/oversold zones translated into actionable price ranges and trend signals. The script combines concepts of RSI inversion, volatility envelopes, and divergence tracking to provide a context-driven tool for spotting reversals and regime shifts.
🟠 CONCEPTS
The script relies on inverting RSI math: by solving for the price that would yield a given RSI level, it generates real chart levels tied to oscillator conditions. These RSI-derived price bands act like support/resistance, adapting each bar as RSI changes. On top of this, a Supertrend built around the RSI midline introduces directional bias, switching regimes when the midline is breached. Regular bullish and bearish divergences are detected by comparing RSI pivots against price pivots, highlighting early reversal conditions. This layered approach means the indicator is not just RSI on price but a hybrid of oscillator translation, volatility-tracking midline envelopes, and divergence analysis.
🟠 FEATURES
Inverted RSI bands: upper (70), lower (30), and midline (50), smoothed with EMA for noise reduction.
Supertrend overlay on the RSI midline to confirm regime direction (bullish or bearish).
Gradient-filled zones between outer and inner RSI bands to visualize proximity and exhaustion.
Non-repainting bullish and bearish divergence markers plotted directly on chart highs/lows.
🟠 USAGE
Apply the indicator to any chart and use the plotted RSI price bands as adaptive support/resistance. The midline defines equilibrium, while upper and lower bands represent classic RSI thresholds translated into real price action. In bullish regimes (green candles), long trades are stronger when price approaches or bounces from the lower band; in bearish regimes (red candles), shorts are favored near the upper band. Divergence markers (▲ for bullish, ▼ for bearish) flag potential reversal points early. Traders can combine the band proximity, divergence alerts, and Supertrend context to time entries, exits, or to refine ongoing trend trades. Adjust smoothing and Supertrend ATR settings to match the volatility of the instrument being analyzed.

Trendlines Oscillator [LuxAlgo]The Trendlines Oscillator helps traders identify trends and momentum based on the normalized distances between the current price and the most recently detected bullish and bearish trend lines.
The indicator features bullish and bearish momentum, a signal line with crossings, and multiple smoothing options.
🔶 USAGE
The indicator displays three lines: two for momentum and one for the signal. When one of the momentum lines (bullish or bearish) crosses the signal line, the tool displays a dot to indicate which momentum is gaining strength.
As a general rule, when the green bullish momentum line is above the red bearish momentum line, it indicates buyer strength. This means that the actual prices are farther from the support trend lines than the resistance trend lines. The opposite is true for seller strength.
To calculate bullish momentum, the tool first identifies bullish trend lines acting as support below the price. Then, it measures the delta between the price and those trend lines and normalizes the reading into the displayed momentum values.
The same process is used for bearish momentum, but with bearish trendlines acting as resistance above the price.
🔹 Length & Memory
Modifying the Length and Memory values will cause the tool to display different momentum values.
Traders can adjust the length to detect larger trendlines and adjust the memory to indicate how many trendlines the tool should consider.
As the chart above shows, smaller values make the tool more responsive, while larger values are useful for detecting larger trends.
🔹 Smoothing
By default, the data is not smoothed, and the signal uses a triangular moving average with a length of 10. Traders can smooth both the data and the signal line.
Traders can choose from up to ten different methods, or none. Some examples are shown on the chart above.
🔶 DETAILS
The steps for the calculations are as follows:
1. Gather the pivots, highs, and lows.
ph = fixnan(ta.pivothigh(lengthInput, lengthInput))
pl = fixnan(ta.pivotlow(lengthInput, lengthInput))
2. Calculate the slope and y-intercept for each trendline between contiguous lower highs (resistance) or higher lows (support).
if ph < ph
slope = (ph - ph )/(n-lengthInput - phx1)
res.unshift(l.new(ph - slope * phx1, slope))
if pl > pl
slope = (pl - pl )/(n-lengthInput - plx1)
sup.unshift(l.new(pl - slope * plx1, slope))
3. Calculate the value of each trendline on the current bar, then calculate the difference with the current price (delta). To calculate the relative sum of deltas, only consider trendlines below the price for support or above the price for resistance.
method get_point(l id, x)=>
id.slope * x + id.intercept
for element in sup
point = element.get_point(n)
if sourceInput > point
sup_sum += sourceInput - point
sup_den += math.abs(sourceInput - point)
for element in res
point = element.get_point(n)
if sourceInput < point
res_sum += point - sourceInput
res_den += math.abs(point - sourceInput)
4. Normalize the value from 0 to 100 by taking the sum of the relative values of the deltas divided by the sum of the absolute values of the deltas.
float supportLine = sup_sum / sup_den * 100
float resistanceLine = res_sum / res_den * 100
5. Smooth both values, then calculate the signal line as the difference between them.
float smoothSupport = smooth(supportLine,dataSmoothingInput,dataSmoothingLengthInput)
float smoothResistance = smooth(resistanceLine,dataSmoothingInput,dataSmoothingLengthInput)
float signal = math.abs(smoothSupport - smoothResistance)
float signalLine = smooth(signal,smoothingInput,smoothingLengthInput)
6. Calculate the crossing signals against the signal line, using only the first signal from each series of bullish or bearish crossings.
bullSignal = smoothSupport > signalLine and smoothSupport < signalLine
bearSignal = smoothResistance > signalLine and smoothResistance < signalLine
lastSignal := bullSignal and lastSignal == BEAR ? BULL : bearSignal and lastSignal == BULL ? BEAR : lastSignal
firstBull = ta.change(lastSignal) > 0
firstBear = ta.change(lastSignal) < 0
🔶 SETTINGS
Length: The size of the market structure used for trendline detection.
Memory: The number of trendlines used in calculations.
Source: The source for the calculations is closing prices by default.
🔹 Smoothing
Data Smoothing: Choose the smoothing method and length
Signal Smoothing: Choose the smoothing method and length

SD Bands Filtered Signals### SD Bands Filtered Signals: Reversion & Volatility Scanner
**Core Description:**
The SD Bands Filtered Signals is a tool developed to help traders identify more accurate buy and sell signals in sideways markets, or during periods of low price movement. It utilizes the principles of Standard Deviation (SD) and a Moving Average (MA), with a unique 'signal filtering' system added to reduce unnecessary noise.
**Key Features:**
* **SD Bands:** Creates upper and lower bands to define price volatility zones, providing a clear overview of market conditions.
* **Intelligent Reversal Signals:** Generates specially filtered Buy/Sell signals for a 'Reversion to the Mean' strategy. These signals appear only when the market has low volatility and the price touches the SD Bands.
* **Advanced Signal Filtering System:** Uses a **`Cooldown Bars`** variable to set a rest period between signals. This prevents repetitive arrows in the same zone, helping you find the best signal at the most suitable point.
* **Fully Customizable:** You can adjust the **`Length`**, **`Multiplier`**, **`Sideways Threshold`**, and **`Cooldown Bars`** to fit your trading style and asset of choice.
**How to Use:**
* **Buy Signal (Green Arrow Up):** Look for this signal when the market is sideways and the price moves down to touch the lower band (SD Low).
* **Sell Signal (Red Arrow Down):** Look for this signal when the market is sideways and the price moves up to touch the upper band (SD High).
* **Customization:** You can adjust the **`Cooldown Bars`** value to control the number of arrows. If you want more accurate but fewer signals, increase this value.
**Disclaimer:**
* This indicator is an **analytical tool only** and is not a 100% guarantee of profit.
* It should be used in conjunction with other forms of analysis, such as candlestick patterns, trading volume, and proper risk management.
ไทย
ชื่ออินดิเคเตอร์ "SD Bands Filtered Signals: Reversion & Volatility Scanner"
คำอธิบายหลัก:
อินดิเคเตอร์ SD Bands Filtered Signals เป็นเครื่องมือที่ถูกพัฒนาขึ้นเพื่อช่วยให้นักเทรดสามารถระบุสัญญาณซื้อ (Buy) และขาย (Sell) ที่แม่นยำขึ้นในตลาดแบบ Sideways หรือช่วงที่ราคาเคลื่อนที่ในกรอบแคบๆ โดยใช้หลักการของ Standard Deviation (SD) และ Moving Average (MA) และเพิ่มระบบ 'กรองสัญญาณ' ที่เป็นเอกลักษณ์เพื่อลดสัญญาณรบกวน (Noise) ที่ไม่จำเป็นออกไป
คุณสมบัติเด่น:
* SD Bands: สร้างเส้นขอบบนและล่างเพื่อระบุโซนความผันผวนของราคา ทำให้เห็นภาพรวมของตลาดได้ง่าย
* สัญญาณ Reversal อัจฉริยะ: สร้างสัญญาณ Buy/Sell ที่ถูกคัดกรองมาเป็นพิเศษสำหรับกลยุทธ์การกลับตัว (Reversion to the Mean) โดยจะปรากฏเฉพาะเมื่อตลาดมีความผันผวนต่ำและราคาแตะขอบของ SD Bands
* ระบบกรองสัญญาณขั้นสูง: ใช้ตัวแปร Cooldown Bars เพื่อกำหนดระยะเวลาพักสัญญาณ ทำให้ไม่เกิดลูกศรซ้ำๆ ในโซนเดียวกัน และช่วยให้คุณได้สัญญาณที่ดีที่สุดในจุดที่เหมาะสมที่สุด
* ปรับแต่งได้เต็มที่: คุณสามารถปรับค่า Length, Multiplier, Sideways Threshold และ Cooldown Bars เพื่อให้เข้ากับสไตล์การเทรดและคู่สินทรัพย์ที่คุณสนใจ
วิธีการใช้งาน:
* สัญญาณ Buy (ลูกศรสีเขียวขึ้น): มองหาสัญญาณนี้เมื่อตลาดอยู่ในช่วง Sideways และราคาวิ่งลงมาแตะเส้นขอบล่าง (SD Low)
* สัญญาณ Sell (ลูกศรสีแดงลง): มองหาสัญญาณนี้เมื่อตลาดอยู่ในช่วง Sideways และราคาวิ่งขึ้นไปแตะเส้นขอบบน (SD High)
* การปรับแต่ง: คุณสามารถปรับค่า Cooldown Bars เพื่อให้ได้จำนวนลูกศรที่ต้องการ หากต้องการสัญญาณที่แม่นยำขึ้นแต่จำนวนน้อยลง ให้เพิ่มค่านี้ให้สูงขึ้น
ข้อควรระวัง:
* อินดิเคเตอร์นี้เป็นเพียงเครื่องมือวิเคราะห์ ไม่ใช่สัญญาณที่การันตีผลกำไร 100%
* ควรใช้ประกอบกับการวิเคราะห์อื่นๆ เช่น รูปแบบแท่งเทียน, ปริมาณการซื้อขาย (Volume) และการจัดการความเสี่ยงที่เหมาะสม

DAX Inducere Simplă v1.3 – Confirmare InducereDAX Inducere Simplă v1.3 – Confirmare Inducere ,signals before fvg mss and displacement
