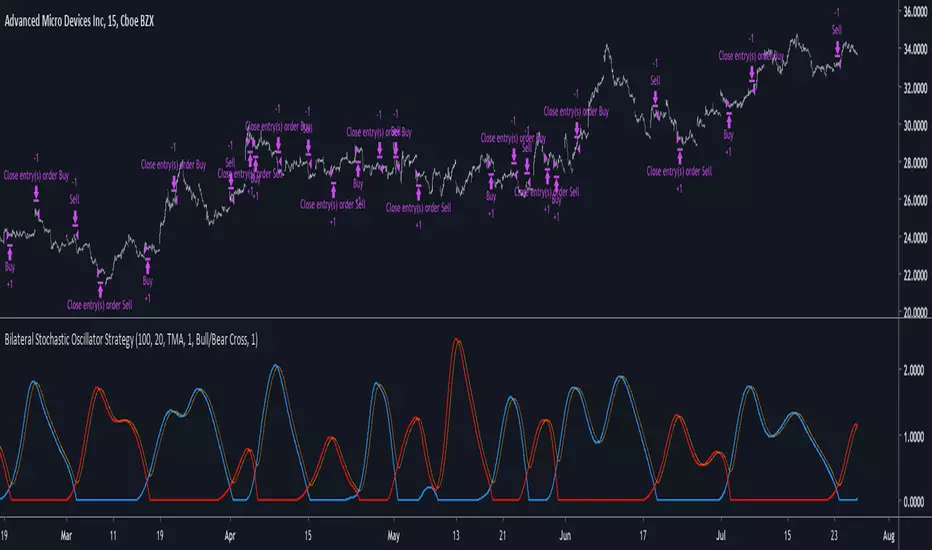
Bilateral Stochastic Oscillator StrategyIntroduction
Strategy based on the bilateral stochastic oscillator, this oscillator aim to detect trends and possible reversal points of the current trend. The oscillator is composed of 1 bull line in blue and 1 bear line in red as well as a signal line in orange, the strategy have many options such as two different strategy framework and a martingale mode. If you require more information about the indicator go check it into my uploaded indicators.
Strategy Frameworks
There are two frameworks available that can be selected from the strategy settings window. Both have the same closing conditions, the "Bull/Bear Cross" entry conditions are :
Buy : when the bull line cross over the bear line
Sell : when the bear line cross over the bull line
The "Signal Cross" entry conditions are :
Buy : when the bull line cross over the signal line
Sell : when the bear line cross over the signal line
Both have the same close conditions that is : close when bull/bear cross under the signal line.
Introduction To Martingale
The martingale money management system consist to double the order size after a loosing trade and can be described as a 2^x where x is the current number of loosing trades since the last win trade, when we win a trade the order size return to the default order size. Therefore our order size function is based on exponential growth.
This system enable the trader to win back his previous losses plus a potential profit, martingales must always be used with stops and sometimes take profits in order to get control in a strategy.
It must always be taken into account that in a series of losses the balance can exponentially decay thus ending to 0 in a matter of trades, this is why it is not recommended to use such system. The strategy allow you to select a martingale multiplier that can be inferior to 2 thus limiting risks, a multiplied of 1 disable the martingale.
Results
Those are the some statistics of the strategy applied to some forex majors by using the default settings in a time frames of 15 minutes.
//-------------------------------------------------------
EURUSD - Order Size 1000 - Spread 0.0002
Profit : $ 21.08
Trades : 19
PP : 57.89 %
Profit Factor : 3.228
Max Drawdown : -$ 3.81
Average Trade : $ 1.11
//-------------------------------------------------------
GBPUSD - Order Size 1000 - Spread 0.0002
Profit : $ 2.31
Trades : 20
PP : 55 %
Profit Factor : 0.938
Max Drawdown : -$ 20.29
Average Trade : $ 0.12
//-------------------------------------------------------
EURAUD - Order Size 1000 - Spread 0.0002
Profit : -$ 9.22
Trades : 20
PP : 40 %
Profit Factor : 0.698
Max Drawdown : -$ 23.44
Average Trade : $ 0.46
//-------------------------------------------------------
EURCHF - Order Size 1000 - Spread 0.0002
Profit : $ 1.58
Trades : 24
PP : 54.17 %
Profit Factor : 1.103
Max Drawdown : -$ 7.23
Average Trade : $ 0.07
//-------------------------------------------------------
Conclusions
Based on the results the strategy does not posses the sufficient performance in order to apply a martingale or any other growth systems as order size. Parameters might be subject to drastic changes depending on the market/time-frame in order to return long-term positive results. I let you draw your conclusions.
Strategy

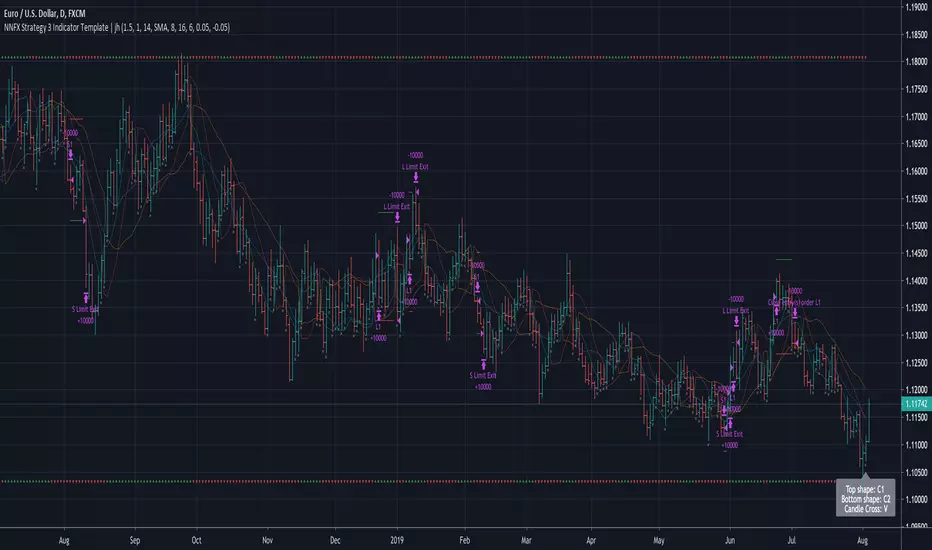
No Nonsense NNFX VP Strategy for Back Testing 3 x Indicators| jhAfter testing your individual indicators, it's time to build up your algo with additional indicators and further backtest the strategy.
Using SSL twice here, faster SSL for 1st confirmation, slower SSL for 2nd confirmation and TDFI for volume validation.
No Nonsense NNFX VP Strategy for Back Testing Indicators| jhAfter putting the whole system together, sat down to benchmark the various confirmation indicators, shrink it down to backtest individual confirmation indicators.
Results for 24 periods way better than 10, then again it's only one pair. :)
More details below.
//////////////////////////////////////////////////////////////////////////////////////////////////////////////////////////////////
//Designed per No Nonsense Forex VP rules
//For testing your individual indicators before the full system
//Originated from causecelebre
//Tried to put in as much VP rules as possible
///////////////////////////////////////////////////
//Rules Implemented:
///////////////////////////////////////////////////
// - SL 1.5 x ATR
// - TP 1 x ATR
//
// - Entry conditions
//// - Entry from 1 x confirmation
// - Exit conditions
//// - Exit on confirmation flip
///////////////////////////////////////////////////
//Trades entries
///////////////////////////////////////////////////
// - First entry L1 or S1 with standard SL and TP
///////////////////////////////////////////////////
//Included Indicators and settings
///////////////////////////////////////////////////
// - Confirmtion = SSL 10
///////////////////////////////////////////////////
//Credits
// Strategy causecelebre www.tradingview.com
// SSL Channel ErwinBeckers www.tradingview.com
//////////////////////////////////////////////////////////////////////////////////////////////////////////////////////////////////
//Change log
//First release. Testing of indicators
//////////////////////////////////////////////////////////////////////////////////////////////////////////////////////////////////

SlingShotStrategyBased on an existing SlingShotStrategy. Added the ability to set capital, and order limit in settings.. Back Testing is great. Plan to improve more, let me know what you think.
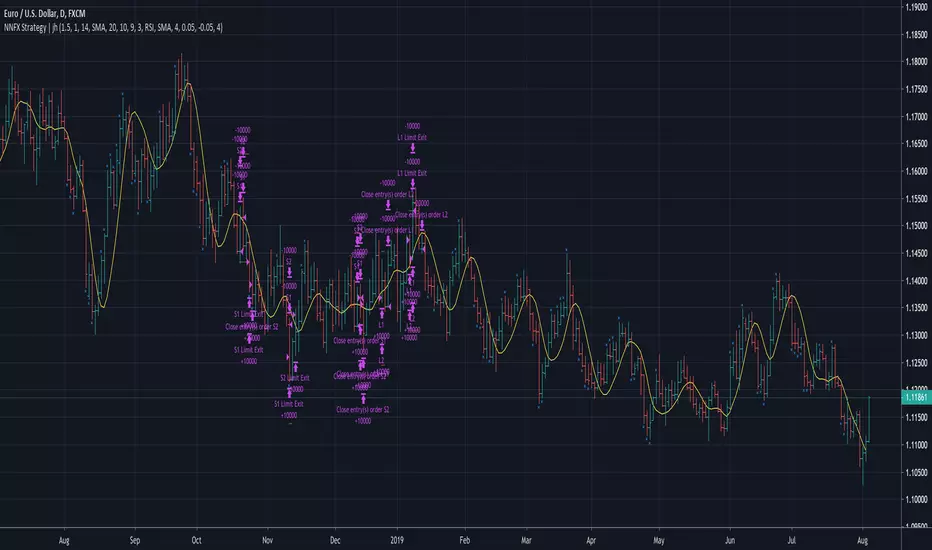
No Nonsense NNFX VP Strategy for Back Testing | jhMy first script, be kind :)
Most of the rules are implemented:
- Money management
- ATR, Baseline, Confirmation, Volume, Exit
More details below.
//////////////////////////////////////////////////////////////////////////////////////////////////////////////////////////////////
//////////////////////////////////////////////////////////////////////////////////////////////////////////////////////////////////
//Designed per No Nonsense Forex VP rules
//Made to be as modular as possible, so we can swap the indicators in and out.
//Originated from causecelebre
//Tried to put in as much VP rules as possible
///////////////////////////////////////////////////
//Rules Implemented:
///////////////////////////////////////////////////
// - SL 1.5 x ATR
// - TP 1 x ATR
//
// - Entry conditions
//// - Entry within 1 candles of baseline + 1 x confirmation + volume
//// - Entry only if baseline is < 1 x ATR
// - Exit conditions
//// - Exit on exit indicator or when baseline or confirmation flip
///////////////////////////////////////////////////
//Trades entries
///////////////////////////////////////////////////
// - First entry L1 or S1 with standard SL and TP
// - Second entry L2 or S2 with standard SL and exit upon the exit conditions
///////////////////////////////////////////////////
//Included Indicators and settings
///////////////////////////////////////////////////
// - Baseline = HMA 20
// - Confirmtion = SSL 10
// - Volume = TDFI 4
// - Exit = RVI 4
///////////////////////////////////////////////////
//Credits
// Strategy causecelebre
// TDFI causecelebre
// SSL Channel ErwinBeckers
//////////////////////////////////////////////////////////////////////////////////////////////////////////////////////////////////
//////////////////////////////////////////////////////////////////////////////////////////////////////////////////////////////////
Kijun-Sen Strategy [DasanC]This strategy employs the Kijun-Sen line (from Ichimoku cloud) as a baseline for decisions.
In essence, the Kijun-Sen is a kind of moving average based on the High/Low range, similar to Donchian channels.
We wait for a crossover or crossunder to enter a new trade, then exit upon the next cross.
It works on 1H timeframe and above. It also works for all the Major FX pairs (at least from my tests).
I use the ATR and a multiplier to decide the S/L position as well as the volume of the trade.
I also use an equity protector to close out of all trades if a specific DD % level is reached. In theory, this should never happen with only one trade open at a time, however, if a user wants to modify the script to pyramid orders then the equity protector could potentially "save" an account.
The default settings should produce winning results on Major pairs. You can change the backtest time in the script by altering line #53:
>if(time > timestamp(2017,1,1,0,0) and time < timestamp(2019,1,1,0,0))
TODO:
Add 2 additional forms of confirmation
Add volume to filter losing trades
Add exit indicator

MACD Strategy by ForbesStrategy นี้เขียนขึ้นมาจากบทความของนิตยสารธุรกิจ ชื่อดัง Forbes
สำหรับผู้ที่อยากอ่านสามารถค้นหาได้โดยใช้คำค้นว่า Bitcoin Trading Strategy For Passive Investors
สำหรับผู้ทีจะทอสอบ backtest ให้ตั้งค่า commission (หรือค่าธรรมเนียมการเทรดด้วย) เพื่อให้ผลลัพท์ใกล้เคียงกับความเป็นจริงมากที่สุด
อย่างไรก็ตามจากการ backtest นั้น พบว่า Strategy นี้เหมาะกับ Timeframe Day มากที่สุด และโดยส่วนตัวคิดว่าเหมาะสำหรับการซื้อขายแบบ Spot เท่านั้น

Ema BacktesterA simple, but useful script for backtesting purposes. Find the optimal Settings for your strategy.
tips are always welcome at: 38uGQJDDZDL6wX48x4gYTccPeQ3ZHVYmY4 (btc)
I hope you enjoy the script :)

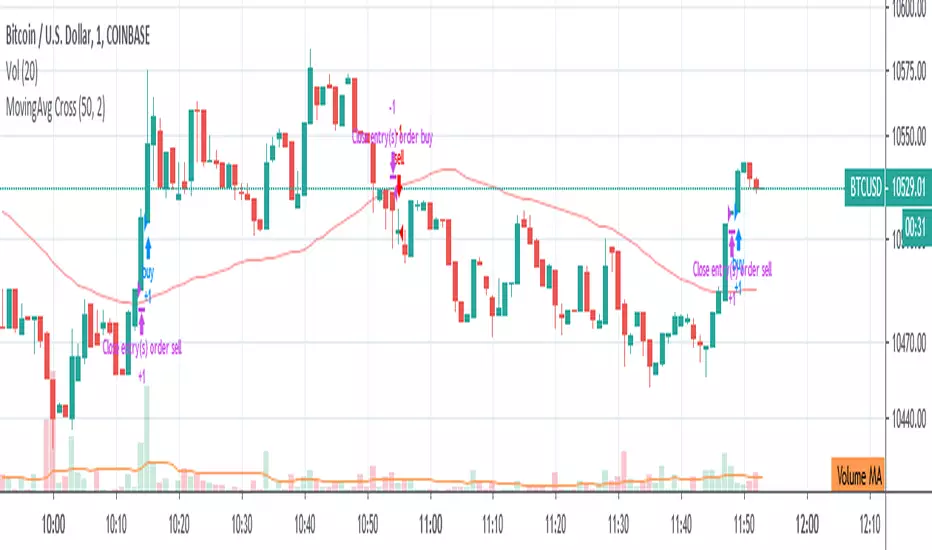
Moving Average Strategy of BiznesFilosofWhat is brilliant is simple! Therefore, this strategy works very well. It is configured on bitcoin. But you can use it for other tools. Only need to change the settings.
Remember that this is not a panacea, but only an assistant! You yourself have to choose which entry and exit points to choose.
In more detail about strategy on my channel in YouTube.
===
Что гениально, то просто! Потому, эта стратегия очень хорошо работает. Настроена она на биткоин. Но можно использовать и для других инструментов. Только нужно поменять настройки.
Помните, что это не панацея, а только помощник! Вы сами должны панимать, какие выбирать точки входа и выхода.
Более подробно про стратегию на моём канале в Ютуб.

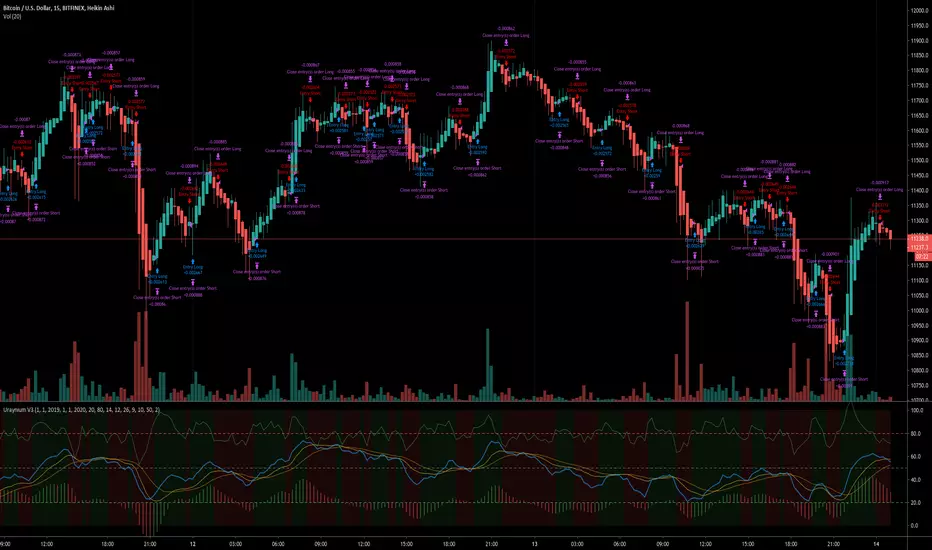
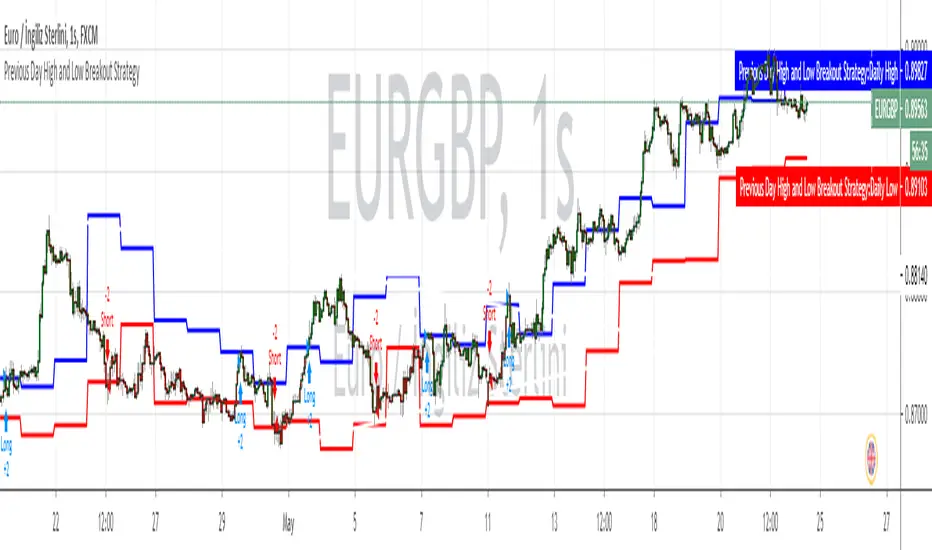
Peak Valley Estimation StrategyIntroduction
Its the first strategy that i post here, so don't expect ground breaking stuff, when testing my indicators i always used prorealtime and not tradingview. This strategy use signals generated by the peak/valley estimator indicator i posted long ago, i think the signals generated where sometimes quite accurate in some markets thus providing potential material for a profitable strategy.
The indicator use 3 parameters, therefore the optimisation process is not easy, but i selected what i judged good parameters values at first glance. The strategy is in its more simple form without stop or anything, the detection of peaks and valley can allow for tighter stops since we expect the price to reverse, but take into account that sops and take profits are parameters subject to optimization process except if selected with strict money management rules and not profit optimization.
Of course trading the strategy in this form is far from being great, if we take into account the market non stationarity then we might expect loss during trending markets. Trend strength indicators could help switch from a reversal to breakout strategy thus maybe providing more control.
I really hope you find an use for the strategy.
Notes
Its been three long years since i started tradingview, and i put more efforts in my indicators than in my studies and life overall, this have created complicated situations and i can't afford to follow up with this, therefore i announce that in the end of june i will leave tradingview for quite a long time, at least until i have my degree. I announce it in advance in case some of you want helps of any kind. I will post all the indicators, both in progress and finished i have made during those three years. I hope you can all understand.
Thanks for reading !

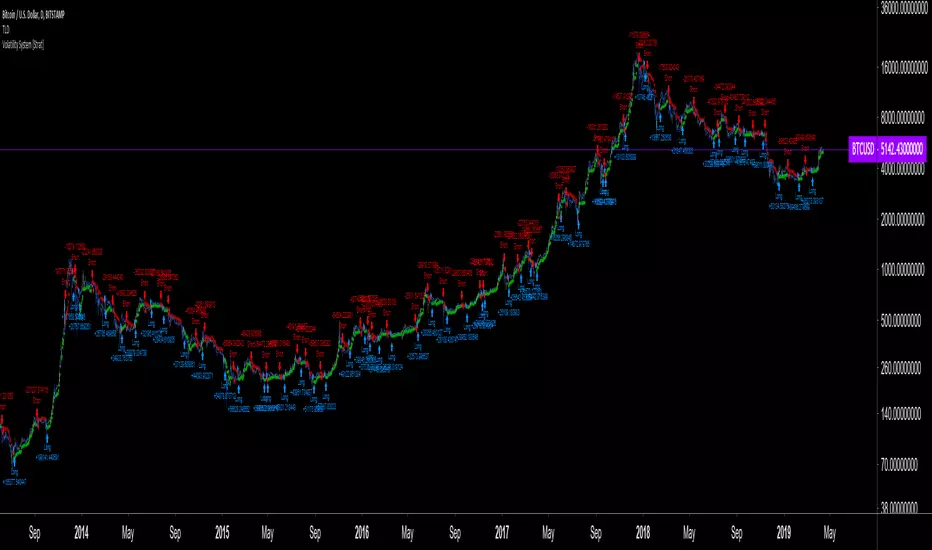
Volatility System by Wilder [LucF]The Volatility System was created by J. Welles Wilder, Jr. It first appeared in his seminal masterpiece, "New Concepts in Technical Trading Systems" (1978). He describes the system on pp.23-26, in the chapter discussing the first presentation ever of the "Volatility Index", built using a novel way of calculating a value representing volatility that he named Average True Range (ATR). The latter stuck.
The system is a pure reversal system (it is always either long or short). One of its characteristics is that its stop strategy moves up and down during a trade, widening the gap from price when volatility (ATR) increases. Because of this, this strategy can suffer large drawdowns and is not for the faint of heart.
The strategy uses a length (n) to calculate an ATR. ATR(n) is then multiplied by a factor to calculate the Average Range Constant (ARC). The ARC is then added to the lowest close n bars back to form the high Stop and Reverse points (SAR), and subtracted from the highest close n bars back to calculate the low SAR. Reversals occur when price closes above the high SAR or below the low SAR.
The system is best suited to higher time frames: 12H and above. Its performance depends heavily on calibration of the length and ARC factor. Wilder proposes a length of 7 and a factor between 2.8 to 3.1. My summary tests at 12H, 1D and 3D on stocks and cryptos yield better results with values of approximately 9-10/1.8-2.5 for cryptos and 9-10/3.0-4.0 for stocks. Small changes in the values will sometimes yield large variations in results, which I don’t particularly like because it tends to imply fragility, whereas I’d expect more robustness from a system with such simple rules. Additionally, backtests at 1D on cryptos provide so little data that no solid conclusions can be drawn from them.
All in all, the system is not very useful in my opinion; I publish it more for completeness, since as far as I can tell, it did not exist on this platform before. I also publish it out of respect for Wilder’s work. His book laid the foundation for many of the building blocks used by system designers, even today. In less than a hundred pages he presented RSI, ATR, DMI, ADXR and the Parabolic SAR indicators, some of which have become built-in functions in programming languages. This is a colossal feat and has not been repeated. Wilder is a monument.
Some lesser-known facts about his book:
It sells for the exact same price it cost in 1978: 65$,
The book has always been published by Wilder himself,
The layout hasn’t changed in 40 years,
He sells >35K copies/year.
Gotta love the guy.
The strategy is shown here on BTC /USD with settings of 12/1.8 (the defaults are 9/1.8). It shows the system under its best light. Other markets will most not reproduce such results. Also, the drawdown is as scary as the results are impressive.
Features
The code is written as a strategy but can easily be converted to an indicator if you want to use the alerts it can produce. Instructions are in the code.
You can change the length and ARC factor.
You can choose to trade only long or short positions.
You can choose to display the SARs (the stops) in multiple ways.
You can show trigger markers.
A date range can be defined.
3 alerts: reversals (both long and short), longs, shorts. Remember that for the moment, strategies cannot generate alerts in TradingView, so the strategy must be converted to an indicator in order to make the alerts available.
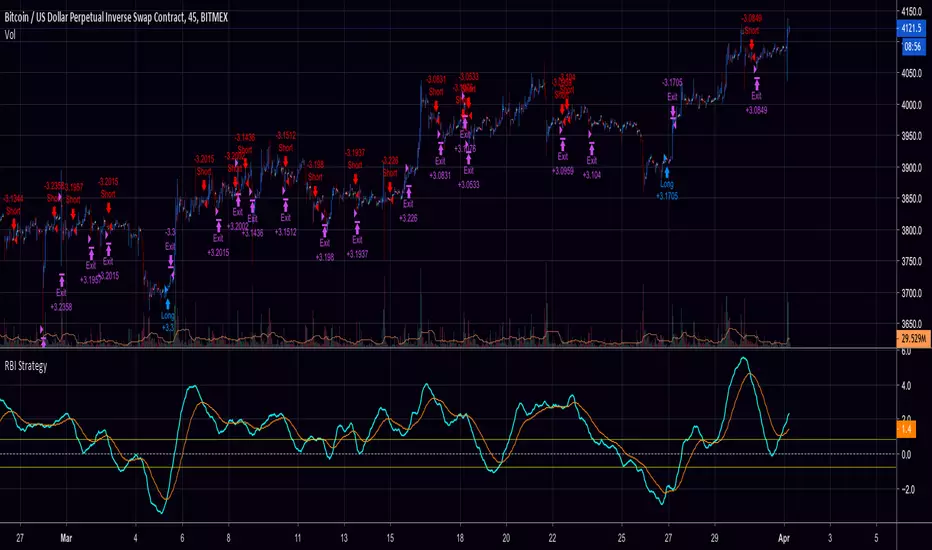
RBI Strategy /w TSSLThis is the Strategy with Backtest Date Range and Trailing Stop / Stop-Loss to vitelot's RBI indicator:
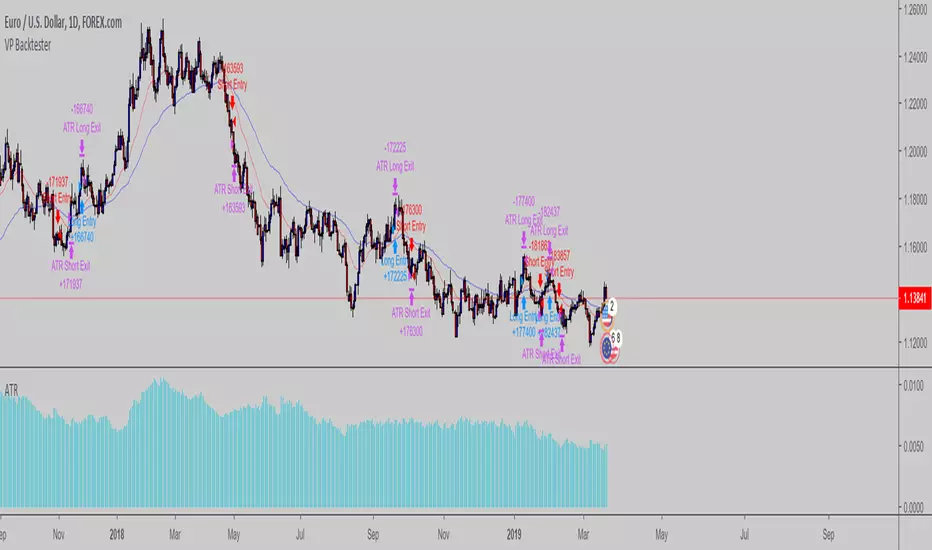
VP Backtester skeletonSimple backtesting skeleton script which uses ATR based stop & profit targets based on the no-nonsense forex way of trading
Fisher Transform Multi-Timeframe (Backtest)This is the Backtest Strategy for mortdiggiddy's "Fisher Transform Multi-Timeframe"
For more details check his study:

Ichimoku trendfollowingIchimoku più che un indicatore potrebbe essere considerato un sistema di trading.
Ho quindi voluto implementare una strategia che utilizzasse soltanto i segnali che offre per l'ingresso ed uscita per verificarne l'efficacia nel lungo periodo su i diversi strumenti.
I segnali che offre sono i seguenti:
1) il prezzo taglia la tenkan (segnale molto debole per un ingresso)
2) il prezzo taglia la kijun (possibile trade in controtrend fino alla kumo)
3) tenkan incrocia la linea kijun
4) uscita della linea chikou span dal prezzo: se la linea è sotto il prezzo valutare solo short, se sopra valutare solo long, se sopra il prezzo si è in correzione ed è meglio restare flat
5) prezzo entra dentro la kumo. (Non si entra in posizione dentro la kuno)
6) la kumo cambia colore (conferma direzione del trend in atto)
7) uscita dal prezzo dalla kumo
8) uscita della tenkan dalla kumo (conferma situazione)
9) uscita kijun dalla kumo (conferma situazione)
10) trend in corso con chiusura del prezzo fra la chikou span da una parte, tenkan, kijun e kumo dall'altra.
Ichimoku è solitamente utilizzato come sistema trendfollowing, quindi considererò solo i segenti possibili ingressi:
1) breakout kumo (inizio trend di lungo periodo)
2) pullback (inizio trend di medio periodo o ripresa trend dopo correzione profonda con pullback su kumo)
le uscite tradizionali sono:
1) prezzo chiude sotto la kijun
2) SL inizialmente su minimo candela che rompe il livello
Filtri da applicare ai singoli ingressi:
Filtro long:
Close>kumo and chikou span > prezzo corrispondente and
Filtro short
Close

Candlestick Signals StrategyThis strategy allows you to pick from 9 different candlestick patterns, and test them against historical data from your chart. You can get a good idea what patterns work best for each chart by turning each pattern on and off in the settings.

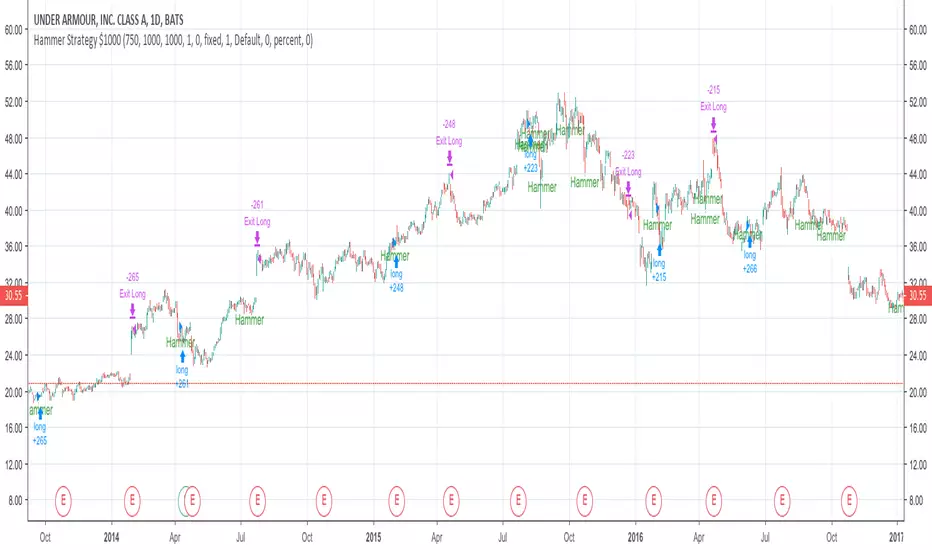
Basic Hammer StrategyThis is a basic strategy that will buy after a hammer is printed, and sell when a predetermined risk or reward price is hit. You can change the risk and reward values in the settings. Risk and reward values are in increments of $0.01. Default values are 75 ($0.75) and 200 ($2.00). If the strategy is producing losses, try adding a zero to the end of the risk value and the reward value. Example: Higher valued stocks may do better with a Risk of 750 ($7.50) and a Reward of 2000 ($20.00). Maybe even a Risk of 750 ($7.50) and reward of 1000 ($10.00). Play around with these values to get the best result for different charts. Initial investment is set to $1000
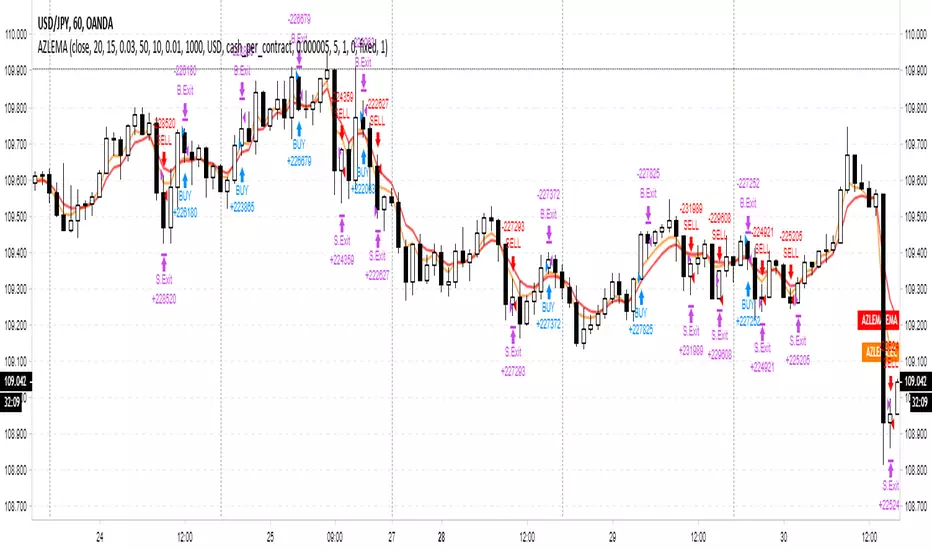
Adaptive Zero Lag EMA Strategy [Ehlers + Ric]Behold! A strategy that makes use of Ehlers research into the field of signal processing and wins so consistently, on multiple time frames AND on multiple currency pairs.
The Adaptive Zero Lag EMA (AZLEMA) is based on an informative report by Ehlers and Ric .
I've modified it by using Cosine IFM, a method by Ehlers on determining the dominant cycle period without using fast-Fourier transforms
Instead, we use some basic differential equations that are simplified to approximate the cycle period over a 100 bar sample size.
The settings for this strategy allow you to scalp or swing trade! High versatility!
Since this strategy is frequency based, you can run it on any timeframe (M1 is untested) and even have the option of using adaptive settings for a best-fit.
>Settings
Source : Choose the value for calculations (close, open, high + low / 2, etc...)
Period : Choose the dominant cycle for the ZLEMA (typically under 100)
Adaptive? : Allow the strategy to continuously update the Period for you (disables Period setting)
Gain Limit : Higher = faster response. Lower = smoother response. See for more information.
Threshold : Provides a bit more control over entering a trade. Lower = less selective. Higher = More selective. (range from 0 to 1)
SL Points : Stop Poss level in points (10 points = 1 pip)
TP Points : Take Profit level in points
Risk : Percent of current balance to risk on each trade (0.01 = 1%)
www.mesasoftware.com
www.jamesgoulding.com(Measuring%20Cycles).doc