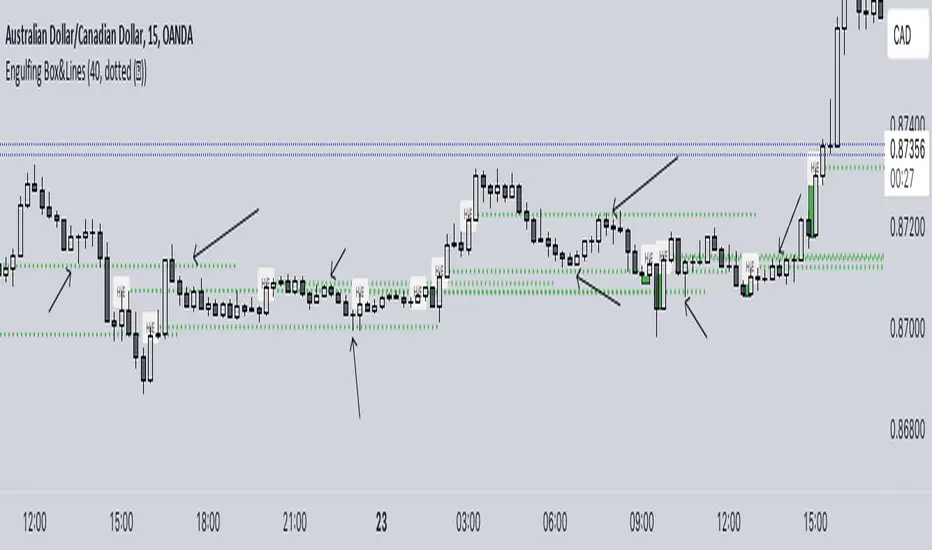
Gridimus Maximus draws N grid lines stepping by price or percent in chosen direction from set price, or draws N grid lines stepping by pivots. The queue function method used is adapted from an example provided on the PineCoders website, much gratitude to LucF for this gem! To prevent grid lines out of range from causing chart to rescale right click on chart's...
The SMA 200 is one of the most important and strongest support/resistance lines on any timeframe. This script pulls the SMA 200 line from multiple timeframes so traders can visually see price action bounce between support and resistance . The current timeframes SMA 200 is displayed in white and turns yellow to signify "pressure". Can be used on higher timeframes...
A new indicator for tradingview. Indicator Overview The 2-Year MA Multiplier is intended to be used as a long term investment tool. It highlights periods where buying or selling Bitcoin during those times would have produced outsized returns. To do this, it uses a moving average (MA) line, the 2yr MA, and also a multiplication of that moving average line, 2yr...
The EMA 730 line is a great way to show dynamic support and resistance . Price action travels "through" this line on each timeframe. This script pulls the EMA 730 Line from multiple timeframes so a trader can visually see price action bounce between support and resistance lines. Lower bands (white lines) can be turned off using "tickbox" in settings. EMA length...
EMA Bands for crypto markets shows support and resistance lines. Helps identify bull and bear market trends. SMA200 is white and turns yellow to signal pressure. Can also be useful for identifying Elliot waves and breakouts.
Alchemist Capital Lazy Zones is a script written to complement the trading style taught by @clover_trading - Chris teaches a zone to zone strategy and this script aids in the technical analysis relating to this. This indicator has been tested and coded with Forex pairs in mind, as such its functionality and usefulness on other assets cannot be guaranteed. The...
Usually, Moving Averages (Simple & Exponential) consider "close" of each candle to form a line for a particular period. In this indicator, we have considered all the parameters (Open, Close, Low & High) of each candle to form a Band or a wave which act as a zone to provide support & resistance. It works well on all the time frames. It perfectly works on lower time...
Sup/Res can display up to ten different lines of supports and resistance. It’s super reliable and ultra-customizable. You won’t have to draw them yourself anymore. It’s more accurate and time-saving. Also, the indicator calculates in real-time the distance in % from the market price to the lines. The indicator is perfect if you need to define your price limits...
Hello everyone, I was having some fun with the new gradient function, arrays and pivots. Decided that i would publish my little playground :) This script basically draws lines or zones for detected pivot high and lows and counts the number of candles those levels have been untested. Tested levels will stop at the candle, which breaks them. How does it work? -...
Initial Balance indicator plots the high and low of the first hour of US Futures Market session. Very useful for trading breakouts after market open. Also added range midline and background shading to identify first hour. Times are adjustable. All objects can be modified.
A simple script that allows you to plot 8 different zones of support and resistance. Enter the high and low of a support/resistance zone, and the script will fill the range for easier viewing. Open source and all settings can be customized.
The Dynamic Support And Resistance Indicator was created by Mike Siroky (Stocks and Commodities pgs 14-18) and this is a handy indicator that will show you useful support and resistance levels no matter how the stock is doing right now. I have color coded the middle line to show buy and sell signals so buy when the line turns green and sell when it turns red. Let...
This script will help you to plot support and resistance for the day at the first min of the opening of the market. The accuracy of these levels are more than 96% which means you will know the top and bottom well in advance.
Projected Support And Resistance is a custom indicator of mine loosely based on the work done by Ketan Asher (Stocks and Commodities Bonus Issue 2021 pgs 12-14) and generally speaking this does a pretty good job of telling you what the future behavior of the stock will be. As the lines widen apart, there will be either upward or downward momentum. Buy when the...
The "ORTI Swing High Low / Support Resistance (Static Timeframe Multi-Period)" is based into existing studies that shows support and resistance levels taking as reference the highest and lowest points of certain periods, as a redesigned and recalculated set of the common plotted lenght. The cherry on the top for this version is, when you want to get a...
NVME Support & Resistance is unique compared to other S/R indicators out there because it provides users with automated analysis that can be done within a second and ours generate a highlight block rather than a solid line or dotted line and a highlight block is useful as it covers a bigger range compared to having dots and flat lines. Also, the zones will update...
Lines are Strong Support and resistance , Used to help find buy/sell or take profit zones. When the lines turn green, these prices are suggest good limit entry prices for longs and shorts. Default settings are left for scalping on short timeframes Please note that this is experimental and far from perfect. feel free to play about with the variables in the...
Boxes highlight Strong Support and resistance, Used to help find buy/sell or take profit zones. Please note that this is experimental and far from perfect. feel free to play about with the variables in the settings, I've Found changing the look back length to 500 or 2000 can give very differnt results. feel free to comment any suggestions I hope to update this...