Pivot Order Blocks// How it Works \\
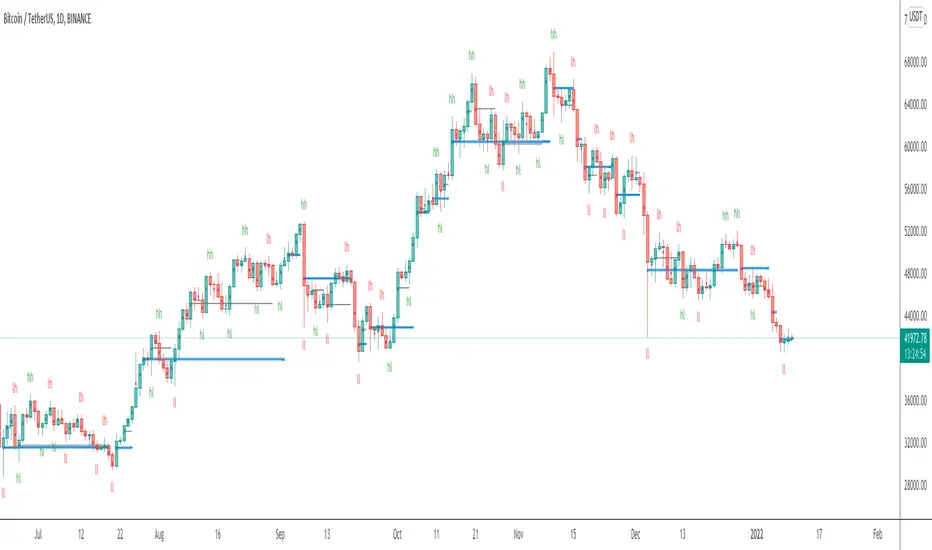
Order Blocks based on pivot reversal candle
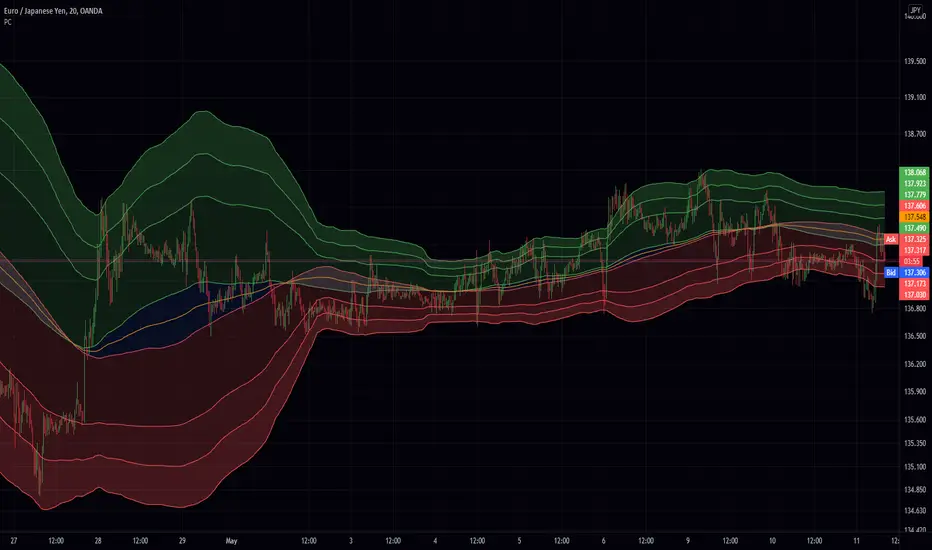
When a pivot High or Pivot Low is found and confirmed, a box will be plotted on the open and close values of that pivot candle
// Settings \\
In the settings you have the ability to change the distances required to confirm an pivot High or Low
These are the lengths where the script checks to see if it is at its local high or low.
You also have the ability to change the amount of candles the box stretches over as well as the colors of the bullish and bearish boxes
// Use Case \\
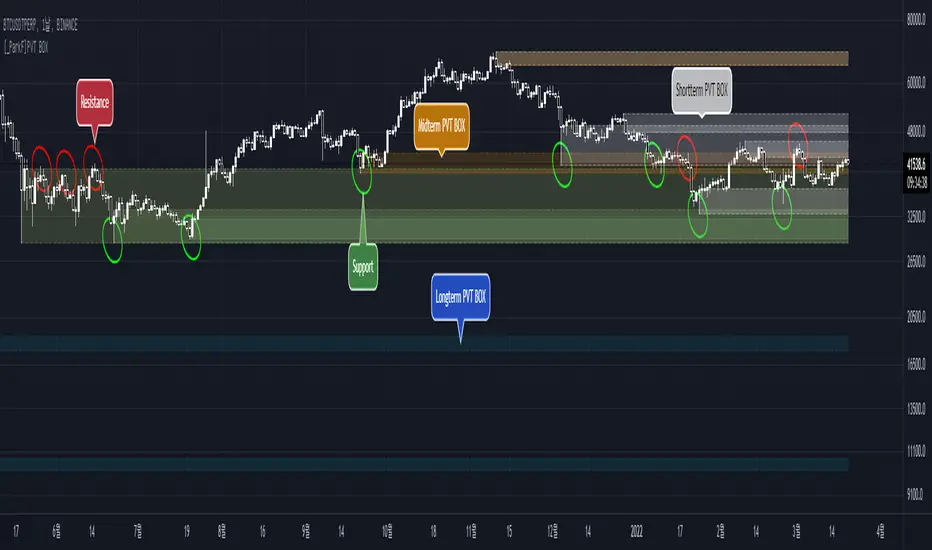
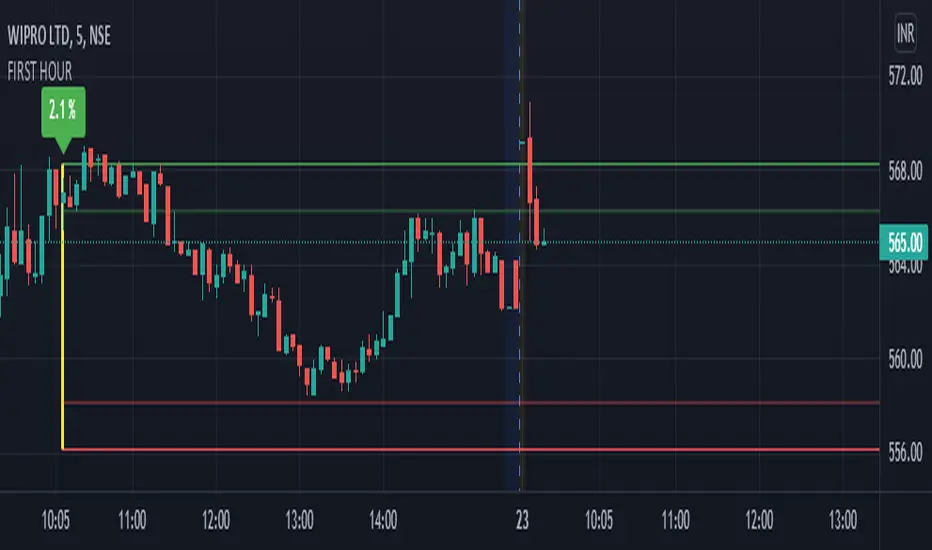
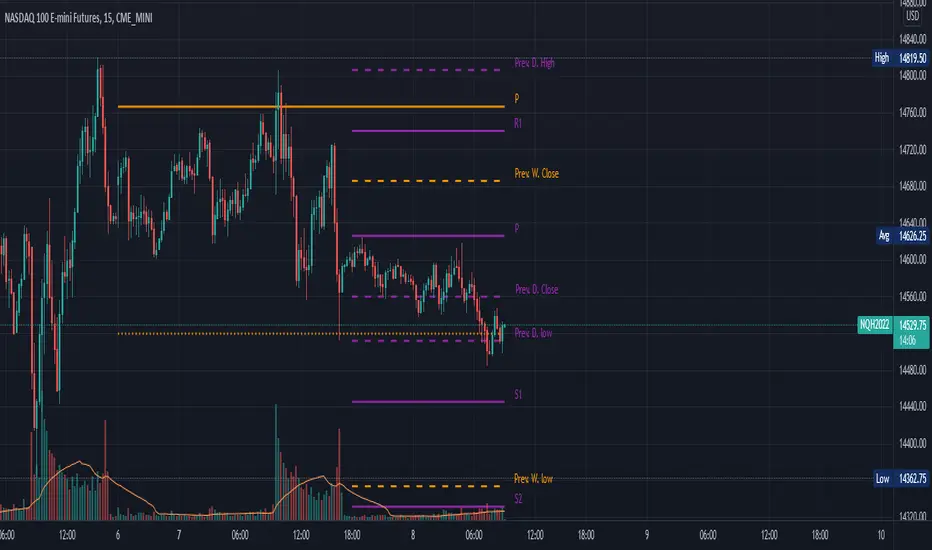
Pivot points often provide Support and Resistance points on their own,
one way of marking up order blocks is by taking the pivot candle and marking that up as a resistance area where you could be looking for price to reverse
// Suggestions \\
Happy for anyone to make any suggestions on changes which could improve the script,
// Terms \\
Feel free to use the script, If you do use the script could you please just tag me as I am interested to see how people are using it. Good Luck!
Chỉ báo Pine Script®