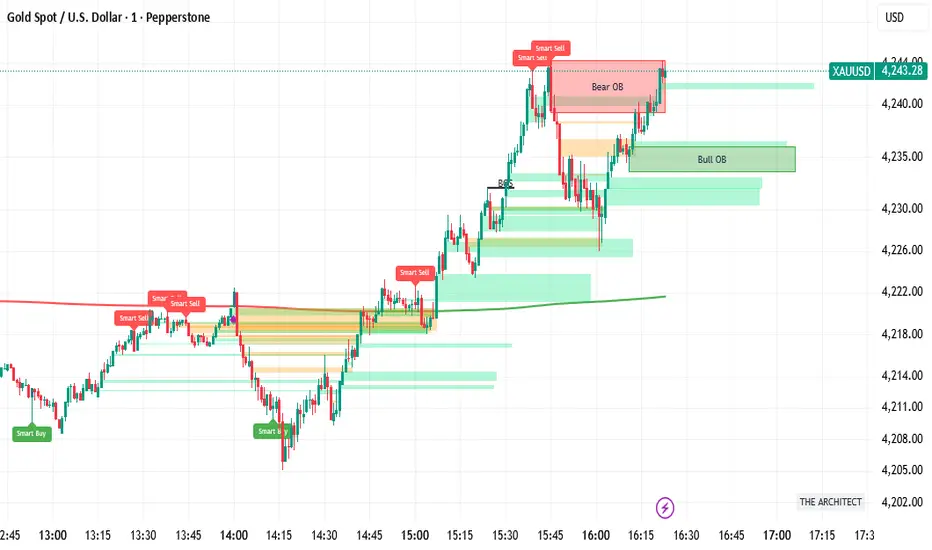
FVH THE ARCHITECT (The Consensus)HE ARCHITECT - Institutional Logic Engine
System Philosophy: THE ARCHITECT is a defensive consensus engine designed to filter market noise and align price structure with institutional momentum. It does not generate signals in isolation; it requires a "Consensus" between Price Action, Volume, and Divergence before confirming a setup.
Core Features:
Institutional Structure: Automatically identifies Order Blocks (Bull/Bear), Fair Value Gaps (FVG), and Break of Structure (BOS) based on fractal logic.
Smart Consensus Filter:
Smart VWAP: Color-coded trend filter (Green = Up, Red = Down).
Volume Spikes: Identifies institutional injection (Purple Candles) at >1.5x average volume.
Smart Reversals: RSI Divergence labels are only printed if the candle color confirms the rejection.
Focus Mode: A toggle to switch between "History Mode" (Context) and "Focus Mode" (Active Zones Only) to reduce chart clutter.
How to Use:
Buy: Wait for price to enter a Green Bull OB. Look for a "Smart Buy" label or Purple Volume Spike.
Sell: Wait for price to enter a Red Bear OB. Look for a "Smart Sell" label.
Alerts: Includes hard-coded alerts for "Smart Buy", "Smart Sell", and "Volume Spikes" for automated notifications.
Hỗ trợ và kháng cự

Intermarket Swing Projection [LuxAlgo]The Intermarket Swing Projection allows traders to plot price movement swings from any user-selected asset directly onto the chart in the form of zigzags and/or horizontal support and resistance levels.
This tool rescale the external asset price on the user chart, enabling traders to make direct comparisons.
It answers the question of how different the price behavior is between two assets, accounting for each asset's volatility.
🔶 USAGE
This tool is based on swing detection of two different assets: the chart and a user-selected asset. It allows traders to compare two assets on an equal footing while accounting for volatility and price behavior.
Traders can customize the detection by selecting a custom ticker, timeframe, the number of swings and length for swing detection. This makes the tool a Swiss army knife for asset comparison.
As we can see in the image below, the Show Last, Pivot Length, and Spread parameters are key to defining the final output of the tool.
"Show Last" defines how many pivots are displayed. "Pivot Length" is used for pivot detection; a larger value will detect larger market structures. "Spread" defines how far apart the horizontal levels will be from their original location in terms of volatility.
🔹 Comparing different assets
This image shows the Nasdaq 100 futures contract compared to four other futures contracts: S&P 500, gold, bitcoin, and euro/U.S. dollar.
Plotting all of these assets in Nasdaq 100 terms makes it easy to compare and analyze price behaviors and identify key levels.
In the top left chart, we have NQ vs. ES. It's no surprise that they are practically an exact match; a large portion of the S&P 500 is technology.
In the top right chart, NQ vs. GC, we see totally different behaviors. We can clearly see the summer consolidation in gold and the resumption of the uptrend, which took gold above 29,200 NQ points, up from 21,200.
In the bottom right chart, we see bitcoin making new highs, way above the Nasdaq in May, July, and October. However, the last high was way below the Nasdaq prices on October 27—the first lower high in a while. Sellers are pushing down.
Finally, the bottom left chart is NQ vs. 6E. We can see large volatility in the uptrend since February, with NQ unable to catch up until now. The last swing low was almost a match, and 6E is in a range.
As we can see, this tool allows us to perform intermarket analysis properly by accounting for each asset's volatility and price behavior. Then, we plot them on the same scale on equal terms, which makes performing this kind of analysis easy.
As we can see in the chart above, the assets are the same as in the previous image, but the timeframe is 1H with different settings.
Note the horizontal levels acting as support and resistance, as well as how NQ prices react to the zones marked with white circles. These levels are derived from custom assets selected by the user.
🔹 Displaying Elements
Zig-zag allows traders to clearly see the path that the selected asset's price took, as well as its turning points.
Horizontal levels are displayed from those turning points to the present and can be used as support or resistance. Traders can adjust the spread parameter in the settings panel to expand or contract those levels' volatility.
There are two color modes for the levels: average and pivots. In the first mode, green is used for levels below the average and red for levels above the average. The second uses green for swing lows and red for swing highs.
The backpaint feature is enabled by default and allows the swings to be displayed in the correct location. With this feature disabled, the swings will be displayed in the current location when a new swing is detected.
🔶 DETAILS
On a more technical note, the rescaling is formed by calculating three main elements from all the swings detected on the custom and chart assets:
The chart asset's average of all swing points
The chart asset's standard deviation of all swing points
The custom asset's z-score for each swing point
Then, the re-scaled swing point is calculated as the average plus the z-score multiplied by the standard deviation. This makes it possible to plot AAPL swings on an NQ chart, for example.
Thanks to re-scaling, we can directly compare the price behavior of two assets with different price ranges and volatility on the same chart.
🔶 SETTINGS
🔹 Trendlines
Ticker: Select the custom ticker.
Timeframe: Select a custom timeframe.
Show Last: Select how many swing points to display.
Pivot Length: Select the size for swing point detection.
Spread: Volatility multiplier for horizontal levels. Larger values mean the levels are farther apart.
Backpaint: Enable or disable the backpaint feature. When enabled, the drawings will be displayed where they were detected. When disabled, the drawings will be displayed at the moment of detection.
🔹 Style
Show ZigZag: Enable or disable the ZigZag display and choose a line style.
Show Levels: Enable or disable the levels display and choose a line style.
Color Mode: Choose between Average Mode, which colors all levels below the average bullish and all levels above bearish, and Pivot Mode, which colors swing highs bearish and swing lows bullish.
Bullish: Select a bullish color.
Bearish: Select a bearish color.
ZigZag: Select the ZigZag color.

Price Levels ConstructorHello friends,
This is a multi-period OHLC level mapping tool that lets you build your own higher-timeframe levels directly on the chart - across up to 20 customizable period slots.
You choose which periods matter (Year, Half-Year, Quarter, Month, Week, Day, weekdays, etc.), how recent they should be, and which levels to show (Open/High/Mid/Low/Close).
The script then renders those levels with automatic stacking and clear label formatting, giving you a compact higher-timeframe map for intraday and swing trading.
🛠️ How It Works
Each selected period slot creates a period model with its own OHLC+Mid data.
For each active level type, the script draws the price level, tracks the correct H/L/C timestamps when needed, and generates a label consisting of:
The selected recency (Current, Previous, 2nd Previous, …)
The period name (e.g., Month, Q1, Monday)
The level type (O/H/Mid/L/C)
All levels are fed into a registry that merges levels at identical prices, stacks their labels vertically or horizontally, and displays only one rendered line per price with combined label text.
This produces clean clusters when multiple periods share the same level.
Global settings control left/right extensions, label compactness, label content (name, price, % distance), and stacking direction.
🔥 Key Features
20 period slots
Ability to specify period (31 options, from Year to various weekdays)
Ability to specify recency for each selected period (13 options)
5 levels (Open, High, Mid, Low, Close) for each selected period
Stacking of labels of matching levels
% from All-Time High (ATH)
% from All-Time Low (ATL)
Alerts
📸 Visual Examples
The percentages in the level labels make it easy to see the current performance relative to that level
Labels with full level names
Compact labels with vertical stacking
Compact labels with horizontal stacking
👋 Good luck and happy trading!
Tập lệnh trả phí

OHLC HistoryOHLC History is a Pine Script v6 overlay that snapshots up to 32 historical OHLC-derived levels from a selectable higher (or different) timeframe and projects them onto the active chart. It uses request.security to fetch the chosen source (Close/High/Low/Open), rounds each value to the instrument’s minimum tick, and stores them in an array. A “Max Number Lookback” input limits how many of those levels are rendered. For each retained level the script draws a horizontal line extended both ways, coloring it dynamically based on whether the level is above (customizable “above” color) or below (customizable “below” color) the current price, and places compact labels (01–32) with optional price text offset by a user-defined label distance. Prior bar artifacts (lines and labels) are explicitly deleted each update to keep the chart clean, while small white plot markers ensure the levels appear in the price scale and data window for quick reference.

Rolling Volume Profile [Matrix Volume Heatmap] by NXT2017Description
This indicator offers a unique visual approach to Volume Profile analysis. Instead of the traditional histogram bars or boxes, this script renders a Rolling Volume Profile as a background "Matrix Heatmap" directly on your chart.
By dividing the price action of the most recent N-candles into 30 horizontal zones (buckets), it visualizes where the most trading activity has occurred within your defined lookback period. The visualization uses dynamic transparency to highlight the Point of Control (POC) and high-volume nodes, while fading out low-volume areas.
🧠 How it Works
The script operates on a "Rolling Window" basis, meaning it recalculates the profile at every bar to reflect the immediate market context.
Dynamic Range: It calculates the highest High and lowest Low of the user-defined Lookback Length (default: 1000 bars).
Bucket Slicing: This vertical range is divided into 30 equal price buckets.
Volume Distribution (Overlap Logic): The script iterates through the historical data. If a candle is large and spans multiple buckets, its volume is distributed proportionally across those buckets. This ensures a more realistic profile compared to simply assigning volume to the close price.
Heatmap Visualization:
The script calculates the Maximum Volume (POC) within the profile.
It uses a Reference Length to normalize this maximum.
Dynamic Opacity: Zones with volume close to the maximum are rendered opaque (solid). Zones with low relative volume become highly transparent. This creates an automatic "Heatmap" effect, allowing you to instantly spot the most significant price levels.
⚙️ Settings
Lookback Length (candles): Defines how far back the profile calculates volume (e.g., 1000 bars).
POC Reference Length: Defines the smoothing window for the 100% volume baseline. Increasing this stabilizes the color changes; decreasing it makes the heatmap more reactive to sudden volume spikes.
Profil Color: Choose the base color for the matrix. The transparency is calculated automatically.
💡 Use Case
This tool is ideal for traders who want to see the "Value Area" of the current range without cluttering the chart with complex boxes or side-bars. It works excellent as a background context tool to identify:
High Volume Nodes (Support/Resistance)
Low Volume Nodes (Price gaps/Rejection areas)
Migrating Points of Control (Trend direction)

TrendlinesDowntrend lines are one of the most important tools in technical analysis. A downtrend line is created by connecting a series of lower highs which forms a clear visual line where price repeatedly finds resistance. Traders use these lines to understand trend direction, time entries, plan exits, and quickly recognize when momentum is shifting.
This indicator automatically finds and maintains the strongest downtrend lines on any timeframe. It removes the guesswork and inconsistency that comes with manually drawing trendlines.
Unlike most other trendline indicators that just draw lines from swing highs to the current high, this indicator actively scans for new pivot highs, tests each potential line against live price action and only promotes a line to valid status once it has proven itself as a true trendline by price touching or respecting the line a user defined number of times, with the default set to three. This filters out noise and leaves only the most meaningful and reliable trendlines on your chart.
When price eventually breaks a respected downtrend line the indicator highlights the breakout immediately. Traders often use these moments for entries confirmation signals or to prepare for a potential shift in market behavior. The breakout alert is built directly into the indicator so you never miss an important move.
This indicator also works with the Pine Screener to find tickers with current valid trendlines.
How are trendlines determined?
The indicator begins by anchoring to the most recent pivot high. From there it draws a temporary line to the current bar and evaluates every bar between the two points.
Each time a high comes within a user selected buffer zone around that line it is counted as a touch. Once the required number of touches is confirmed and price has never exceeded the buffer to the upside the trendline becomes valid and is displayed on the chart as an active downtrend line.

Quicksilver Master Terminal [Institutional]Overview
The Quicksilver Master Terminal is a comprehensive data visualization interface designed to bring institutional-grade market awareness to the retail chart. It replaces the need for multiple cluttered indicators by consolidating Trend, Momentum, Volatility, and Structure into a single Heads-Up Display (HUD).
Designed by Quicksilver Algo Systems, this tool is engineered for precision scalpers and prop firm traders who require instant situational awareness without switching timeframes.
Features
1. The Institutional HUD (Heads-Up Display)
Located in the top-right corner, this live dashboard provides real-time metrics on:
Market Structure: Instantly identifies if the asset is in a Bullish or Bearish regime relative to the 200 EMA.
Momentum Status: Tracks overbought/oversold conditions using smoothed Stochastic logic.
Volatility (ATR): Displays live Average True Range data for precise Stop Loss placement.
Volume Flow: Detects institutional volume spikes (1.5x average).
2. The Trend Cloud
A dynamic visual ribbon that fills the space between the Fast EMA (50) and Slow EMA (200).
Green Cloud: Strong Bullish Trend (Look for Longs).
Red Cloud: Strong Bearish Trend (Look for Shorts).
Cross: Visual warning of trend reversals.
3. Sniper Signal Logic
The script paints "INSTITUTIONAL BUY" and "INSTITUTIONAL SELL" labels only when high-probability confluence occurs:
Exhaustion: Stochastic RSI breaches extreme levels (<20 or >80).
Confirmation: Price action aligns with Heikin Ashi smoothing to filter noise.
Momentum: Fast %K crosses Slow %D.
How to Use
For Scalping (1m - 5m): Wait for the Trend Cloud to align with the Signal. Take "BUY" signals only when the Cloud is Green.
For Risk Management: Use the live "Volatility" number in the HUD to set your Stop Loss (e.g., 1.5x the current Volatility value).
About the Developer
This script is part of the Quicksilver Ecosystem. We build algorithmic solutions focused on capital preservation and risk management for funded traders.
Disclaimer: This tool is for educational market analysis only. Past performance is not indicative of future results.

FRPC - Fractal Reversal Permission ComponentThis tool identifies high-probability reversal points using a three-stage confirmation model:
1️⃣ Liquidity Sweep (LS)
Price must take out a previous fractal high/low, indicating stop-hunt liquidity removal.
2️⃣ Reclaim (RC)
After sweeping liquidity, price must close back inside the previous swing, showing absorption and rejection.
3️⃣ Break of Structure (BOS)
A structural break confirms a true shift in market direction and avoids false reversal signals.
FRPC only triggers BUY or SELL signals when all three layers align, creating actionable reversal conditions rather than random fractal noise.
This approach helps avoid chasing breakouts, filters low-quality sweeps, and identifies areas where reversals are statistically more likely.
------------------------------------
What FRRC Helps You Identify
------------------------------------
True reversals after stop-hunts
Liquidity grabs followed by displacement
Avoiding fake breakouts
Swing points with strong reaction potential
High-probability turning points with real structure support
----------
Sidenote
----------
The accuracy of the signals range from 56% to 72% and is mainly designed to be a structural filter to be paired with a strong exhaustion system. This is just a bare bones version and I plan to work on a more advanced version yo pair with the current exhaustion systems I'm building out

PRICE ACTION TRAKKERThis indicator isolates the core price-phase engine from the full Price Action Tracker (PAT) system.
It identifies and visualises structural phases of price, including:
Upper phase boundary (dynamic resistance)
Lower phase boundary (dynamic support)
Phase average (mean-reversion anchor)
Pivot markers (LPH, LPL, oLPH, oLPL)
The phase engine dynamically adapts to evolving market structure using pivot behaviour and structural breaks. This creates a real-time visual map of how price is organising itself — independent of time-based indicators and without the lag associated with classical moving averages.
This version focuses exclusively on price action structure, making it clean, fast, and ideal as a core tool on its own.
However, it is also designed as a foundation for more advanced analysis and will expand over time as additional modules are released.
This phase engine works exceptionally well in combination with my other indicators, such as moving-average structure tools, volume-weighted frameworks, and trend-strength models. Together, they provide a layered view of market behaviour:
phase structure → trend bias → volume confirmation → entry logic.
This makes the indicator valuable for:
Intra-day and swing traders
Wyckoff and liquidity-based traders
Mean-reversion and range-trading strategies
Understanding where accumulation/distribution behaviour is forming
Identifying when a phase is likely ending or breaking
Future updates will add modular expansion paths (trend scoring, VWAP phase weighting, multi-phase confluence, and signal logic), while maintaining the simplicity and reliability of this core engine.
Works Best With:
This indicator is part of a broader toolkit designed to analyse structure, trend, and behaviour.
When used alongside my other published tools — such as trend-strength MAs, VWMA frameworks, and higher-timeframe bias indicators — it provides a complete, multi-layered view of market conditions.

VOLX+ VWAP Range BandsVOLX+ plots multiple VWAP-weighted high/low channels across different lookback periods to show how price behaves relative to short-term and long-term value zones.
Instead of using a single VWAP line, this tool creates four rolling VWAP envelopes:
Short-term range (fast reaction)
Mid-term range
Mid-mid range (transitional layer)
Long-term range (macro context)
Each band is computed as:
VWAP-High = SMA(high × volume, length) ÷ SMA(volume, length)
VWAP-Low = SMA(low × volume, length) ÷ SMA(volume, length)
This produces dynamic price channels that account for both price and traded volume, offering a clearer sense of where the market is accepting or rejecting value.
What It Shows
Four VWAP-weighted high/low bands
A short-term VWAP midline
Price line
Three SMAs for trend context
Optional visibility switches for each VWAP band
The filled regions between VWAP highs and lows create a layered “value map,” helping you interpret:
Trend continuation (price hugging outer VWAP bands)
Mean reversion (price returning toward inner bands)
Volatility contraction/expansion
Shifts in short-term vs long-term balance
🧠 How to Use
Use the short-term band for day-trading context or detecting short-term excess.
Use mid-term and mid-mid bands to confirm developing structure.
Use the long-term VWAP band to understand broader value zones.
Combine VWAP bands with SMAs and structure analysis for confluence.
This indicator is intended for price interpretation and analytical support.
✔ Does Not Repaint
The script uses rolling VWAP formulas and standard MAs; everything is stable and non-repainting.

KIMATIX S|R Zones Intra-SwingKIMATIX S|R Zones Intra-Swing is a higher-timeframe support–resistance engine designed to map the most important swing levels for intraday and swing traders.
The script scans Daily and 4H price action, detects wick-based swing highs and lows,
and converts them into clean S/R zones that project into the future.
Zones are color-coded by timeframe and by role (support or resistance),
giving you an instant visual map of where price is most likely to react.
When price breaks cleanly through a zone,
it dynamically flips (resistance → support or support → resistance),
so your levels always reflect the current market structure.
To avoid clutter, only the closest zones around current price are displayed – ideal for planning entries, targets, and stop placement.
Use it as a higher-timeframe roadmap and combine it with your intraday execution system for precise, high-confluence trades.

DWMY OHLCShows the prior D/W/M/Y OHLC levels with precise horizontal segments that update at each new session. Great for spotting reaction zones, sweeps, and bias shifts at important levels.
Monthly and Yearly levels are toggled off by default to avoid clutter, but can of course be toggled back on in the settings

KIMATIX S|R Zones ScalpKIMATIX S|R Zones Scalp is a multi-timeframe support–resistance engine built for intraday scalpers and day traders.
The script automatically detects swing highs/lows on higher timeframes and converts them into precise S/R zones that extend into the future.
Each zone is visualized as a clean price band, color-coded by timeframe (15m / 5m) and by role (support or resistance).
When price breaks decisively through a zone, that level dynamically flips from resistance to support (or vice versa), keeping the map always up to date.
To avoid chart clutter, only the closest zones around current price are displayed, giving you an ultra-clean “trade map” with the most actionable levels for entries, partials, and stops.
Perfect for scalping indices, futures, FX, and crypto.
Key Features
Automatic 15m and 5m support & resistance zone detection
Wick-based swing identification for precise levels
Dynamic role flip: resistance → support and support → resistance after breaks
Distance-based filtering: shows only the nearest zones around price
Adjustable zone width, lookback and projection length
Separate colors for HTF/LTF and for support vs. resistance
Works on any symbol and intraday timeframe
Use it as a standalone S/R map or as a confluence layer with orderflow, volume or trend tools.

CK: Locked Session H/L + Volume Profile (1m Fixed)The session roadmap every futures trader needs — without the clutter.
This tool automatically locks the previous session’s structure and gives you the five most important institutional levels:
✅ Locked Session High
✅ Locked Session Low
✅ Session POC (Point of Control)
✅ VAH – Value Area High
✅ VAL – Value Area Low
Everything is calculated using 1-minute data only, so your levels are accurate, consistent, and never repaint.
💡 What It Does
Tracks the entire session from the RTH close to the next RTH close.
Builds a volume-by-price profile for that session.
Automatically freezes the session’s:
Highest price
Lowest price
Most-traded price (POC)
70% value area (VAH/VAL)
Plots all levels as clean horizontal lines for today’s trading.
🚀 Why Traders Use This
These 5 levels control most algorithmic and institutional activity.
This indicator shows you exactly where price reacted yesterday, so you can:
Catch retests and bounces with confidence
Avoid trading in the middle of nowhere
Anticipate reversals, breakouts, and liquidity grabs
Build a consistent plan around the same fixed levels every day

Green to Red Money RailsWhat this indicator does
Green to Red Money Rails (G2R Rails) is a price-action tool that draws dynamic “rails” from recent swing lows and highs. It tracks how support and resistance are shifting so you can see where trend pressure is building or weakening.
Core logic (high level)
Detects pivot lows and stores the last three (L1, L2, L3).
Builds green support “fans”: inner dotted rails L1→L2 and L2→L3, plus a main solid base rail L1→L3.
Detects pivot highs and, when the last high is lower than the previous one, draws a red resistance rail from H2→H3.
Optional labels mark the most recent swing low (“L”) and swing high (“H”).
How to use it
Use the green rails as dynamic support zones for trend-following, pullback entries, or stop placement.
Use the red rail as a visual ceiling in downtrends: breaks above it can signal the end of a sell-off; rejections at it confirm sellers still in control.
Works best on liquid markets and swing-trading timeframes (for example, 1h–1D). Always combine with your own risk management and higher-timeframe context.
This script does not auto-generate signals or manage risk for you; it is a visual framework for reading structure and building your own trading plans.

Box TheoryBox Theory – Description
This indicator is based on the popular “Box Theory” concept, where the previous session’s High–Low range acts as the most important structure for the next session.
Traders use this because the market often reacts to the same areas where liquidity, orders, and imbalances were created in the prior session.
At every new session open, the indicator automatically records:
Previous High
Previous Low
Middle (50% level)
These three levels form a box, which becomes your roadmap for the new session.
This method is widely used because it highlights where most reversals, sweeps, and reactions occur—without needing any extra indicators.
How the Zones Are Calculated
Previous High
The highest price of the last session.
This forms the top edge, which acts as resistance and the basis for the Sell Zone.
Previous Low
The lowest price of the last session.
This forms the bottom edge, acting as support and the basis for the Buy Zone.
Middle Line (50% Level)
The exact midpoint between High and Low.
This is the fair-value zone, where price often consolidates and becomes directionless.
No signals are triggered near the middle, because trades taken here historically have low accuracy.
Buy Zone (Green Area)
The lower part of the box.
Price often reacts here because this area held buyers in the previous session.
When price enters this green zone inside the box, the indicator can show a Buy Zone label.
Sell Zone (Red Area)
The upper part of the box.
Price commonly rejects here because this area acted as resistance previously.
When price enters this red zone inside the box, the indicator can show a Sell Zone label.
How Zone Size Is Set (Sensitivity %)
You can adjust how big the Buy/Sell zones are using the Sensitivity (%) input.
Lower % → Smaller zones → More precise signals
Higher % → Larger zones → Signals appear earlier and from farther away
Formula:
Zone Size = (Previous High − Previous Low) × (Sensitivity % ÷ 100)
This lets you customize how tight or how early your signals appear.
Inside-Box Only Logic
The indicator only works inside the previous session’s range.
If price breaks above the previous High → No sell signal
If price breaks below the previous Low → No buy signal
This avoids false signals during breakouts or trending markets.
Alerts
The indicator includes two alerts:
Buy Zone Alert → Triggers when price enters the Buy Zone
Sell Zone Alert → Triggers when price enters the Sell Zone
Just enable them in TradingView’s alert panel.

Vassago & Tesla Ex-Machina 197 45 21 [Hakan Yorganci]Vassago & Tesla Ex-Machina 197 45 21
"Any sufficiently advanced technology is indistinguishable from magic." — Arthur C. Clarke
🌑 The Genesis: Algorithmic Esotericism
This script is not merely a technical indicator; it is a digital artifact born from the convergence of Software Engineering and Hermetic Tradition.
As a developer and researcher dedicated to "Technomancy"—the study of applying esoteric logic to computational systems—I designed this algorithm using a custom, experimental programming environment I am currently developing. My goal was to move beyond standard, arbitrary financial inputs (like the default 200 SMA or 14 RSI) and instead derive parameters based on Universal Harmonics and Historical Archetypes.
This indicator, Ex-Machina, is the result of that transmutation. It applies ancient numeric precision to modern market chaos.
🔢 Decoding the Protocol: 197 - 45 - 21
Why these specific numbers? They were not chosen randomly; they were calculated through specific harmonic reductions to filter out market noise.
1. The Harmonic Trend (Tesla Protocol)
* The Logic: Standard analysis uses the 200-period Moving Average simply out of habit. However, applying Nikola Tesla’s 3-6-9 vibrational principles, the engine reduced the period to 197.
* The Numerology: 1+9+7 = 17 \rightarrow 1+7 = \mathbf{8}. In esoteric numerology, 8 represents infinite power, authority, and financial flow. This creates a baseline that aligns more organically with market accumulation than the static 200.
2. The Hidden Dip (Solomonic Sight)
* The Archetype: Based on the attributes of Vassago, the archetype of discovering "hidden things," the algorithm identified 45 as the precise threshold for a "Sniper Entry."
* The Function: Unlike the standard 30 RSI, this level identifies the exact moment a correction matures within a bullish trend—catching the dip before the crowd returns.
3. The Prophetic Vision
* The Logic: Using the Fibonacci Sequence, the indicator projects the support line 21 bars into the future.
* The Utility: This allows you to visualize where the support will be, granting you foresight before price action arrives.
⚖️ The Dual Mode Engine: Sealed vs. Living
Respecting the user's will, I have engineered this script as a Hybrid System. You can choose how the "spirit" of the code interacts with the market via the settings menu.
1. The Sealed Ritual (Default - Unchecked)
* Philosophy: "Trust in the Constants."
* Behavior: Strictly adheres to the 197 SMA and 45 RSI.
* Visual: Displays a Blue Trend Line.
* Best For: Traders who value stability, long-term trends, and the unyielding nature of harmonic mathematics.
2. The Living Spirit (Adaptive Mode - Checked)
* Philosophy: "As the market breathes, so does the code."
* Behavior:
* Transmutation: The trend line shifts from a Simple Moving Average (SMA) to an Exponential Moving Average (EMA 197) for faster reaction.
* Adaptive Volatility: The RSI entry level (45) becomes dynamic. It expands and contracts based on ATR (Average True Range). In high volatility, it demands a deeper dip to trigger a signal, protecting you from fake-outs.
* Visual: Displays a Fuchsia (Pink) Trend Line.
* Best For: Volatile markets (Crypto/Forex) and traders who want the algorithm to "sense" the fear and greed in the air.
⚙️ How to Trade
* Timeframe: Optimized for 4H (The Builder) and 1D (The Architect).
* The Signal: Wait for the "EX-MACHINA ENTRY" label. This signal manifests ONLY when:
* Price is holding above the 197 Harmonic Trend.
* Momentum crosses the Optimized Threshold (45 or Adaptive).
* Trend Strength is confirmed via ADX.
Author's Note:
I built this tool for those who understand that code is the modern spellbook. Use it wisely, risk responsibly, and let the harmonics guide your entries.
— Hakan Yorganci
Technomancer & Full Stack Developer

Market Analysis Pro [Trademy]OVERVIEW
Trademy Market Analysis Pro is a professional-grade trading system that combines advanced momentum analysis with institutional-level Supply/Demand zone mapping. This indicator is designed to provide crystal-clear market analysis with precise risk management tools, creating a complete trading framework within a single, streamlined interface.
Unlike complex indicators that overwhelm traders with information, Trademy focuses on what matters: high-probability setups with clear entry points, defined risk levels, and multiple profit targets. The system is built to eliminate guesswork and provide actionable signals that work across multiple timeframes and asset classes eg: ( INDEX:BTCUSD , NASDAQ:NVDA and more )
CORE CONCEPTS
Advanced Momentum Engine: The foundation of Trademy Market Analysis Pro is a proprietary momentum detection system that identifies true directional shifts in the market. The algorithm analyzes price behavior relative to volatility-adjusted dynamic levels, generating signals only when genuine momentum reversals occur. The "Signal Sensitivity" control allows you to adapt the system from conservative (fewer, higher-quality signals) to aggressive (more frequent opportunities) based on your trading style and market conditions.
Institutional Supply/Demand Zones: The system automatically identifies and plots key institutional levels where significant buying (Demand) or selling (Supply) pressure has occurred. These zones are calculated using advanced price structure analysis, filtered through intelligent overlap detection to ensure only the most relevant zones appear on your chart. When price approaches these levels, they often act as strong support or resistance, providing logical areas for entries and exits.
Intelligent Signal Classification: Not all signals are created equal. Trademy categorizes every signal as either "Normal" or "Strong" based on its alignment with the broader market structure and trend context. Strong signals represent higher-conviction setups where momentum and trend align perfectly, while normal signals indicate counter-trend or early reversal opportunities.
Non-Repainting Architecture: Every signal is locked in at bar close (when enabled), and all TP/SL levels are calculated using volatility measurements captured at the moment of signal generation.
KEY FEATURES
Precision Signal System
Dual Signal Modes: Choose between Normal signals (standard momentum reversals) or Strong signals (high-conviction trend-aligned setups), or view both simultaneously
Wait for Bar Close: Optional no-repaint mode ensures signals only appear after candle confirmation
Visual Signal Hierarchy: Normal signals shown with standard arrows (▲/▼), Strong signals marked with distinctive colors for instant recognition
Adjustable Arrow Sizes: Customize signal display from tiny to large based on your chart preferences
Professional Risk Management
Automated TP/SL Calculation: Three take-profit levels (TP1, TP2, TP3) and one stop-loss level automatically calculated using advanced volatility measurement
Fixed Risk Levels: TP/SL lines are locked at signal generation and never move—providing consistent, reliable risk parameters
Visual Risk Zones: Optional colored zones highlight your risk and reward areas for instant position assessment
Adjustable Risk Multiplier: Scale your targets up or down with a single parameter while maintaining proper risk-reward ratios
Clear On-Chart Labels: Every level displays exact price values in an easy-to-read format
Supply/Demand Zone Mapping
Automatic Zone Detection: System identifies high-probability supply and demand zones using advanced price structure analysis
Anti-Overlap Algorithm: Intelligent filtering prevents zone clutter by removing overlapping levels
Extended Zone Projection: Zones extend into the future, showing you key levels before price reaches them
Break-of-Structure Tracking: Monitors when zones are broken and removes invalidated levels
Fully Customizable: Adjust zone colors, swing length, history depth, and box width to match your analysis style
Visual Customization
Flexible Color Schemes: Customize colors for bull/bear signals, TP/SL levels, and supply/demand zones
Trend Background: Optional background coloring to instantly visualize the current market bias
Support/Resistance Lines: Toggle automatic S/R level plotting from key price pivots
Multiple Arrow Sizes: Choose from tiny, small, normal, or large signal arrows
WHAT MAKES TRADEMY MARKET ANALYSIS PRO DIFFERENT
✅ Simplicity Meets Power
✅ TP/SL Levels
✅ Institutional Zone Integration
✅ Universal Indicator for all markets
✅ Multi-Timeframe Flexibility
BEST PRACTICES
📌 Always Use Stop-Loss: Enable the TP/SL system and respect your stop-loss levels,risk management is key to long-term success
📌 Backtest First: Before live trading, replay historical charts to understand signal behavior on your specific asset and timeframe
📌 Combine Timeframes: Use higher timeframe signals as your bias, enter on lower timeframe signals in the same direction
📌 Watch the Zones: Highest probability setups occur when signals align with supply/demand zones (buy near demand, sell near supply)
📌 Don't Chase: If you miss a signal, wait for the next one,forcing trades leads to losses
📌 Partial Profits: Consider taking partial profits at TP1, moving stop to breakeven, and letting the rest run to TP2/TP3
📩 ACCESS & SUPPORT
This is an invite-only indicator. For access inquiries, please contact via TradingView private message.
Important Disclaimers:
This indicator is a tool for technical analysis and does not constitute financial advice
Past performance does not guarantee future results
Always practice proper risk management and never risk more than you can afford to lose
Trading carries substantial risk of loss and is not suitable for all investors

Quantel.io NY AM Edge ProNY AM Edge Pro is a structured session-based market tool designed for intraday traders who work around the New York equities open.
Its purpose is to organize price action during the early-session period by:
Identifying a user-defined pre-market range
Marking the breakout of that range once the regular session begins
Monitoring for a qualifying retest or continuation
Plotting optional entry, stop, and multi-level target markers
Drawing visual elements (range, levels, risk/reward panels) to help interpret the unfolding structure
The script focuses on clarity and workflow consistency rather than prediction.
Users can customize session windows, breakout filters, retest conditions, and point-based risk/target distances.
It does not reuse logic from other indicators, does not depend on external scripts, and does not guarantee or imply performance.
It is intended strictly as an analysis and visualization tool.

Institutional Trend & Liquidity Nexus [Pro]Concept & Methodology
The core philosophy of this script is "Confluence Filtering." It does not simply overlay indicators; it forces them to work together. A signal is only valid if it aligns with the macro trend and liquidity structure.
Key Components:
Trend Engine: Uses a combination of EMA (7/21) for fast entries and SMA (200) for macro trend direction. The script includes a logical filter that invalidates Buy signals below the SMA 200 to prevent counter-trend trading.
Liquidity Imbalance (FVG): Automatically detects Fair Value Gaps to identify areas where price is likely to react. Unlike standalone FVG scripts, this module is visually optimized to show support/resistance zones without obscuring price action.
Smart Confluence Zones (Originality):
The script calculates a background "State" based on multiple factors.
Bullish Zone (Green Background): Triggers ONLY when Price > SMA 200 AND RSI > 50 AND Price > Baseline EMA.
Bearish Zone (Red Background): Triggers ONLY when Price < SMA 200 AND RSI < 50 AND Price < Baseline EMA.
This visual aid helps traders stay out of choppy markets and only focus when momentum and trend are aligned.
█ How to Use
Entry: Wait for a "Triangle" signal (Buy/Sell).
Validation: Check the Background Color. Is it highlighting a Confluence Zone?
Example: A Buy Signal inside a Green Confluence Zone is a high-probability setup.
Example: A Buy Signal with no background color suggests weak momentum and should be taken with caution.
Targets: Use the plotted FVG boxes as potential take-profit targets or re-entry zones.

6B1! Manipulation/Distribution Projections (OHLC Stats)Overview
The Manipulation/Distribution Projections (OHLC Stats) indicator is a powerful tool designed to forecast potential price levels for various timeframes on British Pound futures (6B1!). It operates on a simple yet profound principle: price action within a single candle can be broken down into “manipulation” and “distribution” phases.
By analyzing over 17 years of 6B (6B1!) historical OHLC data externally in Python, this script calculates the average (mean) and typical (median) extent of these movements. These statistical insights are then used to project key levels on your chart based on the current period’s opening price—providing a statistically-grounded framework for potential support, resistance, and price targets.
________________________________________
Key Concepts Explained
The indicator’s logic is based on how price wicks and bodies form relative to the opening price.
• Manipulation: This refers to the initial move that goes against the candle’s eventual direction.
o For a bullish candle, it’s the lower wick (the move from the open down to the low before reversing higher).
o For a bearish candle, it’s the upper wick (the move from the open up to the high before selling off).
It represents a “fake out” or a stop hunt.
• Distribution: This is the primary, directional move of the candle from the opening price.
o For a bullish candle, it’s the distance from the open to the high.
o For a bearish candle, it’s the distance from the open to the low.
It represents the “real” intended direction of price for that period.
________________________________________
How It Works
This indicator does not calculate these ratios in real-time. Instead, it leverages a comprehensive statistical analysis performed externally in Python on over 17 years of 6B (6B1!) OHLC data. This analysis determined the mean and median ratios for both Manipulation and Distribution movements across different timeframes and, for intraday periods, different times of day.
These pre-computed, static ratios are embedded directly into the script. When a new period begins (e.g., a new day on the Daily timeframe), the indicator:
1. Takes the opening price for that period.
2. Retrieves the corresponding pre-calculated Manipulation and Distribution ratios.
3. Applies these ratios to the opening price to project eight potential price levels:
o
/ - Mean Distribution
o
/ - Median Distribution
o
/ - Mean Manipulation
o
/ - Median Manipulation
This approach provides a stable, forward-looking set of levels for the entire duration of the trading period.
________________________________________
Features
• Statistically-Derived Projections: Plots eight key price levels based on historical tendencies, providing clear potential zones for entries, exits, and stop placement.
• Selectable Timeframe: Choose to view projections for the 1H, 4H, 1D, or 1W periods directly from the settings.
• Dynamic Stats Table: A powerful, on-chart dashboard that provides real-time context. For all four timeframes (1H, 4H, 1D, 1W), it shows:
o Position: Where the current price is relative to the projected zones (e.g., “In +Manip Zone,” “Below -Dist”).
o Range Completed: The percentage of the historical average range that the current period has already covered.
o Current & Average Range: The current high-to-low range in points vs. the historical average.
• Historical Context: You can display levels for previous periods to see how price has interacted with them in the past.
• Full Customization: Control the color, style, and visibility of every line, label, and fill to match your chart’s theme.
________________________________________
How to Use
This indicator is versatile and can be integrated into various trading strategies.
• Identifying Targets & Reversal Zones: The Distribution levels (especially the zone between the median and mean) can serve as logical take-profit targets, as they represent a historical point of extension. Conversely, Manipulation levels can indicate areas where price might form a wick and reverse.
• Gauging Volatility: Use the Stats Table’s “Range Completed” column to assess market conditions. If the 1D range is only 30% complete by mid-day, there may be room for significant expansion. If it’s already at 150%, the market might be overextended and due for consolidation.
• Multi-Timeframe Confluence: Use the Stats Table to quickly check if the price on a lower timeframe (e.g., 1H) is approaching a significant level on a higher timeframe (e.g., 1D), adding more weight to that level.
• Defining Bias: If the price opens and holds above the Manipulation zones, it can signal a strong directional bias for the rest of the period.
________________________________________
Settings
• Projection Timeframe: The primary timeframe for which to calculate and display the levels.
• Historical Periods to Show: Set to 1 for only the current period, or increase to see how levels from past periods held up.
• Timezone: Set the timezone for accurate hourly calculations (defaults to America/New_York).
• Visuals: Customize the appearance of the projection lines, labels, and the shaded zones between mean and median levels.
• Stats Table: Enable/disable the table and configure its position, size, and colors.
________________________________________
Disclaimer
This indicator is for informational and educational purposes only. It does not constitute financial advice or a recommendation to buy or sell any asset. All trading involves risk, and past performance is not indicative of future results. Please do your own research and risk management.
Enjoy!

GC1! Manipulation/Distribution Projections (17 years OHLC Stats)Overview
The Manipulation/Distribution Projections (OHLC Stats) indicator is a powerful tool designed to forecast potential price levels for various timeframes on Gold futures (GC1!). It operates on a simple yet profound principle: price action within a single candle can be broken down into “manipulation” and “distribution” phases.
By analyzing over 17 years of GC (GC1!) historical OHLC data externally in Python, this script calculates the average (mean) and typical (median) extent of these movements. These statistical insights are then used to project key levels on your chart based on the current period’s opening price—providing a statistically-grounded framework for potential support, resistance, and price targets.
________________________________________
Key Concepts Explained
The indicator’s logic is based on how price wicks and bodies form relative to the opening price.
• Manipulation: This refers to the initial move that goes against the candle’s eventual direction.
o For a bullish candle, it’s the lower wick (the move from the open down to the low before reversing higher).
o For a bearish candle, it’s the upper wick (the move from the open up to the high before selling off).
It represents a “fake out” or a stop hunt.
• Distribution: This is the primary, directional move of the candle from the opening price.
o For a bullish candle, it’s the distance from the open to the high.
o For a bearish candle, it’s the distance from the open to the low.
It represents the “real” intended direction of price for that period.
________________________________________
How It Works
This indicator does not calculate these ratios in real-time. Instead, it leverages a comprehensive statistical analysis performed externally in Python on over 17 years of GC (GC1!) OHLC data. This analysis determined the mean and median ratios for both Manipulation and Distribution movements across different timeframes and, for intraday periods, different times of day.
These pre-computed, static ratios are embedded directly into the script. When a new period begins (e.g., a new day on the Daily timeframe), the indicator:
1. Takes the opening price for that period.
2. Retrieves the corresponding pre-calculated Manipulation and Distribution ratios.
3. Applies these ratios to the opening price to project eight potential price levels:
o
/ - Mean Distribution
o
/ - Median Distribution
o
/ - Mean Manipulation
o
/ - Median Manipulation
This approach provides a stable, forward-looking set of levels for the entire duration of the trading period.
________________________________________
Features
• Statistically-Derived Projections: Plots eight key price levels based on historical tendencies, providing clear potential zones for entries, exits, and stop placement.
• Selectable Timeframe: Choose to view projections for the 1H, 4H, 1D, or 1W periods directly from the settings.
• Dynamic Stats Table: A powerful, on-chart dashboard that provides real-time context. For all four timeframes (1H, 4H, 1D, 1W), it shows:
o Position: Where the current price is relative to the projected zones (e.g., “In +Manip Zone,” “Below -Dist”).
o Range Completed: The percentage of the historical average range that the current period has already covered.
o Current & Average Range: The current high-to-low range in points vs. the historical average.
• Historical Context: You can display levels for previous periods to see how price has interacted with them in the past.
• Full Customization: Control the color, style, and visibility of every line, label, and fill to match your chart’s theme.
________________________________________
How to Use
This indicator is versatile and can be integrated into various trading strategies.
• Identifying Targets & Reversal Zones: The Distribution levels (especially the zone between the median and mean) can serve as logical take-profit targets, as they represent a historical point of extension. Conversely, Manipulation levels can indicate areas where price might form a wick and reverse.
• Gauging Volatility: Use the Stats Table’s “Range Completed” column to assess market conditions. If the 1D range is only 30% complete by mid-day, there may be room for significant expansion. If it’s already at 150%, the market might be overextended and due for consolidation.
• Multi-Timeframe Confluence: Use the Stats Table to quickly check if the price on a lower timeframe (e.g., 1H) is approaching a significant level on a higher timeframe (e.g., 1D), adding more weight to that level.
• Defining Bias: If the price opens and holds above the Manipulation zones, it can signal a strong directional bias for the rest of the period.
________________________________________
Settings
• Projection Timeframe: The primary timeframe for which to calculate and display the levels.
• Historical Periods to Show: Set to 1 for only the current period, or increase to see how levels from past periods held up.
• Timezone: Set the timezone for accurate hourly calculations (defaults to America/New_York).
• Visuals: Customize the appearance of the projection lines, labels, and the shaded zones between mean and median levels.
• Stats Table: Enable/disable the table and configure its position, size, and colors.
________________________________________
Disclaimer
This indicator is for informational and educational purposes only. It does not constitute financial advice or a recommendation to buy or sell any asset. All trading involves risk, and past performance is not indicative of future results. Please do your own research and risk management.
Enjoy!
