Weekday Close vs Open — Last N (per weekday)# Weekday Close vs Open - Last N Occurrences
This indicator distills every weekday's historical open-to-close behavior into a compact table so you can see how "typical" the current session is before the day even closes. It runs independently of your chart timeframe by pulling daily OHLCV data under the hood, tracking the last **N** completed occurrences for each weekday, and refreshing only when a daily bar closes. On daily charts you can also shade every past bar that matches today's weekday (excluding the in-progress session) to reinforce the pattern visually while the table remains non-repainting.
## What It Shows
- **Win/Loss/Tie counts** - how many of the last `N` occurrences closed above the open (wins), below (losses), or inside the tie threshold you define as "flat".
- **Win % heatmap** - the win column is color-coded (deep green > deep red) so you immediately recognize strong or weak weekdays.
- **Advanced metrics (optional)** - average daily volume plus the average percentage excursion above/below the open (`AvgUp%`, `AvgDn%`) for that weekday.
- **Totals row** - aggregates every weekday into one row to estimate overall hit rate and average stats across the entire data set.
- **Weekday shading (optional)** - on daily charts you can tint every bar that matches today's weekday (all Mondays, all Fridays, etc.) for instant pattern recognition.
## How It Works
1. The script requests daily OHLCV data (non-repainting) regardless of the chart timeframe.
2. When a new daily bar confirms, it packs that day's data into one of seven arrays (one per weekday). Each day contributes five floats (O/H/L/C/V) so trimming and statistics stay in lockstep.
3. A helper function (`f_dayMetrics`) scans daily history to compute average volume, average excursion above/below the open, and win/loss/tie counts for the requested weekday.
4. The table populates on the last bar of the chart session, respecting your advanced/totals toggles and keeping text at `size.normal`.
## Reading the Table
- **Win/Loss/Tie columns**: raw counts taken from your chosen `N`.
- **Win %***: excludes ties from the denominator so it reflects only decisive closes.
- **AvgUp% / AvgDn%**: typical intraday extension (high vs open, open vs low) in percent.
- **Avg Vol**: arithmetic mean of daily volume for that weekday.
- **TOTAL row**: provides a global win rate plus volume/up/down averages weighted by how many samples each weekday contributed.
## Practical Uses
- Spot weekdays that historically trend higher or lower before entering a trade.
- Compare current price action against the typical intraday range (`AvgUp%` vs today's move).
- Filter mean-reversion vs breakout setups based on the most reliable weekday patterns.
- Quickly gauge whether today is behaving "in character" by referencing the highlighted row or the optional whole-chart weekday shading.
> **Tip:** Use smaller `N` values (e.g., 10-20) for adaptive, recent behavior and larger values (50+) to capture longer-term seasonality. Tighten the tie threshold if you want almost every candle to register as win/loss, or widen it to focus only on meaningful moves.
Tables

Uptrick: Stellar NexusOverview
Uptrick: Stellar Nexus is a multi-layered chart tool designed to help traders visualize market behavior with enhanced clarity and depth. It presents various overlays, signal triggers, and an asset-level behavioral table in one cohesive interface. Its core focus is to illustrate how different market states shift over time. By displaying directional structures, dynamic zones, momentum shifts, and a real-time probability assessment of multiple assets, it aims to deliver a comprehensive perspective for those looking to navigate complex market environments more confidently.
Purpose
The primary purpose of Stellar Nexus is to unify several market assessment methods into a single framework, sparing users the need to rely on multiple disjointed indicators. It is especially useful for traders who value having layered signals, interactive overlays, and a quick reference to asset-specific metrics within one tool. By consolidating multiple market insights, the script aspires to reduce guesswork, limit information overload, and present clear triggers for potential trade opportunities or risk management decisions.
Originality
Stellar Nexus stands out because it relies on a proprietary set of logic layers, each carefully designed to detect nuanced shifts in price movement. The script brings forward a streamlined depiction of underlying market changes through color-coded zones, shape markers, and short textual tags. Its architecture also accommodates multiple “modes” of viewing the market—be it through layered cloud structures, trend ribbons, or step-based overlays—so traders can adapt its outputs to match changing conditions. The presence of a specialized probability table and a real-time market state meter (HUD Meter) further underscores its uniqueness, providing at-a-glance scoring for various instruments and a gauge that visually displays ongoing transitions from trending to ranging phases.
Inputs
Stellar Nexus includes several user-configurable settings, organized into themed groups. Each input subtly modifies how information is derived or rendered on the chart:
General
Silken Veil (integer input) : Governs how smooth or responsive various underlying signals will appear.
Canvas (dropdown) : Chooses the primary visual overlay style among Nebula Trail, Velora, or Stellar Stepfilter.
Signals (dropdown) : Selects which built-in signal engine (Fluxor or Flowgen) is responsible for painting buy and sell markers.
Nova Tension (integer input) : Influences the internal motion sensitivity used by certain triggers.
Astral Ribbon (integer input) : Imparts a broader directional bias layer that can highlight whether the current environment is bullish or bearish.
Bands
Phase Delay (integer input) : Impacts baseline offsets for certain dynamic band calculations.
Band Softener (float input) : Creates a blended baseline, balancing two distinct smoothing techniques.
Spread Factor (float input) : Scales how wide or narrow the generated envelope bands become.
Layer Offset (float input) : Adjusts spacing between multiple layered boundaries in the band structure.
Smooth Mode (dropdown boolean) : Toggles an extra layer of smoothing on or off for the plotted envelopes.
Feed Matrix
Burst (integer input) : Adjusts how the Flowgen engine interprets momentum buildup. Higher values generally lead to more conservative signals.
Delta Curve Sync (integer input) : Alters the sensitivity of directional alignment within the Flowgen system, refining how quickly the script adapts to market slope changes.
Lambda Pulse Shift (integer input) : Controls timing offsets within the Flowgen structure, subtly influencing the trigger timing of transitions.
Sync Drift Limit (integer input) : Provides a stabilizing effect on the internal motion detection engine, helping reduce erratic behavior during choppy conditions.
WMA Open Filter Tunnel (integer input) : Filters signal validity by applying a dynamic range check on opening price structures, reducing false positives in unstable markets.
Probability Table
Show Predictability Table (boolean) : Enables or disables a table of asset metrics.
Show Numeric Values (boolean) : Switches between displaying numeric values and using simple directional markers in the table cells.
Stepfilter
Sensitivity (dropdown) : Offers a range of speed profiles (Very Fast to Very Slow and TURTLE option) that define how quickly or slowly the step-based overlay reacts to price changes.
HUD Meter
Show Stellar HUD Meter (boolean) : Turns on or off a specialized gauge for quick insight into trending vs. ranging conditions.
Take Profit Signals
Show TP Signals (boolean) : Determines whether exit or take-profit markers are displayed after certain conditions have been met.
Phase Length (integer input) : Influences the internal baseline used for the exit signal logic.
Sync Channel (integer input) : Sets a period within which different data points are compared or synced.
Filter (integer input) : Imposes an additional smoothing on exit-related cues.
Features
Signals (Fluxor and Flowgen)
Fluxor
Logic: Fluxor focuses on detecting specific price transitions, validating them against an internal directional and momentum layer, and then confirming the move based on the script’s overarching market bias.
Visual Representation: When Fluxor is activated, up and down label markers (“▲+” or “▼+”) appear at points the system regards as noteworthy transitions. These do not guarantee trades but are designed to guide users on when buying or selling pressure may have intensified or reversed.
How It Helps: Fluxor is streamlined for those who want simpler, clearer triggers that factor in both trend alignment and short-term motion shifts. This option is more for mean reversion traders.
Flowgen
Logic: Flowgen employs a slightly more sophisticated approach that evaluates multiple “environmental layers,” including structural alignment, directional slope checks, and distinct open-state filters.
Visual Representation: When Flowgen senses a valid transition, it prints discrete up and down markers, much like Fluxor, but triggered by different, multi-layer considerations.
How It Helps: Flowgen caters to traders who desire more emphasis on layered agreement—where multiple aspects of the market must line up before a signal is shown. This option is more for trend following traders.
Overlays (Nebula Trail, Velora, Stellar Stepfilter)
Nebula Trail
Purpose: This indicator employs dynamic, color-coded bands around price action to illustrate prevailing market bias and track which side—bulls or bears—wields greater influence, aligning with a trend-following approach.
Usage: This indicator creates outer and inner “band” regions that can function as potential support or resistance in alignment with market momentum. In bullish phases, the cloud below price acts as a supportive barrier, whereas during bearish conditions, the cloud above price provides a point of resistance. When a bearish signal is detected, traders may enter short positions on a price bounce off this band and then exit when subsequent take-profit cues appear, effectively leveraging the band for both entry and exit strategies.
Velora
Purpose: Extends the concept of band visualization into layered “tiers,” giving a more fine-grained view of how price transitions from one band to another.
Representation: Zones are subdivided into multiple steps, each with distinct shading. As the script’s internal logic detects shifts between bullish or bearish conditions, these layered bands expand or contract to reflect changing momentum.
Usage: Velora subdivides zones into multiple steps, each featuring distinct shading. As the script's internal logic detects shifts between bullish or bearish conditions, these layered bands expand or contract, signaling changes in momentum. When price enters the upper band, especially if the HUD meter shows less definitive momentum, it may hint at a non-trending environment; conversely, in a bearish scenario, the lower band can act as potential support. Narrower bands often point to an impending breakout, while wider bands can suggest a possible reversion in price. Velora is well-suited for traders wanting to see more intermediate zones where the market may hesitate or show partial confirmation—ideal for refined entries or exits.
Smooth:
Choppy:
Stellar Stepfilter
Purpose: Focuses on a persistent directional line that only updates when the script’s logic deems a genuine shift is taking place.
Representation: A single line plots on the chart to represent the “locked” direction. During periods of noise or indecision, this line may remain static, reducing false signals. Optionally, bars can be recolored to reflect bullish or bearish states.
Usage: Traders who prefer a minimalistic, stand-back approach often select Stellar Stepfilter for its ability to filter out choppy conditions and highlight clearer momentum strides. When the line remains flat—particularly in the very slow or “turtle” mode—it signals a ranging market, offering valuable insight into periods of reduced volatility. In TURTLE mode, bars are recolored green or orange to reflect locked trend direction more visibly. TURTLE mode offers the most conservative setting within the Stepfilter engine, emphasizing stability and clarity by reacting only to the strongest directional conditions and visually reinforcing its state through bar coloring.
Very Fast
Very Slow
TURTLE Mode
Probability Table
Description: The Probability Table is displayed on the top-right corner (by default). It automatically fetches data for a handful of assets (in this case, five popular cryptocurrencies), then scores each asset on multiple behavioral metrics. By default, the Probability Table monitors SOL, BTC, ETH, BNB, and XRP from Binance.
Metrics Explained:
HV: Suggests how the asset’s price is fluctuating relative to a standard reference.
ATR/Vol: A ratio that provides insight into volatility compared to trading activity.
WBR: Compares candle wicks against their bodies to gauge the frequency of price swings outside an open-close range.
Liq Clust: Indicates if there are pockets of stable or unstable liquidity.
Momentum: Observes shifts in buying or selling pressure.
PRI: Shows a baseline measure of how far price has deviated from a certain average over time.
Final Verdict: Based on each metric’s reading, an overall classification emerges: Predictable, Moderate, or Chaotic.
How It Helps: Traders can quickly scan this table to see if an asset’s environment is “Predictable” (potentially more structured), “Moderate” (balanced or transitional), or “Chaotic” (unstable and riskier). Each cell can optionally show either numeric approximations or simple “up/down” arrows to reduce clutter.
Non Numeric Values
Numeric Values
Stellar HUD Meter
Description: Located at the top center of the chart, this horizontal gauge toggles between “Trending” and “Ranging,” representing how firmly price is locked in directional expansion versus sideways hesitation.
Mechanics (General): The gauge increments or decrements over time, smoothing out abrupt shifts. A pointer slides across the meter, indicating whether conditions are leaning more toward persistent momentum or uncertain, choppy movement.
How It Helps: This immediate visual feedback helps traders decide if momentum strategies or mean-reversion approaches are more suitable at a given moment, avoiding reliance on guesswork alone.
Take Profit Signals
Description: After any buy or sell trigger occurs (either through Fluxor or Flowgen), the script can flag up to three potential exit points.
Trigger Logic (General): These exits appear when certain internal checks sense that short-term upside or downside pressure may be waning.
Representation: Small markers (“X”) appear near the top or bottom of the candle.
How It Helps: Rather than passively holding a position, these optional signals remind traders of possible exhaustion points. If they choose to follow them, it can help secure partial or full profits during a trend.
Why more than one indicator?
Having more than one internal indicator engine allows Stellar Nexus to adapt to different market behaviors and personal trading styles. Sometimes traders require swift, high-frequency triggers (Fluxor). Other times, they prefer more layered agreement before taking a position (Flowgen). Similarly, each overlay—Nebula Trail, Velora, and Stellar Stepfilter—offers a distinct method for visualizing price action. Markets are dynamic, and no single representation is ideal for all conditions. By blending multiple approaches into one script, Stellar Nexus provides flexibility: a user can switch between sets of signals or overlays based on market phase, personal risk preference, or the timeframe being traded.
Additional Features
Alert System: Built-in alerts for every trigger or state change ensure that traders can receive real-time notifications, even when away from the chart. The alert system includes buy/sell triggers, trend shifts, overlay transitions, take-profit points, and predictability status changes across monitored assets.
Selective Visibility: Users can enable or disable various modules—Probability Table, HUD Meter, Take Profit Signals—to keep their chart interface uncluttered.
State Persistence: Certain modules “lock in” their reading until a strong reason emerges to change it, which can help minimize false flips in volatile conditions.
Tailored Aesthetics: Color choices and label styling are curated to be visually distinct, reducing confusion when multiple signals or overlays occur simultaneously.
Conclusion
Uptrick: Stellar Nexus is a comprehensive, multi-layer script that merges aesthetic clarity with functional depth. It combines diverse overlays, signal engines, probability analyses, and a heads-up market meter into one cohesive tool. By handling trending vs. ranging states, evaluating asset predictability, and offering selective take-profit cues, it serves as a versatile companion for traders who want organized, visually intuitive guidance. Its originality is found not only in how it disguises internal computations, but in the ease with which users can cycle through different overlays and signals to suit changing market conditions. As always, personal due diligence, market awareness, and risk management remain essential. Stellar Nexus simply provides a refined canvas on which to read and interpret price action more confidently.
Disclaimer
This indicator is provided solely for informational and educational purposes. It does not constitute investment advice or a recommendation to engage in any trading activities. Trading and investing in financial markets involve significant risk, and past performance is not indicative of future results. Always conduct your own research, utilize proper risk management, and consider consulting a qualified financial professional before making any investment decisions. Neither the creator nor any contributors to this script accept any liability for financial losses or damages arising from its use. Users of this indicator assume full responsibility for their trading activities.

Casa_TableLibrary "Casa_Table"
A powerful library for creating customizable tables from data arrays and matrices.
Features flexible formatting options including:
- Multiple function implementations for different levels of control
- Consistent column counts required across matrix rows
- Matching dimensions needed for color arrays/matrices
- Cell spanning capabilities across rows/columns
- Rich examples demonstrating proper data structure setup
The library makes it easy to transform your data into professional-looking
tables while maintaining full control over their visual appearance.
floatArrayToCellArray(floatArray)
Helper function that converts a float array to a Cell array so it can be rendered with the fromArray function
Parameters:
floatArray (array) : (array) the float array to convert to a Cell array.
Returns: array The Cell array to return.
stringArrayToCellArray(stringArray)
Helper function that converts a string array to a Cell array so it can be rendered with the fromArray function
Parameters:
stringArray (array) : (array) the array to convert to a Cell array.
Returns: array The Cell array to return.
floatMatrixToCellMatrix(floatMatrix)
Helper function that converts a float matrix to a Cell matrix so it can be rendered with the fromMatrix function
Parameters:
floatMatrix (matrix) : (matrix) the float matrix to convert to a string matrix.
Returns: matrix The Cell matrix to render.
stringMatrixToCellMatrix(stringMatrix)
Helper function that converts a string matrix to a Cell matrix so it can be rendered with the fromMatrix function
Parameters:
stringMatrix (matrix) : (matrix) the string matrix to convert to a Cell matrix.
Returns: matrix The Cell matrix to return.
fromMatrix(CellMatrix, position, verticalOffset, transposeTable, textSize, borderWidth, tableNumRows, blankCellText)
Takes a CellMatrix and renders it as a table.
Parameters:
CellMatrix (matrix) : (matrix) The Cells to be rendered in a table
position (string) : (string) Optional. The position of the table. Defaults to position.top_right
verticalOffset (int) : (int) Optional. The vertical offset of the table from the top or bottom of the chart. Defaults to 0.
transposeTable (bool) : (bool) Optional. Will transpose all of the data in the matrices before rendering. Defaults to false.
textSize (string) : (string) Optional. The size of text to render in the table. Defaults to size.small.
borderWidth (int) : (int) Optional. The width of the border between table cells. Defaults to 2.
tableNumRows (int) : (int) Optional. The number of rows in the table. Not required, defaults to the number of rows in the provided matrix. If your matrix will have a variable number of rows, you must provide the max number of rows or the function will error when it attempts to set a cell value on a row that the table hadn't accounted for when it was defined.
blankCellText (string) : (string) Optional. Text to use cells when adding blank rows for vertical offsetting.
fromMatrix(dataMatrix, position, verticalOffset, transposeTable, textSize, borderWidth, tableNumRows, blankCellText)
Renders a float matrix as a table.
Parameters:
dataMatrix (matrix) : (matrix_float) The data to be rendered in a table
position (string) : (string) Optional. The position of the table. Defaults to position.top_right
verticalOffset (int) : (int) Optional. The vertical offset of the table from the top or bottom of the chart. Defaults to 0.
transposeTable (bool) : (bool) Optional. Will transpose all of the data in the matrices before rendering. Defaults to false.
textSize (string) : (string) Optional. The size of text to render in the table. Defaults to size.small.
borderWidth (int) : (int) Optional. The width of the border between table cells. Defaults to 2.
tableNumRows (int) : (int) Optional. The number of rows in the table. Not required, defaults to the number of rows in the provided matrix. If your matrix will have a variable number of rows, you must provide the max number of rows or the function will error when it attempts to set a cell value on a row that the table hadn't accounted for when it was defined.
blankCellText (string) : (string) Optional. Text to use cells when adding blank rows for vertical offsetting.
fromMatrix(dataMatrix, position, verticalOffset, transposeTable, textSize, borderWidth, tableNumRows, blankCellText)
Renders a string matrix as a table.
Parameters:
dataMatrix (matrix) : (matrix_string) The data to be rendered in a table
position (string) : (string) Optional. The position of the table. Defaults to position.top_right
verticalOffset (int) : (int) Optional. The vertical offset of the table from the top or bottom of the chart. Defaults to 0.
transposeTable (bool) : (bool) Optional. Will transpose all of the data in the matrices before rendering. Defaults to false.
textSize (string) : (string) Optional. The size of text to render in the table. Defaults to size.small.
borderWidth (int) : (int) Optional. The width of the border between table cells. Defaults to 2.
tableNumRows (int) : (int) Optional. The number of rows in the table. Not required, defaults to the number of rows in the provided matrix. If your matrix will have a variable number of rows, you must provide the max number of rows or the function will error when it attempts to set a cell value on a row that the table hadn't accounted for when it was defined.
blankCellText (string) : (string) Optional. Text to use cells when adding blank rows for vertical offsetting.
fromArray(dataArray, position, verticalOffset, transposeTable, textSize, borderWidth, blankCellText)
Renders a Cell array as a table.
Parameters:
dataArray (array) : (array) The data to be rendered in a table
position (string) : (string) Optional. The position of the table. Defaults to position.top_right
verticalOffset (int) : (int) Optional. The vertical offset of the table from the top or bottom of the chart. Defaults to 0.
transposeTable (bool) : (bool) Optional. Will transpose all of the data in the matrices before rendering. Defaults to false.
textSize (string) : (string) Optional. The size of text to render in the table. Defaults to size.small.
borderWidth (int) : (int) Optional. The width of the border between table cells. Defaults to 2.
blankCellText (string) : (string) Optional. Text to use cells when adding blank rows for vertical offsetting.
fromArray(dataArray, position, verticalOffset, transposeTable, textSize, borderWidth, blankCellText)
Renders a string array as a table.
Parameters:
dataArray (array) : (array_string) The data to be rendered in a table
position (string) : (string) Optional. The position of the table. Defaults to position.top_right
verticalOffset (int) : (int) Optional. The vertical offset of the table from the top or bottom of the chart. Defaults to 0.
transposeTable (bool) : (bool) Optional. Will transpose all of the data in the matrices before rendering. Defaults to false.
textSize (string) : (string) Optional. The size of text to render in the table. Defaults to size.small.
borderWidth (int) : (int) Optional. The width of the border between table cells. Defaults to 2.
blankCellText (string) : (string) Optional. Text to use cells when adding blank rows for vertical offsetting.
fromArray(dataArray, position, verticalOffset, transposeTable, textSize, borderWidth, blankCellText)
Renders a float array as a table.
Parameters:
dataArray (array) : (array_float) The data to be rendered in a table
position (string) : (string) Optional. The position of the table. Defaults to position.top_right
verticalOffset (int) : (int) Optional. The vertical offset of the table from the top or bottom of the chart. Defaults to 0.
transposeTable (bool) : (bool) Optional. Will transpose all of the data in the matrices before rendering. Defaults to false.
textSize (string) : (string) Optional. The size of text to render in the table. Defaults to size.small.
borderWidth (int) : (int) Optional. The width of the border between table cells. Defaults to 2.
blankCellText (string) : (string) Optional. Text to use cells when adding blank rows for vertical offsetting.
debug(message, position)
Renders a debug message in a table at the desired location on screen.
Parameters:
message (string) : (string) The message to render.
position (string) : (string) Optional. The position of the debug message. Defaults to position.middle_right.
Cell
Type for each cell's content and appearance
Fields:
content (series string)
bgColor (series color)
textColor (series color)
align (series string)
colspan (series int)
rowspan (series int)
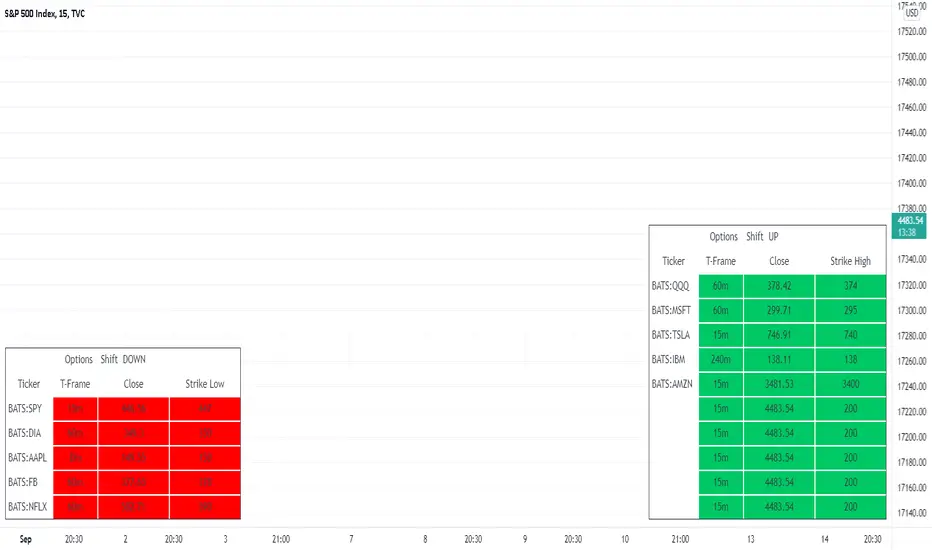
Futures Open/High/Low TablesAdds (up to) 3 tables to a chart, displaying Open/High/Low data for today (RTH and extended hours), yesterday, and the current week / month -- to help with intraday analysis of a futures ticker.
The tables only appear on intraday charts (5min, 30min, etc). On a Daily/Weekly/etc chart they are not calculated or shown.
In addition to Open/High/Low, the "Current" table in the top-right shows a live measurement of # of points from the open, the RTH open, and the highs/lows.
Lastly, the 9:30am ET open and the 4pm RTH close are by default marked with a shaded background (on intraday charts) for easy visual reference, and also to help with adjusting the session time to accommodate time zone issues if they occur.
Tested on ES in Eastern Time Zone, but should work on any futures instrument and any time zone by adjusting the Session Time setting.

MTF MA ChaserThis is my own Moving Averages analysis tool, if anyone else will find it useful.
How It Works:
Upon adding the indicator to the chart, it calculates the selected Moving Averages for the defined timeframes. The main chart will display these MAs according to the user's chosen timeframe and type (default is the chart timeframe). Simultaneously, a table is generated on the chart, showcasing the percentage difference of the current price from these MAs across various timeframes. This table is color-coded to indicate different market states, such as proximity to MA/price crossovers.
Key Features:
Multi-Timeframe Analysis: Users can view Moving Average data from different timeframes (5m, 15m, 1H, 4H, 1D, 1W) on their current chart. This allows for quick and efficient analysis without the need to switch between different timeframe charts.
Variety of Moving Averages: The indicator supports different types of MAs, including EMA (Exponential Moving Average), SMA (Simple Moving Average), and others, providing flexibility in analysis.
Realtime Data Option: Users can choose to display real-time data for MAs, enabling them to make timely trading decisions based on the most current market information.
Customizable Display: The indicator features a customizable table that displays the MA values and their differences from the current price in percentages. Users can show or hide this table and adjust its position and text size according to their preference.
Limited Timeframe Support: The indicator is designed to work on equal or higher timeframes relative to the current chart's timeframe. It specifically supports 5-minute (5m), 15-minute (15m), 1-hour (1H), 4-hour (4H), 1-day (1D), and 1-week (1W) timeframes. This means if your current chart is set to a 1-hour timeframe, the indicator will only show MA data for 1-hour and longer timeframes (4H, 1D, 1W), but not for shorter ones like 5m or 15m.
Yet, you can go down to a 1 - 4 minute chart for scalping purposes if necessary.

TableLibrary "Table"
This library provides an easy way to convert arrays and matrixes of data into tables. There are a few different implementations of each function so you can get more or less control over the appearance of the tables. The basic rule of thumb is that all matrix rows must have the same number of columns, and if you are providing multiple arrays/matrixes to specify additional colors (background/text), they must have the same number of rows/columns as the data array. Finally, you do have the option of spanning cells across rows or columns with some special syntax in the data cell. Look at the examples to see how the arrays and matrixes need to be built before they can be used by the functions.
floatArrayToCellArray(floatArray)
Helper function that converts a float array to a Cell array so it can be rendered with the fromArray function
Parameters:
floatArray (float ) : (array) the float array to convert to a Cell array.
Returns: array The Cell array to return.
stringArrayToCellArray(stringArray)
Helper function that converts a string array to a Cell array so it can be rendered with the fromArray function
Parameters:
stringArray (string ) : (array) the array to convert to a Cell array.
Returns: array The Cell array to return.
floatMatrixToCellMatrix(floatMatrix)
Helper function that converts a float matrix to a Cell matrix so it can be rendered with the fromMatrix function
Parameters:
floatMatrix (matrix) : (matrix) the float matrix to convert to a string matrix.
Returns: matrix The Cell matrix to render.
stringMatrixToCellMatrix(stringMatrix)
Helper function that converts a string matrix to a Cell matrix so it can be rendered with the fromMatrix function
Parameters:
stringMatrix (matrix) : (matrix) the string matrix to convert to a Cell matrix.
Returns: matrix The Cell matrix to return.
fromMatrix(CellMatrix, position, verticalOffset, transposeTable, textSize, borderWidth, tableNumRows, blankCellText)
Takes a CellMatrix and renders it as a table.
Parameters:
CellMatrix (matrix) : (matrix) The Cells to be rendered in a table
position (string) : (string) Optional. The position of the table. Defaults to position.top_right
verticalOffset (int) : (int) Optional. The vertical offset of the table from the top or bottom of the chart. Defaults to 0.
transposeTable (bool) : (bool) Optional. Will transpose all of the data in the matrices before rendering. Defaults to false.
textSize (string) : (string) Optional. The size of text to render in the table. Defaults to size.small.
borderWidth (int) : (int) Optional. The width of the border between table cells. Defaults to 2.
tableNumRows (int) : (int) Optional. The number of rows in the table. Not required, defaults to the number of rows in the provided matrix. If your matrix will have a variable number of rows, you must provide the max number of rows or the function will error when it attempts to set a cell value on a row that the table hadn't accounted for when it was defined.
blankCellText (string) : (string) Optional. Text to use cells when adding blank rows for vertical offsetting.
fromMatrix(dataMatrix, position, verticalOffset, transposeTable, textSize, borderWidth, tableNumRows, blankCellText)
Renders a float matrix as a table.
Parameters:
dataMatrix (matrix) : (matrix_float) The data to be rendered in a table
position (string) : (string) Optional. The position of the table. Defaults to position.top_right
verticalOffset (int) : (int) Optional. The vertical offset of the table from the top or bottom of the chart. Defaults to 0.
transposeTable (bool) : (bool) Optional. Will transpose all of the data in the matrices before rendering. Defaults to false.
textSize (string) : (string) Optional. The size of text to render in the table. Defaults to size.small.
borderWidth (int) : (int) Optional. The width of the border between table cells. Defaults to 2.
tableNumRows (int) : (int) Optional. The number of rows in the table. Not required, defaults to the number of rows in the provided matrix. If your matrix will have a variable number of rows, you must provide the max number of rows or the function will error when it attempts to set a cell value on a row that the table hadn't accounted for when it was defined.
blankCellText (string) : (string) Optional. Text to use cells when adding blank rows for vertical offsetting.
fromMatrix(dataMatrix, position, verticalOffset, transposeTable, textSize, borderWidth, tableNumRows, blankCellText)
Renders a string matrix as a table.
Parameters:
dataMatrix (matrix) : (matrix_string) The data to be rendered in a table
position (string) : (string) Optional. The position of the table. Defaults to position.top_right
verticalOffset (int) : (int) Optional. The vertical offset of the table from the top or bottom of the chart. Defaults to 0.
transposeTable (bool) : (bool) Optional. Will transpose all of the data in the matrices before rendering. Defaults to false.
textSize (string) : (string) Optional. The size of text to render in the table. Defaults to size.small.
borderWidth (int) : (int) Optional. The width of the border between table cells. Defaults to 2.
tableNumRows (int) : (int) Optional. The number of rows in the table. Not required, defaults to the number of rows in the provided matrix. If your matrix will have a variable number of rows, you must provide the max number of rows or the function will error when it attempts to set a cell value on a row that the table hadn't accounted for when it was defined.
blankCellText (string) : (string) Optional. Text to use cells when adding blank rows for vertical offsetting.
fromArray(dataArray, position, verticalOffset, transposeTable, textSize, borderWidth, blankCellText)
Renders a Cell array as a table.
Parameters:
dataArray (Cell ) : (array) The data to be rendered in a table
position (string) : (string) Optional. The position of the table. Defaults to position.top_right
verticalOffset (int) : (int) Optional. The vertical offset of the table from the top or bottom of the chart. Defaults to 0.
transposeTable (bool) : (bool) Optional. Will transpose all of the data in the matrices before rendering. Defaults to false.
textSize (string) : (string) Optional. The size of text to render in the table. Defaults to size.small.
borderWidth (int) : (int) Optional. The width of the border between table cells. Defaults to 2.
blankCellText (string) : (string) Optional. Text to use cells when adding blank rows for vertical offsetting.
fromArray(dataArray, position, verticalOffset, transposeTable, textSize, borderWidth, blankCellText)
Renders a string array as a table.
Parameters:
dataArray (string ) : (array_string) The data to be rendered in a table
position (string) : (string) Optional. The position of the table. Defaults to position.top_right
verticalOffset (int) : (int) Optional. The vertical offset of the table from the top or bottom of the chart. Defaults to 0.
transposeTable (bool) : (bool) Optional. Will transpose all of the data in the matrices before rendering. Defaults to false.
textSize (string) : (string) Optional. The size of text to render in the table. Defaults to size.small.
borderWidth (int) : (int) Optional. The width of the border between table cells. Defaults to 2.
blankCellText (string) : (string) Optional. Text to use cells when adding blank rows for vertical offsetting.
fromArray(dataArray, position, verticalOffset, transposeTable, textSize, borderWidth, blankCellText)
Renders a float array as a table.
Parameters:
dataArray (float ) : (array_float) The data to be rendered in a table
position (string) : (string) Optional. The position of the table. Defaults to position.top_right
verticalOffset (int) : (int) Optional. The vertical offset of the table from the top or bottom of the chart. Defaults to 0.
transposeTable (bool) : (bool) Optional. Will transpose all of the data in the matrices before rendering. Defaults to false.
textSize (string) : (string) Optional. The size of text to render in the table. Defaults to size.small.
borderWidth (int) : (int) Optional. The width of the border between table cells. Defaults to 2.
blankCellText (string) : (string) Optional. Text to use cells when adding blank rows for vertical offsetting.
debug(message, position)
Renders a debug message in a table at the desired location on screen.
Parameters:
message (string) : (string) The message to render.
position (string) : (string) Optional. The position of the debug message. Defaults to position.middle_right.
Cell
Type for each cell's content and appearance
Fields:
content (series string)
bgColor (series color)
textColor (series color)
align (series string)
colspan (series int)
rowspan (series int)

Crypto Daily WatchList And Screener [M]
Hi, this is a watchlist and screener indicator designed for traders in the field of cryptocurrencies who want to monitor developments in other currency pairs and indices.
The indicator consists of two tables. One of them is the table containing indices such as BTC dominance, total, total2, which allows you to track market developments and changes. In this table, you will find price information, daily change, stochastic, and trend information.
The other table includes cryptocurrencies like BTC/USDT, ETH/USDT, DOT/USDT, and more. In this table, you will see real-time prices, daily volume, daily change, stochastic, the correlation coefficient between the pair and Bitcoin, and the trend value calculated based on MACD.
The "Customize" section in the settings enables you to personalize the appearance of the tables according to your preferences.

Cobra's CryptoMarket VisualizerCobra's Crypto Market Screener is designed to provide a comprehensive overview of the top 40 marketcap cryptocurrencies in a table\heatmap format. This indicator incorporates essential metrics such as Beta, Alpha, Sharpe Ratio, Sortino Ratio, Omega Ratio, Z-Score, and Average Daily Range (ADR). The table utilizes cell coloring resembling a heatmap, allowing for quick visual analysis and comparison of multiple cryptocurrencies.
The indicator also includes a shortened explanation tooltip of each metric when hovering over it's respected cell. I shall elaborate on each here for anyone interested.
Metric Descriptions:
1. Beta: measures the sensitivity of an asset's returns to the overall market returns. It indicates how much the asset's price is likely to move in relation to a benchmark index. A beta of 1 suggests the asset moves in line with the market, while a beta greater than 1 implies the asset is more volatile, and a beta less than 1 suggests lower volatility.
2. Alpha: is a measure of the excess return generated by an investment compared to its expected return, given its risk (as indicated by its beta). It assesses the performance of an investment after adjusting for market risk. Positive alpha indicates outperformance, while negative alpha suggests underperformance.
3. Sharpe Ratio: measures the risk-adjusted return of an investment or portfolio. It evaluates the excess return earned per unit of risk taken. A higher Sharpe ratio indicates better risk-adjusted performance, as it reflects a higher return for each unit of volatility or risk.
4. Sortino Ratio: is a risk-adjusted measure similar to the Sharpe ratio but focuses only on downside risk. It considers the excess return per unit of downside volatility. The Sortino ratio emphasizes the risk associated with below-target returns and is particularly useful for assessing investments with asymmetric risk profiles.
5. Omega Ratio: measures the ratio of the cumulative average positive returns to the cumulative average negative returns. It assesses the reward-to-risk ratio by considering both upside and downside performance. A higher Omega ratio indicates a higher reward relative to the risk taken.
6. Z-Score: is a statistical measure that represents the number of standard deviations a data point is from the mean of a dataset. In finance, the Z-score is commonly used to assess the financial health or risk of a company. It quantifies the distance of a company's financial ratios from the average and provides insight into its relative position.
7. Average Daily Range: ADR represents the average range of price movement of an asset during a trading day. It measures the average difference between the high and low prices over a specific period. Traders use ADR to gauge the potential price range within which an asset might fluctuate during a typical trading session.
Utility:
Comprehensive Overview: The indicator allows for monitoring up to 40 cryptocurrencies simultaneously, providing a consolidated view of essential metrics in a single table.
Efficient Comparison: The heatmap-like coloring of the cells enables easy visual comparison of different cryptocurrencies, helping identify relative strengths and weaknesses.
Risk Assessment: Metrics such as Beta, Alpha, Sharpe Ratio, Sortino Ratio, and Omega Ratio offer insights into the risk associated with each cryptocurrency, aiding risk assessment and portfolio management decisions.
Performance Evaluation: The Alpha, Sharpe Ratio, and Sortino Ratio provide measures of a cryptocurrency's performance adjusted for risk. This helps assess investment performance over time and across different assets.
Market Analysis: By considering the Z-Score and Average Daily Range (ADR), traders can evaluate the financial health and potential price volatility of cryptocurrencies, aiding in trade selection and risk management.
Features:
Reference period optimization, alpha and ADR in particular
Source calculation
Table sizing and positioning options to fit the user's screen size.
Tooltips
Important Notes -
1. The Sharpe, Sortino and Omega ratios cell coloring threshold might be subjective, I did the best I can to gauge the median value of each to provide more accurate coloring sentiment, it may change in the future.
The median values are : Sharpe -1, Sortino - 1.5, Omega - 20.
2. Limitations - Some cryptos have a Z-Score value of NaN due to their short lifetime, I tried to overcome this issue as with the rest of the metrics as best I can. Moreover, it limits the time horizon for replay mode to somewhere around Q3 of 2021 and that's with using the split option of the top half, to remain with the older cryptos.
3. For the beginner Pine enthusiasts, I recommend scimming through the script as it serves as a prime example of using key features, to name a few : Arrays, User Defined Functions, User Defined Types, For loops, Switches and Tables.
4. Beta and Alpha's benchmark instrument is BTC, due to cryptos volatility I saw no reason to use SPY or any other asset for that matter.

Cleaner Screeners LibraryLibrary "cleanscreens"
Screener Panel.
This indicator displays a panel with a list of symbols and their indications.
It can be used as a screener for multiple timess and symbols
in any timeframe and with any indication in any combination.
#### Features
Multiple timeframes
Multiple symbols
Multiple indications per group
Vertical or horizontal layouts
Acceepts External Inputs
Customizable colors with 170 presets included (dark and light)
Customizable icons
Customizable text size and font
Customizable cell size width and height
Customizable frame width and border width
Customizable position
Customizable strong and weak values
Accepts any indicator as input
Only 4 functions to call, easy to use
#### Usage
Initialize the panel with _paneel = cleanscreens.init()
Add groupd with _screener = cleanscreens.Screener(_paneel, "Group Name")
Add indicators to screeener groups with cleanscreens.Indicator(_screener, "Indicator Name", _source)
Update the panel with cleanscreens.display(_paneel)
Thanks @ PineCoders , and the Group members for setting the bar high.
# local setup for methods on our script
import kaigouthro/cleanscreen/1
method Screener ( panel p, string _name) => cleanscreens.Screener ( p, _name)
method Indicator ( screener s , string _tf, string name, float val) => cleanscreens.Indicator ( s , _tf, name, val)
method display ( panel p ) => cleanscreens.display ( p )
init(_themein, loc)
# Panel init
> init a panel for all the screens
Parameters:
_themein (string) : string: Theme Preset Name
loc (int) : int :
1 = left top,
2 = middle top,
3 = right top,
4 = left middle,
5 = middle middle,
6 = right middle,
7 = left bottom,
8 = middle bottom,
9 = right bottom
Returns: panel
method Screener(p, _name)
# Screener - Create a new screener
### Example:
cleanscreens.new(panel, 'Crpyto Screeners')
Namespace types: panel
Parameters:
p (panel)
_name (string)
method Indicator(s, _tf, name, val)
# Indicator - Create a new Indicator
### Example:
cleanscreens.Inidcator('1h', 'RSI', ta.rsi(close, 14))
Namespace types: screener
Parameters:
s (screener)
_tf (string)
name (string)
val (float)
method display(p)
# Display - Display the Panel
### Example:
cleanscreens.display(panel)
Namespace types: panel
Parameters:
p (panel)
indication
single indication for a symbol screener
Fields:
name (series string)
icon (series string)
rating (series string)
value (series float)
col (series color)
tf (series string)
tooltip (series string)
normalized (series float)
init (series bool)
screener
single symbol screener
Fields:
ticker (series string)
icon (series string)
rating (series string)
value (series float)
bg (series color)
fg (series color)
items (indication )
init (series bool)
config
screener configuration
Fields:
strong (series float)
weak (series float)
theme (series string)
vert (series bool)
cellwidth (series float)
cellheight (series float)
textsize (series string)
font (series int)
framewidth (series int)
borders (series int)
position (series string)
icons
screener Icons
Fields:
buy (series string)
sell (series string)
strong (series string)
panel
screener panel object
Fields:
items (screener )
table (series table)
config (config)
theme (theme type from kaigouthro/theme_engine/1)
icons (icons)

Multiple Moving Average ToolkitFeatures Overview:
Multiple Moving Averages: The script allows you to plot up to five different Moving Averages (MAs) on your chart at the same time. You can choose the type of MA (EMA, SMA, HMA, WMA, DEMA, VWMA, VWAP) and the length of each one.
Color Ribbon: You can turn the MAs into a color ribbon by selecting the "Turn into Color Ribbon?" option. This will make the area between the MAs colored and can help you identify trends more easily.
MA Value Table: You can draw a table on your chart that displays the current values of each MA, whether the trend is bullish or bearish along with the length of the MAs. The current ATR value is also shown in the last cell of the table. You can choose the location of the table (Top Left, Top Right, Bottom Left, Bottom Right) and the transparency of the background color.
Crosses: The script can detect when two MAs cross over each other (1st MA crosses 5th MA and vice versa), indicating a potential trend reversal. It will plot crosses on the chart at the point of the crossover and give an alert if the "Bullish Cross Detected" or "Bearish Cross Detected" condition is met.
How to use:
Once the script is added to your chart, you can customize the settings to fit your preferences. You can choose the type and length of each MA, whether to turn them into a color ribbon, whether to plot crosses, and whether to draw the MA Value Table.
The MA Value Table can be moved to a different location on the chart by selecting the "Location of Table" option and choosing Top Left, Top Right, Bottom Left, or Bottom Right.
Watch for MA crossovers and alerts to identify potential trend reversals. The script can help you identify bullish and bearish trends by color-coding the area between the MAs and displaying the current values of each MA in the table.
Breakdown of the script:
User Inputs
The first section of the script defines several user inputs that allows you to customize the indicator. These include options for turning the MAs into a color ribbon, plotting crosses when there is a bullish or bearish cross of the MAs, drawing a table of the MA values, and setting the transparency of the ribbon. You can also select the location of the MA value table and customize the settings for each individual MA.
Moving Average Calculation
The script defines a function called "getMA" that calculates the moving average for a given type and length. The function uses a switch statement to determine which type of moving average to use, such as an exponential moving average (EMA), simple moving average (SMA), Hull moving average (HMA), weighted moving average (WMA), double exponential moving average (DEMA), volume-weighted moving average (VWMA), or volume-weighted average price (VWAP).
The script then calls this function to calculate the values of up to five different MAs, depending on the user input. The ATR (average true range) is also calculated using the TA library.
Color Filter and Cross Detection
The script sets a color filter based on the relationship between the MAs. If the shorter-term MAs are above the longer-term MAs, the filter is set to green to indicate a bullish trend, and if the shorter-term MAs are below the longer-term MAs, the filter is set to red to indicate a bearish trend. You can adjust the transparency of the ribbon to make it more or less visible.
The script also detects when there is a bullish or bearish cross of the MAs and can generate alerts to notify you.
MA Plotting
The script plots up to five MAs on the chart, depending on the user input. The MAs are plotted as lines with different colors and thicknesses, and you can choose to turn them into a color ribbon if desired.
Cross Plotting
The script plots crosses on the chart when there is a bullish or bearish cross of the MAs. The crosses are plotted as X shapes at the location of the cross and are color-coded to indicate the direction of the cross.
MA Value Table
Finally, the script draws a table of the MA values on the chart, displaying the values of each MA as well as the current trend and the ATR. You can customize the location of the table, and the table is colored to match the color filter of the MAs.
Feel free to message me or comment on the post with any questions or issues!
Much more to come!
Thanks for reading, enjoy!

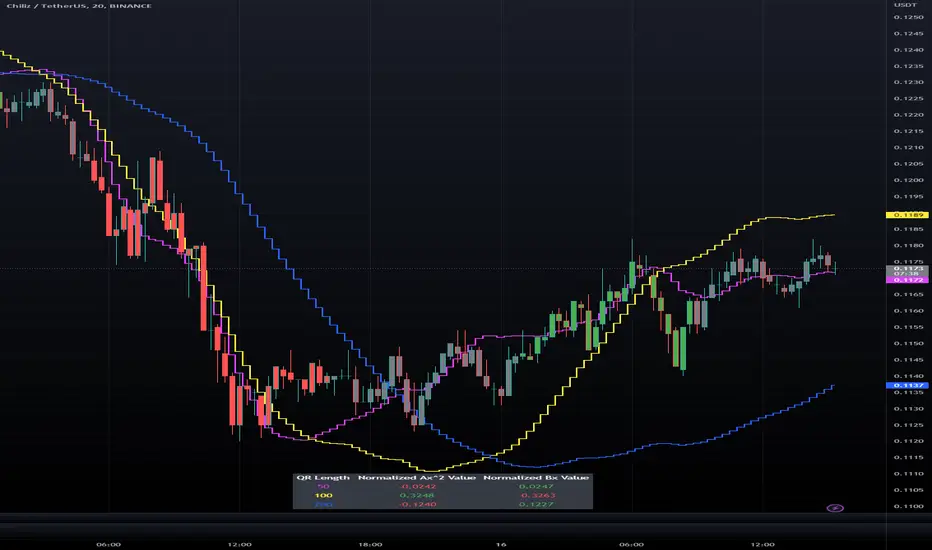
Triple Quadratic Regression (w/ Normalized Value Table)This indicator draws three step lines - a fast (fuchsia), a medium (yellow), and a slow (blue) quadratic regression line to help the user obtain a clearer picture of current trends. Quadratic regression is better suited to determining (and predicting) trend than linear regression; y = ax^2 + bx + c is better to use than a simple y = ax + b. Calculating the regression involves five summation equations that utilize the bar index (x1), the price source (defaulted to ohlc4), the desired lengths, and the square of x1. Determining the coefficient values requires an additional step that factors in the simple moving average of the source, bar index, and the squared bar index.
In addition to the plotted lines, a change in bar color and a table were added. The bar color is influenced by the values of ax^2 and bx of the fast and medium length regressions. If ax^2 and bx for both the fast and medium lengths are above 0, the bar color is green. If they are both under 0, the bar color is red. Otherwise, bars are colored gray. In the table, located at the bottom of the chart (but can be moved), the ax^2 and bx values for each regression length are shown. The option to view normalized (scale of -1 to +1) values or the standard values is included in the indicator settings menu. By default, the normalized values are shown.
MA Band Distance Monitor'MA Band Distance Monitor' indicator is a simple tool for traders who rely on moving averages to make trading decisions. This indicator plots two moving averages of your choice (you can select the type of the moving average), and fills the space between them, creating a "band".
The indicator also generates a table that displays the current price distance from both the fast and slow moving averages, as well as the average of the two. This allows you to quickly assess the strength of the trend and potential entry or exit points.
In addition, the table also shows the average price distance from one to another MA and also the current distance between them, allowing you to compare the current price action to the historical average. This information can help you identify potential trend reversals and assess the overall health of the market.
*** Slow length input must be greater than fast length input, otherwise indicator will produce faulty results

Financials - Comparing CompaniesHello All
For a while I have been working on this indicator to compare financials of the companies and sort them accordingly. Finally I completed and published it. I preferred using new object type feature in Pine language™ and I hope it might be an example and helpful for the developers.
First of all, as we have limitation on security calls, the indicator can get and compare financials for 5 companies only. also Chart time frame must be 1Day or higher! ( I recommend 1Day time frame ). if not then the indicator stops and shows the error message: "Please set the time frame 1Day or higher" . More important than others: You should choose the companies from the same sector! Compare apples to apples :)
The Financials in the indicator:
Earnings Per Share
Price to Earnings Ratio
Price to Sales Ratio
Price to Book Ratio
Profit Margin
Dept to Equity
Current Ratio
Market Capitalization
Also more information shown for each stocks:
Closing Price, sets the color accordingly
2 Simple/Exponential moving average, you can set the length, also it checks if it is rising/falling and sets the color accordingly
Volume info
Average volume (20 days), you can set the period
Currency for each security
Lets see some features in it:
it sorts the companies according to the financials:
If you move the mouse onto any header then it shows explanation about the financial:
You can change location and text size:
You can set the type of Moving averages as SMA or EMA and you can also set the length for both . Headers for both are changed automatically by MA type and length
Colors for Closing price and MA cells are set automatically:
For new Objects in Pine language click here
P.S. You can use this indicator while analyzing the financials of the companies in same sector/industry. So please don't ask for the alerts :)
Enjoy!

Consensus Tables - Oscillators, Multi-MA , DFMA, and IchimokuThis indicator is a series of underlaid tables that determine a consensus value using a simple positive or negative score for a set signal. This consensus value is also shown as a histogram and reflected on the chart's bar colors. There are a total of four different table options to choose from: a set of trend and volume oscillators, a set of 11 moving averages, a set of Fibonacci moving averages and their own consensus line, and a set of Ichimoku-based conditions. The type of table can be chosen from a drop-down menu at the top of the user settings, with settings for each of the table types grouped up respectively.
Oscillator Table:
The Oscillator table consists of the Average Directional Index (ADX) set as a value instead of +/- and is not used in the scoring to gather consensus. Rather, a value of 25 or above is used to confirm the trend regardless of positive or negative. The Chande Momentum Oscillator (CMO), Detrended Price Oscillator (DPO), Momentum, Rate of Change (ROC), Relative Strength Index (RSI), True Strength Index (TSI), and Volume Oscillator are used in the Oscillator table for a consensus value and given a + or - depending on the condition being met. The conditions and weighting are as follows:
-- CMO > or < 0, given a weight of +/- 2
-- DPO > or < 0, given a weight of +/- 2
-- Momentum > or < 0, given a weight of +/- 2
-- ROC > or < 0, given a weight of +/- 2
-- RSI > or < 50, given a weight of +/- 1
-- TSI Value Line > or < 0, given a weight of +/- 1
-- TSI Signal Line > or < 0, given a weight of +/- 1
-- Volume Osc. > or < 0, given a weight of +/- 2
The consensus value is determined by adding these values together and dividing by 13.
Multi-MA Table:
For the Moving Average Ribbon/Multi-MA table the user is able to determine the source, type, and lengths of 11 moving averages. The type selection consists of EMA, DEMA, TEMA, SMA, RMA, VWMA, WMA, SMMA, and a Hull MA. The preset values for the 11 moving averages are 5, 7, 10, 14, 21, 26, 50, 75, 100, 150, and 200. The consensus conditions and weighting are as follows:
-- If MA(1 through 10) < or > the price source, given a weight of +/- 1
-- If MA(11) < or > the price source, given a weight of +/- 2
The consensus value is determined by adding these values together and dividing by 12.
DFMA Table:
The Democratic Fibonacci Moving Average table is derived from our indicator of the same name. The source for the DFMA can be chosen by the user, but the SMA lengths are predetermined in Fibonacci intervals from 3 to 233. The DFMA line itself is determined by finding the average value of these 10 Fibonacci MA lengths. The consensus conditions and weighting are as follows:
-- If Fib. MA (3-233) < or > the source, given a weight of +/- 1
-- If DFMA value < or > the source, given a weight of +/- 2
The consensus value is determined by adding these values together and dividing by 12.
Ichimoku Table:
The Ichimoku table values a handful of conditions using the Tenkan-sen/Conversion Line, Kijun-sen/Base Line, Senkou-span A and B, and the Chikou-span, each of which are given their standard values of 9, 26, 52, and 26, respectively, but can be changed in the user settings if desired. As opposed to the other tables, there are fewer conditions to be met and given values to. All of the conditions are given the same weighting (+/- 1). The conditions are as follows:
-- Kijun-sen < or > the source
-- Tenkan-sen < or > the source
-- Kijun-sen > or < the Chikou-span
-- Tenkan-sen > or < the Kijou-sen
-- Senkou Span A > or < Senkou Span B
The consensus value is determined by dividing the total value by 5.
Overall consensus and overall trend values are given alongside each of these options. The overall consensus value is determined by taking the average of the 4 respective consensus values. Trend values are determined as such:
-- If consensus value >= 0.75, considered a "Strong Buy"
-- If consensus value is between 0.25 and 0.75, considered a "Buy"
-- If consensus value is between 0.25 and -0.25, considered "Neutral"
-- If consensus value is between -0.25 and -0.75, considered a "Sell"
-- If consensus value is <= -0.75, considered a "Strong Sell"
Table colors are set as either green, red, or gray to reflect positive, negative, and neutral sentiment sentiment. Bar colors reflect the consensus value and the determined table trend:
-- If trend for the chosen table is "Strong Buy", bar color is green
-- If trend for the chosen table is "Buy", bar color is lime
-- If trend for the chosen table is "Neutral", bar color is gray
-- If trend for the chosen table is "Sell", bar color is orange
-- If trend for the chosen table is "Strong Sell", bar color is red

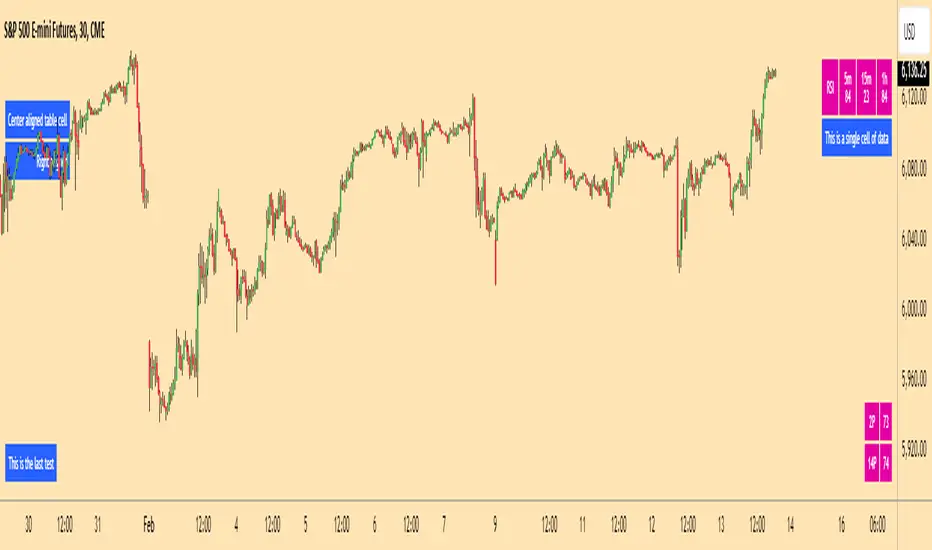
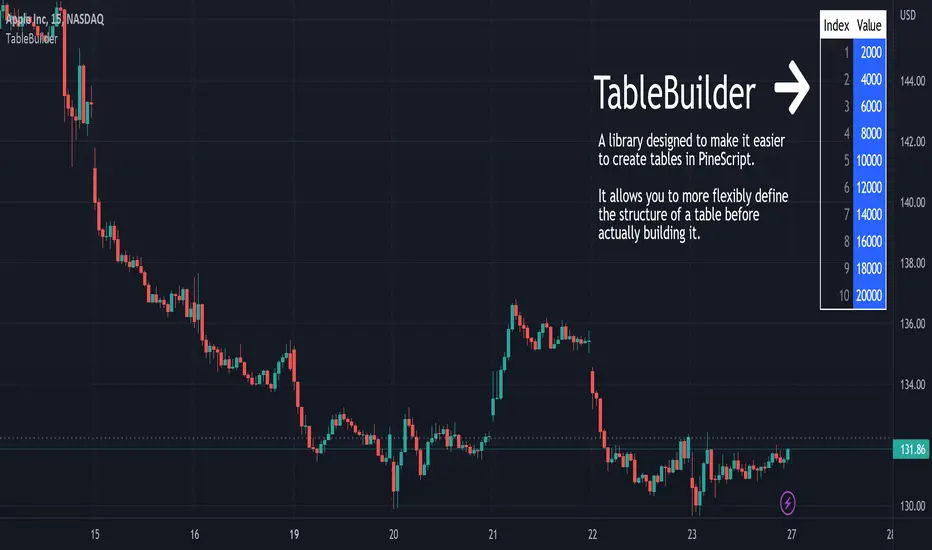
TableBuilderTableBuilder is a library designed to make it easier to create tables in PineScript.
It allows you to more flexibly define the structure of a table before actually building it.
Features:
Style inheritance: styles are inherited from Table, to Column, to Row, and then Cell.
Columns are useful for propagating/reusing style but they are not required.
Add rows with different numbers of cells. The resultant number of columns in the table will be determined by the max number of cells vs the number of defined columns.
Auto text color: Instead of having to set the font color for every cell, the color is automatically determined by the luminosity of the background color.
See the 'Demo' section of the code for an example.
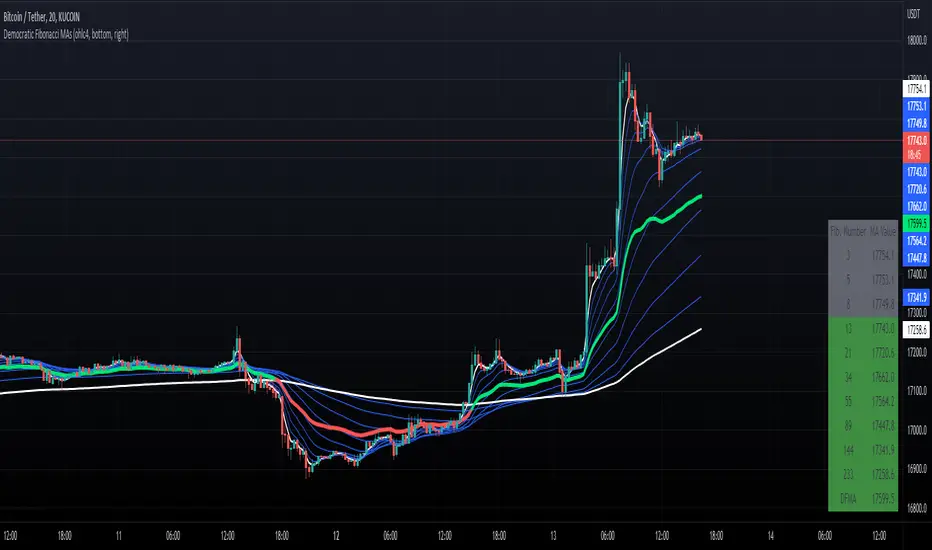
Democratic Fibonacci Moving AveragesWith this indicator, we have taken moving averages at Fibonacci lengths (3 to 233) as well as the average of these values, labeled the DFMA. Additionally, these values have been inputted into a table overlay. The cross of the FibMA(233) and the DFMA can be used as a signal for long or short.
The FibMA lengths of 3 and 233 are plotted in white by default, the FibMAs with lengths between 3 and 233 are plotted in blue by default, and the democratic line (DFMA) that averages these lines is plotted in green or red (depending on if the value is above or below the 233-length FibMA).
Oasis Trading Group: Correlation Table The Correlation Table is an indicator that is used to measure the Correlation Coefficient of multiple assets at the same time in an easy to read table.
A quick introduction into reading a Correlation Coefficient:
A strong positive correlation (one asset moves in one direction the other asset also moves in the same direction) = +1.00
A strong negative correlation (one asset moves in one direction the other asset moves in the opposing direction) = -1.00
Typically you would like to see the correlation strength to be greater than 0.7 or less than -0.7 for there to be a tradable correlation. A reading close to zero would not offer optimal trade entries.
The other data the indicator is showing is the overall trend. This reading is a simple calculation based on the correlation length the user inputs, the indicator will determine if price action is trending up or down based on this length.
The indicator has a reading for the current timeframe that is on the chart and also a second timeframe which is defaulted to the daily.
This indicator is an add-on to the and I hope to have more updates coming soon.
For Access or Questions: Private message us. Thank you.

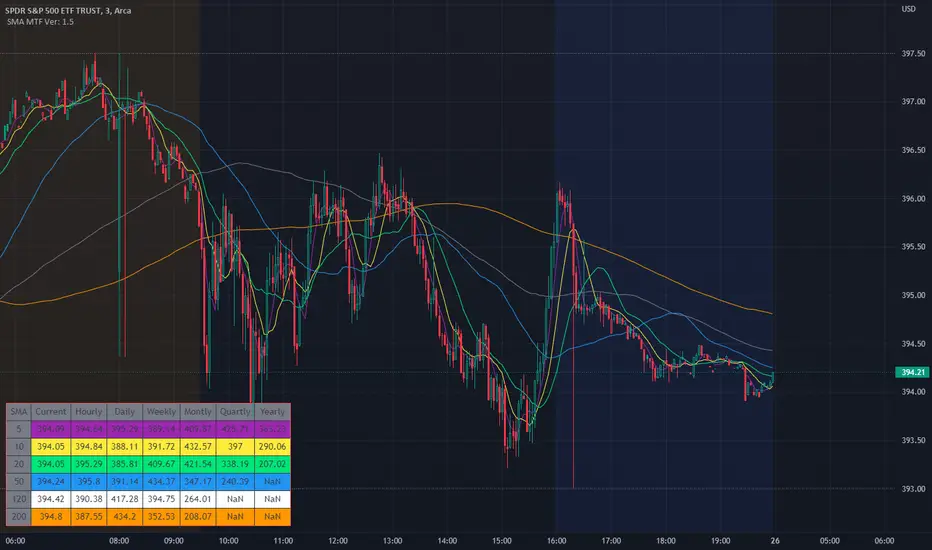
Multiple Moving Avg MTF TableThis script replaces the other script that was just the SMAs that where in a Multi Time Frame Table as this was a redo of that one and this one is SO MUCH MORE!!!!
Not only does this one do the Simple Moving Avg 5, 10, 20, 50, 120, 200 into a table that shows Current/Hourly/Daily/Weekly/Monthly/Quarterly ( 3M )/ Yearly. It now does Exponential Moving Avg , Weighted Moving Avg , and Volume Weight Moving Avg along with Simple Moving Avg.
I still use this script so that you can quickly capture the values so that short-term, and long-term resistance and support can be determined during market hours. Even better now you can select between SMA / EMA / WMA /or VWMA .
imgur.com
The table will change to the values based on the Choice of the type of Moving Avg and if you change the default values.
Now it will take a little bit for the table to show up, so please be patient. I have tested it with stocks, forex, and crypto.

SMA Multi Time Frame Table V1.5Since I couldn't find a script like this I made one so here is what it does.
The script will plot on the chart as well as post the related data into the table.
The default Simple Moving Avg are 5, 10, 20, 50, 120, 200 which can also be changed to whatever SMA you would like. The SMA values are then plotted on the charts so that quickly check to see where they are and how the candles are reacting to the SMAs.
Not only does the script plot the SMAs but it also places higher time frames into the table that is in the script, from current price, to daily, weekly, monthly, quarterly (3 months if you don't have it added) and yearly. The reason why was it price action of the stock does interact and can be rejected or find support from SMA on a higher time frames.
I still use this script so that you can quickly capture the values so that short-term, and long-term resistance and support can be determined during market hours.
Another good thing is that when you change the values in the script settings it also applies those settings to the table as well.
Now it will take a little bit for the table to show up, so please be patient. I have tested it with stocks, forex, and crypto.
I wanted to get this published and I am still working on the background to try and get EMAs. Where you can flip over to EMA to also see the EMA plots and table values for the MTF.
Financials Info by zdmreFundamentals provide a method to set the financial value of a company, security, or currency. Included in fundamental analysis is basic qualitative and quantitative information that contributes to the asset's financial or economic well-being. Macroeconomic fundamentals include topics that affect an economy at large. Microeconomic fundamentals focus on the activities within smaller segments of the economy. For businesses, information such as profitability, revenue, assets, liabilities, and growth potential are considered fundamentals
!!! When you change the values in the filter, you will see that the colors in the table change.
!!! Intrinsic Value Explained
There is no universal standard for calculating the intrinsic value of a company. The formula here is a partially differentiated version of the Ben Graham formula.
Formula;
Intrinsic value = Earning Per Share * MultiplierbySpecialRate * AveragePricetoEarnings * Power(Multiplier by SpecialRate, DiscountYear) * USMoneySupply2 / Power((1 + DiscountRate), DiscountYear) * USMoneySupply0
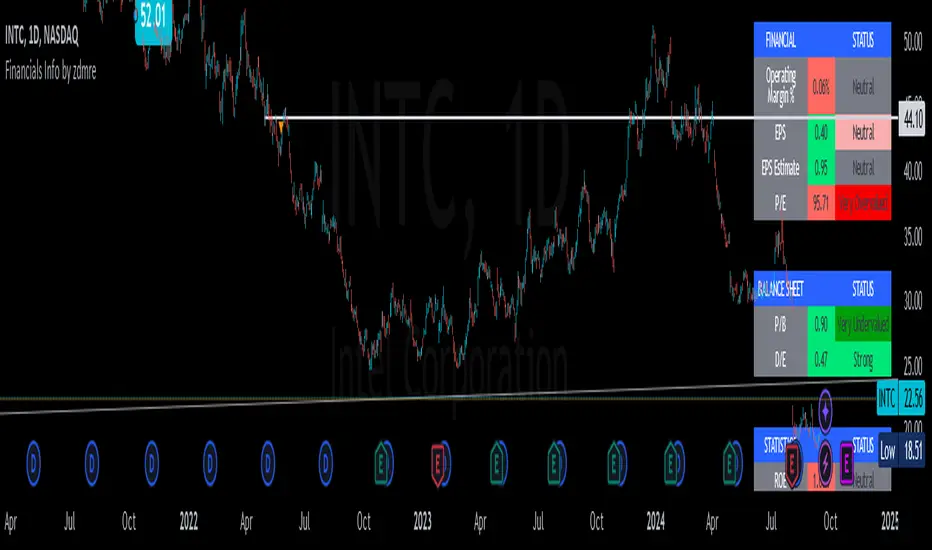
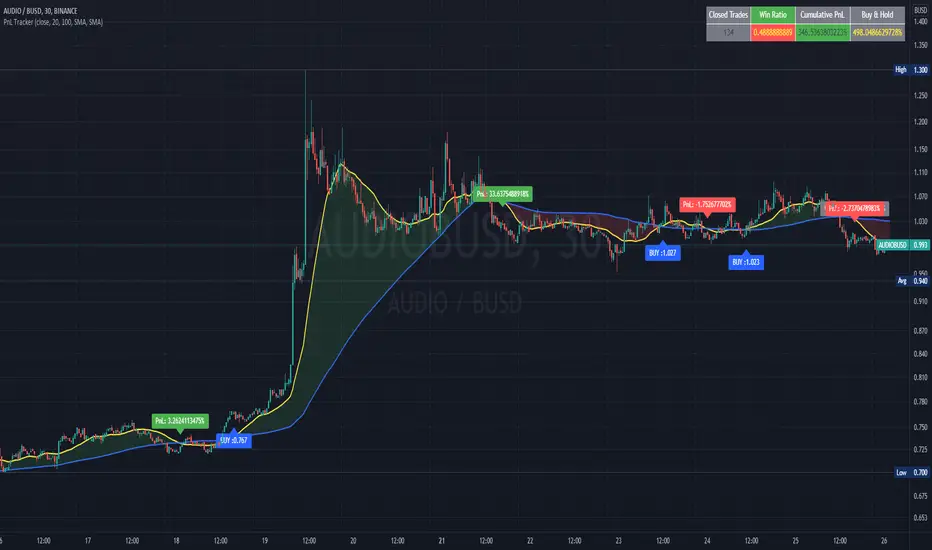
PnL and Buy & Hold TrackerIn this script I use a simple, not necessarily profitable, strategy of a cross of MAs to teach how to calculate and plot the PnL of each trade made by the indicator. I also show how to calculate the cumulative PnL of all trades and the Buy and Hold of the same period.
These calculations which are natively available in any strategy script, require a bit of resourcefulness to work in an indicator script.
It can be very useful to optimize parameters for the best performance of an indicator-based strategy.
I use variables to store the price of the asset at each buy signal to calculate the PnL with the closing price of that particular trade and another variable to store the price value of the first trade, which calculates the Buy and Hold percentage with the current price of the asset.
I plot the values of the trades in labels and the accumulated values in a table.
I also show how to calculate and plot the unrealized PnL of open trades.
Swing Dream - PAINT BARS | MA | EMA | DMA | VWAP | TABLE | ADR %- Swing Dream -
Script created for breakout-swing traders, in the style of QullaMaggie * , Dan Zanger, Oliver Kell, and Stockbee.
The following indicators are used by most successful breakout-swing traders such as mentioned above.
(As published) it contains:
Painted Bars, also known as inside/outside candles. Used for candle analysis and to determine breakout pivots & levels. For instance; use it in different timeframes and seek formations (ex, 3-1-2). For further inspiration, study Rob Smith's The Strat .
MA, Simple Moving Averages (Basic levels = 10,20,50,200). Use this indicator to define resistance/support areas as well as the overall long/swing-term trend. In breakout strategies such as EP, Flags, etc this can be used for trailing stops; an example, post-breakout, let the price ride the 20ma before exiting your position.
EMA, Exponential Moving Averages with periods inspired by Qullamaggie (10,20,65). Use this on shorter timeframes (ex, 1h) and for the same principles as MAs.
VWAP, Volume-Weighted Average Price. As for the previous, utilize this as a level indicator to find areas of resistance/support. Good for swing-trading as it implies whenever holders are profitable or not.
DMA, Displaced Moving Average (Horizontal). Personally, I use this a lot. Works very well for trailing stops (post breakout) and "bounce" areas. Choose your own offset and period.
ADR%, Average Daily Range Percentage. Displayed in the table and used to define a symbol's volatility. A very good tool for Qullamaggie-style trading. Personally, I try to find setups with over 6% ADR. Basic definition; low ADR% = Increased chance of a symbol to move slower and in smaller ranges. A higher value equals the opposite.
Table. A table with basic symbol-related information. Could save you plenty of time whenever you scan or search for new swing setups. Looking to add more features here.
Why should you use this script? Well, instead of having tens of different indicators, use this script and combine everything together with EP, Flag, or breakout principles. Suited for every plan, and more efficient in my opinion.
View settings to turn on/off different indicators.
* If you're looking for an introduction and further explanation of how Qullamaggie uses mentioned indicators, I could recommend checking out his website, stream, or participation in "Chat With Traders".
At last, I want to credit: @jkcqld @neolao @TheScrutiniser
This Script will get updated and improved.
// TechFille006

MTF - Options Strike Price - Screener & AlertsHi fellow traders ,
Pleased to share an MTF – Option Strike Price Screener.
It Screens 15 tickers for your set Strike Prices in the input column or you can also set the Stop Loss/target prices for your portfolio watch list in a single input window.
All you need to do is attach to any chart and set the periodicity of the to your desired alert() frequency requirement.
Now go to the input settings icon of the script and set your tickers, timeframe and option strike prices or if you would like to track your individual ticker stop loss or target prices!
Set the alert from the menu as usual click - Any alert() function call and bingo you are done!!
In all of 2-3 minutes you can set your Option Strike Alerts or TP’s or SL’s for 15 stocks of your portfolio..
Only a single alert() will track 15 tickers across multiple time frames..
Once your Alert is hit you may need to change the input settings and save as default and again set an alert() and delete the last alert()..
No more opening multiple charts and setting individual time consuming alerts().
Happy trading with TV..