Hardwaybets Strat Market Checklist Trading## **Hardwaybets TheStrat Market Checklist Engine**
**A Checklist-Driven TheStrat Trading**
---
### **Overview**
This script is an **informational market context and permission framework** designed to help users **organize structural and liquidity information** in a clear, checklist-based format.
It evaluates **price context only** and displays the results in a table.
It does **not** generate trade signals or trading instructions.
---
### **What This Script Does**
The indicator evaluates and displays:
* Nearest prior **Area of Interest (AOI)**
(Previous Day High/Low or Previous Week High/Low)
* Higher-timeframe structural bias (Daily & Weekly)
* Proximity to liquidity
* Liquidity behavior (acceptance vs rejection)
* **Strat pattern classification only** (12 canonical patterns)
* A final **permission state** based on the above conditions
All information is presented as **contextual reference data**, not execution guidance.
---
### **What This Script Does NOT Do**
* ❌ No buy or sell signals
* ❌ No arrows, markers, or execution prompts
* ❌ No entries, exits, stops, or targets
* ❌ No performance metrics or profitability claims
* ❌ No strategy or backtesting logic
The word **“TRADE”** in the dashboard refers to **permission status only**, not a recommendation to trade.
---
### **Dashboard Modes**
* **Full Mode**: displays AOI price and distance (points & ticks)
* **Compact Mode**: minimal checklist view for reduced screen usage
Both modes are **informational only**.
---
### **Pattern Classification**
The script identifies and labels Strat candle pattern **types only**, including:
* Reversal patterns
* Continuation patterns
* Compression patterns
* Expansion patterns
Pattern labels are **descriptive classifications**, not signals or instructions.
---
### **Intended Use**
This script is intended to be used as a **contextual reference tool** alongside a user’s own analysis, rules, or education.
It may be useful for:
* Market structure study
* Liquidity behavior observation
* Pattern classification review
* Educational purposes
---
### **Technical Notes**
* Pine Script® v6
* Uses completed candles only
* No repainting logic
* No future data access
* Table-based UI only
---
### **Disclaimer**
This indicator is provided **for educational and informational purposes only**.
The author does not provide financial advice, trading recommendations, or execution guidance.
All trading decisions remain the sole responsibility of the user.
---
### **Conceptual Attribution**
This script is inspired by publicly available market structure concepts commonly referred to as “The Strat” methodology.
No proprietary or paid content is included.
---
### **Feedback**
Constructive feedback and suggestions are welcome.
Please note that this script is intentionally **non-signaling by design**.
Thestrathelper

STRAT - MTF Dashboard + FTFC + Reversals v2.7# STRAT Indicator - Complete Description
## Overview
A comprehensive multi-timeframe STRAT trading system indicator that combines market structure analysis, flip levels, Full Timeframe Continuity (FTFC), and reversal pattern detection across 12 timeframes.
## Core Features
### 1. **Multi-Timeframe STRAT Dashboard**
- Displays STRAT combos (1, 2u, 2d, 3) across 12 timeframes: 1m, 5m, 15m, 30m, 1H, 4H, 12H, Daily, Weekly, Monthly, Quarterly, Yearly
- Color-coded directional bias (green/red/doji)
- Inside bars (●) and Outside bars (●) highlighted
- Current timeframe marked with ★
### 2. **HTF Flip Levels with Smart Grouping**
- Displays higher timeframe (HTF) flip levels (open prices) as labels on the right side
- Automatically groups multiple timeframes at the same price level (e.g., "★ 1H/4H/D")
- Current timeframe flip level always displayed with ★ marker
- Color-coded: Green (above price) / Red (below price)
### 3. **Full Timeframe Continuity (FTFC)**
- User-selectable 4 timeframes for FTFC analysis (default: D, W, M, Q)
- Green line: FTFC Up (highest open of 4 timeframes)
- Red line: FTFC Down (lowest open of 4 timeframes)
- Identifies when price is above/below all 4 timeframe opens
### 4. **Hammer & Shooting Star Detection**
- **Hammer Pattern**: Long lower wick (≥2x body), small upper wick, signals potential bottom reversal
- **Shooting Star Pattern**: Long upper wick (≥2x body), small lower wick, signals potential top reversal
- Scans last 100 bars (adjustable) and marks ALL historical patterns
- Chart markers: 🔨 (Hammer) below bars, 🔻 (Shooting Star) above bars
- Dashboard column shows reversal patterns for each timeframe
- Adjustable wick-to-body ratio sensitivity (1.5 to 5.0)
### 5. **Debug Tables**
- **FTFC Debug**: Shows close vs. 4 timeframe opens, confirms all-green/all-red conditions
- **Reversal Debug**: Real-time analysis of current bar - body size, wick measurements, ratios, and pattern qualification
## Settings
### Display Settings
- Dashboard position (9 options: top-left to bottom-right)
- Dashboard text size (tiny to huge)
- Label offset and text size
- Toggle individual features on/off
### FTFC Settings
- Select 4 custom timeframes for continuity analysis
- Default: Daily, Weekly, Monthly, Quarterly
### Reversal Settings
- **Wick to Body Ratio**: Sensitivity for pattern detection (default 2.0)
- **Lookback Bars**: How many historical bars to scan (default 100, max 500)
- Show/hide reversal markers on chart
- Show/hide reversal debug table
## Use Cases
1. **Momentum Trading**: Identify STRAT setups (2-2, 2-1-2 reversals, 3-bar plays) across multiple timeframes
2. **Swing Trading**: Use HTF flip levels as support/resistance and FTFC for trend confirmation
3. **Reversal Trading**: Catch hammer/shooting star patterns at key levels for counter-trend entries
4. **Multi-Timeframe Analysis**: Confirm alignment across timeframes before entering trades
## How to Use
### For STRAT Traders
- Look for 2-1-2 reversal setups in the dashboard
- Watch for inside bars (●) at HTF flip levels for breakout trades
- Use outside bars (●) to identify potential volatility expansion
### For Reversal Traders
- 🔨 Hammers after downtrends = potential long entries
- 🔻 Shooting stars after uptrends = potential short entries
- Combine with HTF flip levels for high-probability setups
### For Trend Followers
- FTFC green line above = bullish structure
- FTFC red line below = bearish structure
- Enter when price breaks and holds above/below FTFC levels
## Visual Elements
- **Green Labels**: HTF flip levels above current price (resistance)
- **Red Labels**: HTF flip levels below current price (support)
- **Lime Line**: FTFC Up (highest timeframe open)
- **Red Line**: FTFC Down (lowest timeframe open)
- **🔨 Icon**: Hammer pattern (potential reversal up)
- **🔻 Icon**: Shooting Star pattern (potential reversal down)
- **★ Symbol**: Current timeframe or multiple timeframes grouped
## Performance Notes
This indicator performs 12 multi-timeframe security calls and may take 15-30 seconds to calculate on initial load. This is normal for comprehensive MTF analysis.
## Version
v2.7 - Simplified reversal detection, current TF labeling, optimized performance
---
**Perfect for**: STRAT traders, multi-timeframe analysts, reversal pattern traders, swing traders looking for high-probability setups with confluence across timeframes.

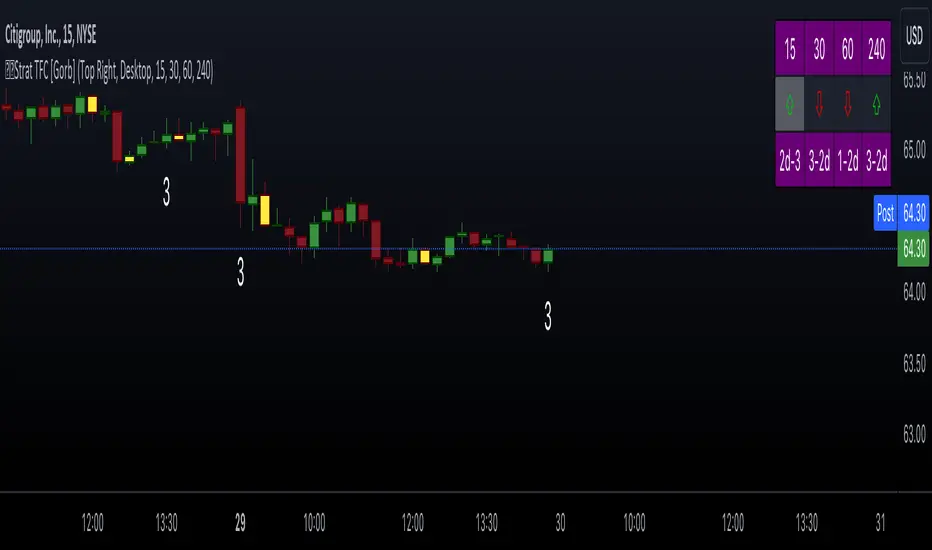
The Strat with TFC & Combo DashIntroduction:
This indicator is designed to implement "The Strat" trading strategy combined with a Timeframe Continuity Dashboard and Combo Dashboard. The Strat is a robust trading methodology that relies on price action and candlestick formations to make trading decisions. This script helps traders to identify specific bar types such as Inside Bars (1), Continuation Up Bars (2u), Continuation Down Bars (2d), and Outside Bars (3) across multiple timeframes. It visually highlights these bar types on the chart and provides a comprehensive dashboard displaying the current state of the selected timeframes.
Key Features:
Timeframe Continuity Dashboard: Displays arrows and bar types for up to four selected timeframes.
Strat Combos Dashboard: Shows the previous and current bar types to easily spot trading setups.
Customizable Colors and Labels: Options to personalize the colors and labels for Inside and Outside bars.
Adjustable Dashboard Position and Size: Allows users to set the location and size of the dashboard for better visual alignment.
Inputs:
TFC & Combo Dash Configuration:
Show TFC & Combo Dashboard: Toggle to display the dashboard.
Show Strat Combos: Toggle to display Strat combo setups.
Location: Dropdown to select the position of the dashboard on the chart.
Size: Dropdown to choose between desktop and mobile view.
Timeframe Selection:
Timeframe 1: Primary timeframe for analysis.
Timeframe 2: Secondary timeframe for analysis.
Timeframe 3: Tertiary timeframe for analysis.
Timeframe 4: Quaternary timeframe for analysis.
Candle Visuals:
Show Inside Bar Label: Option to show label instead of color for Inside bars.
Inside Bar Color: Color picker for Inside bars.
Show Outside Bar Label: Option to show label instead of color for Outside bars.
Outside Bar Color: Color picker for Outside bars.
TFC & Combo DashboardFunctions:
The script fetches values for the selected timeframes and computes the bar types and corresponding visual elements such as arrows and background colors. The dashboard displays this information in a tabular format for easy reference during trading.
The dashboard is dynamically created based on user input for position and size. It shows the selected timeframes, bar types, and combo setups, providing a quick overview of the market conditions across multiple timeframes.
Timeframes: Displays the four user chosen timeframes that the dashboard fetches data from.
Arrow and Color: Functions to set the arrow direction and color based on current bar action. Green and up arrow: price is above it's candle open.
Red and down arrow: price is below it's candles open.
Background Color: Functions to set background color based on the bar type. White for an outside bar(3), yellow for an inside bar(1), no color for a continuation bar(2).
Strat Candle Combos: Functions to determine if the bar is an Inside(1), Continuation Up(2u), Continuation Down(2d), or Outside bar(3). Shows the previous bar and the current bar for the user's chosen timeframes.
Candle Visuals:
The script plots labels and colors for Inside and Outside bars based on user preferences. It helps in quickly identifying potential trading setups on the chart.
Conclusion:
We believe in providing user-friendly tools to help speed up traders technical analysis and implement easy trading strategies. The Strat with TFC & Combo Dashboard is a tool to assist traders in identifying potential trading setups based on The Strat methodology; to suit the users needs and trading style.
RISK DISCLAIMER
All content, tools, scripts & education provided by Gorb Algo LLC are for informational & educational purposes only. Trading is risk and most lose their money, past performance does not guarantee future results.
The Strat with Continuity [starlord_xrp]This indicator shows entry and exit points for The Strat as well as potential setups. It also has full time frame continuity detection.

The Strat [LuxAlgo]The Strat indicator is a full toolkit regarding most of the concepts within "The Strat" methodology with features such as candle numbering, pivot machine gun (PMG) highlighting, custom combo highlighting, and various statistics included.
Alerts are also included for the detection of specific candle numbers, custom combos, and PMGs.
🔶 SETTINGS
Show Numbers on Chart: Shows candle numbering on the chart.
Style Candles: Style candles based on the detected number. Only effective on non-line charts and if the script is brought to the front.
🔹 Custom Combo Search
Combo: User defined combo to be searched by the script. Combos can be composed of any series of numbers including (1, 2, -2, 3), e.g : 2-21. No spaces or other characters should be used.
🔹 Pivot Machine Gun
Show Labels: Highlight detected PMGs with a label.
Min Sequence Length: Minimum sequence length of consecutive higher lows/lower highs required to detect a PMG.
Min Breaks: Minimum amount of broken previous highs/lows required to detect a PMG.
Show Levels: Show levels of the broken highs/lows.
🔹 Pivot Combos
Pivot Lookback: Lookback period used for detecting pivot points.
Right Bars Scan: Number of bars scanned to the right side of a detected pivot.
Left Bars Scan: Number of bars scanned to the left side of a detected pivot.
🔹 Dashboard
Show Dashboard: Displays statistics dashboard on chart.
Numbers Counter: Displays the numbers counter section on the dashboard.
Pivot Combos: Displays pivots combo section on the dashboard.
%: Display the percentage of detected pivot combos on the dashboard instead of absolute numbers.
Pivot Combos Rows: Number of rows displayed by the "Pivots Combo" dashboard section.
Show MTF: Showa MTF candle numbering on the dashboard.
Location: Location of the dashboard on the chart.
Size: Size of the displayed dashboard.
🔶 USAGE
This script allows users with an understanding of The Strat to quickly highlight elements such as candle numbers, pivot machine guns, and custom combos. The usage for these concepts is given in the sub-sections below.
🔹 Candle Numbers
The Strat assigns a number to individual candles, this number is determined by the current candle position relative to the precedent candle, these include:
Number 1 - Inside bar, occurs when the previous candle range engulfs the current one.
Number 2 Up - Upside Directional Bar, occurs when the current price high breaks the previous high while the current low is lower than the previous high.
Number 2 Down - Downside Directional Bar, occurs when the current price low breaks the previous low while the current high is higher than the previous low.
Number 3 - Outside bar, occurs when the current candle range engulfs the previous one.
The script can highlight the number of a candle by using labels but can also style candles by depending on the candle number. Inside bars (1) only have their candle wick highlighted, directional bars (2) (-2) only have their candle body highlighted. Outside bars have their candle range highlighted.
Note that downside directional bars are highlighted with the number -2.
Users can see the total amount of times a specific candle number is detected on the historical data on the dashboard available within the settings, as well as the number of times a candle number is detected relative to the total amount of detected candle numbers expressed as a percentage.
It is also possible to see the current candle numbers returned by multiple timeframes on the dashboard.
🔹 Searching For Custom Combos
Combos are made of a sequence of two or more candle numbers. These combos can highlight multiple reversals/continuation scenarios. Various common combos are documented by The Strat community.
This script allows users to search for custom combos by entering them on the Combo user setting field.
When a user combo is found, it is highlighted on the chart as a box highlighting the combo range.
🔹 Pivot Combos
It can be of interest to a user to display the combo associated with a pivot high/low. This script will highlight the location of pivot points on the chart and display its associated combo by default. These are based on the Pivot Combo lookback and not displayed in real-time.
Users can see on the dashboard the combos associated with a pivot high/low, these are ranked by frequency.
🔹 Pivot Machine Gun (PMG)
Pivot Machine Guns (PMG)s describe the scenario where a single price variation breaks the value of multiple past successive higher lows/lower highs. This can highlight a self-exciting behavior, where even more past successive higher lows/lower highs get broken.
Users can select the minimum sequence length of successive higher lows/lower highs required for a PMG to be detected, as well the amount of these successive higher lows/lower highs that must be broken.

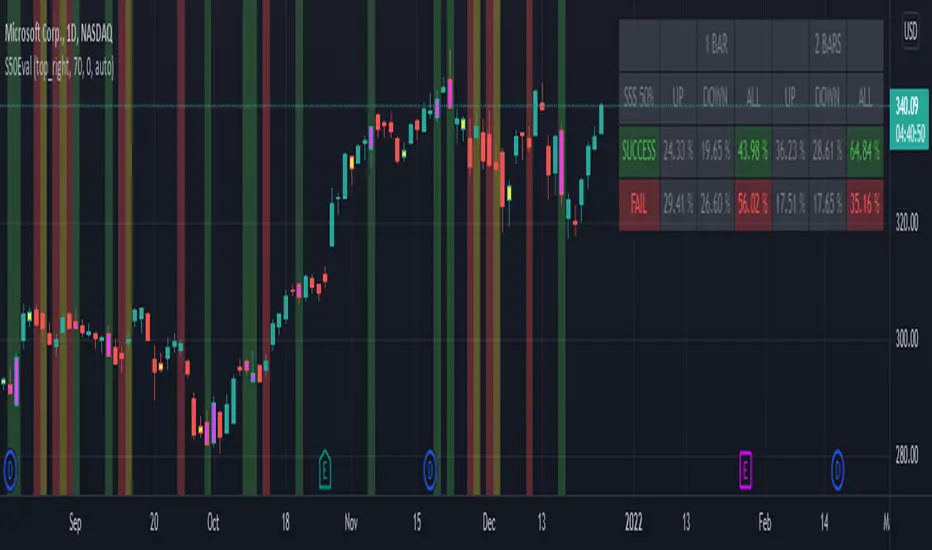
[BM] SSS 50% Rule EvaluatorSara Strat Sniper 50% Rule Evaluator
█ OVERVIEW
This indicator is based on Sara Strat Sniper's - 50% Rule for trading Outside Bars and helps you to evaluate the historical success rate of that rule.
█ FEATURES
Calculation
• You can choose to evaluate only the current bar to see if it forms an outside bar (success) or not (fail), but you can also choose to include the next bar to see if that one forms a compound outside bar.
• You can enable a start and/or end date to limit the calculation period.
Table
• Show or hide the table with the calculation results.
• Show or hide the calculation details (up/down data).
• Position of the table, opacity, cell width and text size can be customized.
Colors
• Table colors can be customized.
• You can choose to show the inside/outside bars in customizable bar colors.
• You can choose to identify successful/failed/recovered outside bars in customizable background colors.
█ LIMITATIONS
• This script uses a special characteristic of the `security()` function allowing the inspection of intrabars — which is not officially supported by TradingView.
• Intrabar inspection only works on some chart timeframes: 5, 10, 15, 30, 45 and 195 minutes, 1, 2, 3, 4, 5, 6, 7 and 8 hours, 1, 2, 3, 4 and 5 days, 1, 2, 3 and 4 weeks, 1, 2, 3, 4, 5, 6, 7, 8, 9, 10, 11 and 12 months. The script’s code can be modified to run on other resolutions.
• There is a limit to how far back intrabar calculations can be performed, and is dependant on both the intrabar resolution and your subscription (which determines the number of available bars).