SupercurveGives out top n bottom with the curve its very accurate in any time frame . Will be paid only in few weeks do try it .
TOP

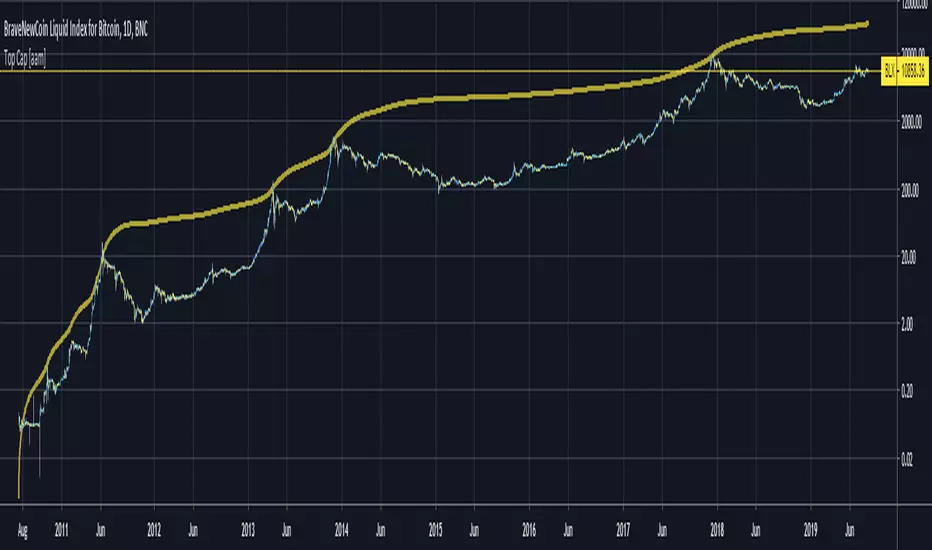
Top Cap [aamonkey]Historically matched market tops for BTC.
It's the Average Cap (see my other indicator) multiplied by 35.
The default settings are for BTC.
If you want to test this indicator on another chart you have to change the launch date settings (and maybe play around with the multiplier).
Some Interesting Launch dates:
- BTC: 3 JAN 2009
- ETH: 30. JUL 2015
- LTC: 7. OCT 2011
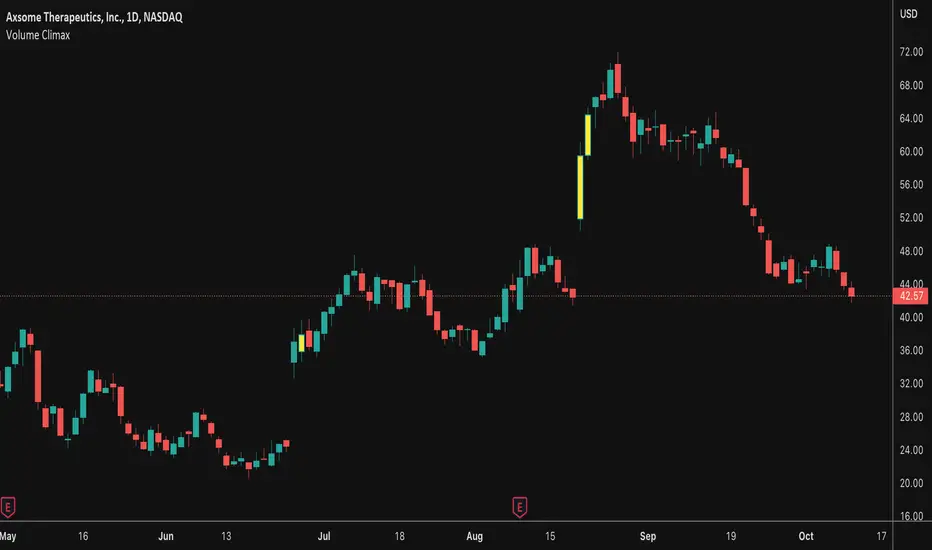
Volume ClimaxThis indicator couples RSI oversold and overbought regions with unusual volume . Often times you will see the final leg of a trend exhaust itself with this volume climax. This indicator is meant to help spot these instances.
User has the ability to customize oversold and overbought regions as well as a multiplier for how much more the volume needs to be relative to the 20 SMA . You can also set an alert with this indicator.
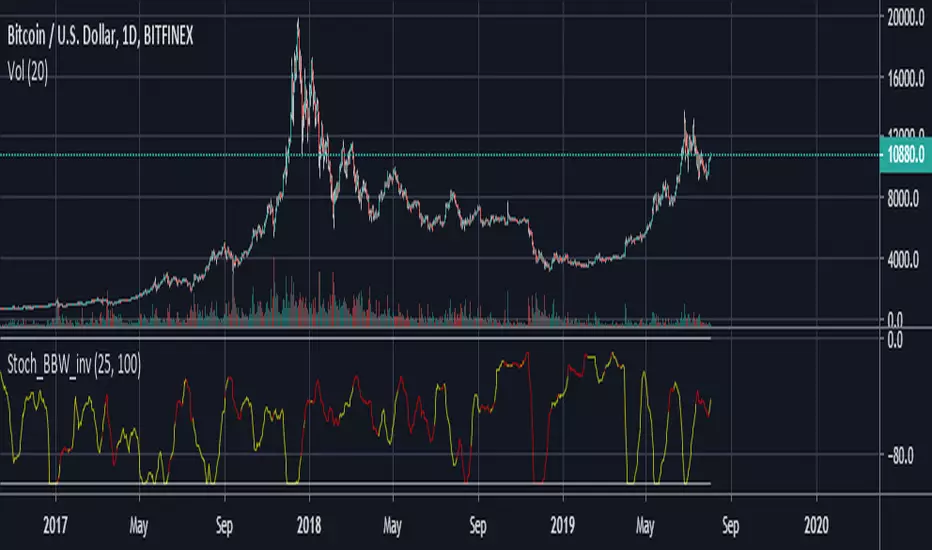
Stoch_BBW_invTop signal: reaches -100 when the color is yellow
Bottom signal: reaches -100 when the color is red
This script calculate a stochastic oscillator of BBW, and defines a top and a bottom as its highest in N bars.
TOP & BOTTOM Cycle [aamonkey]Works best on BTC and only on the daily timeframe!
This is a TOP / BOTTOM indicator for big market cycles.
These tops and bottoms are based on the difference between the 200MA on the daily and the price.


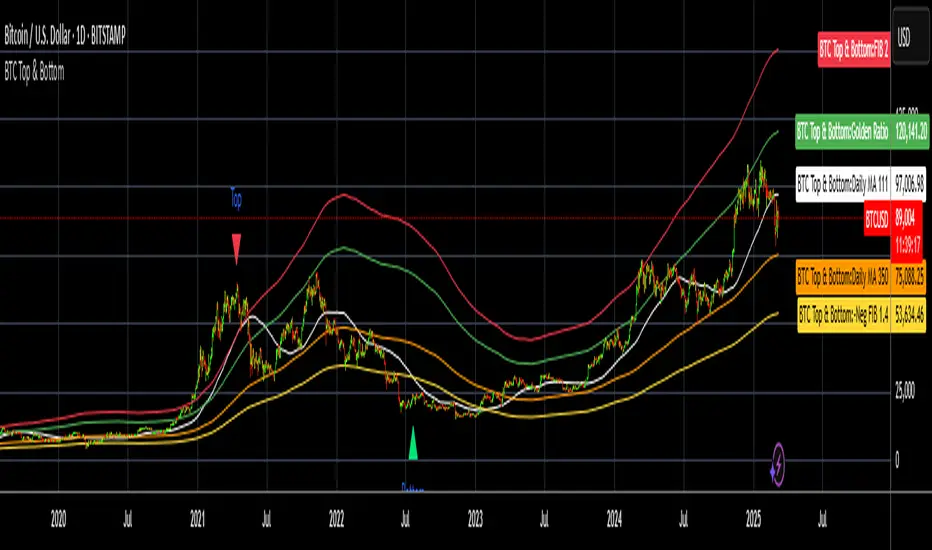
BTC Top and Bottom PickerBTC Top and Bottom Picker
This study predicts BTC tops and bottoms using Bitstamp's daily close data/
It is based on Philip Swift's The Golden Ratio Multiplier post on Medium
In a nutshell:
The top is calculated when 111 daily SMA crossing 350 daily SMA
The bottom is calculated by dividing 350 daily SMA by 1.4
If you like this, please like and share it and follow me.
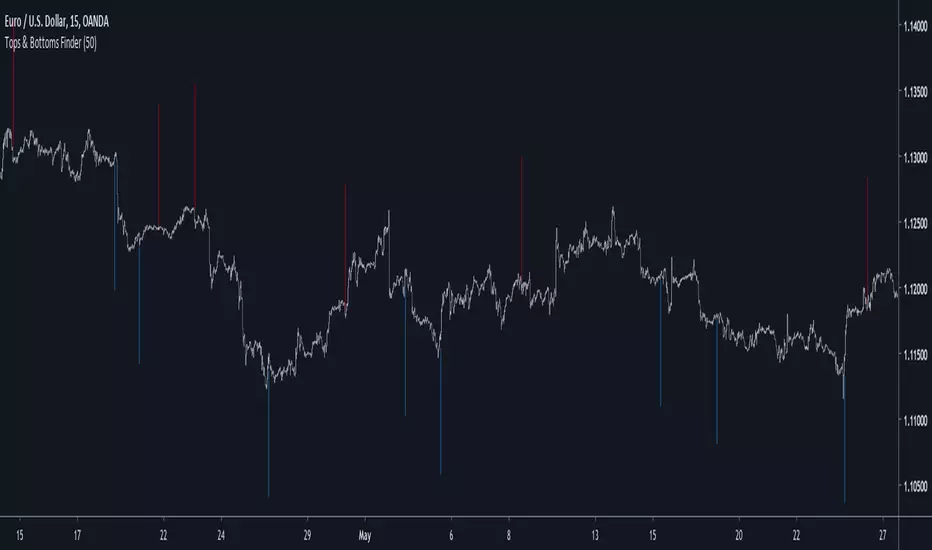
Tops & Bottoms FinderIntroduction
I already shared a method to estimate tops and bottoms (1), the number of parameters could lead to optimization issues so i tried to make a simpler method. In this method i use a simple rescaling method based on individual direction deviation. I will explain further details below.
The Indicator
I use as source for the entire calculation an exponential moving average, the first reaction to this choice would be to think that i wanted to filter signals in order to reduce them, but the truth is that i wanted to have more signals instead, this is because the first calculations involving standard deviations are based on price direction, so by using a smooth input we can get more persistent values in a and b , but its totally up to you to use whatever you want in a , just take into account that less smooth = less signals, this is why i used this calculation process.
a = close and length = 7
a = least squares moving average and length = 25
So you could use pretty much everything you want as input.
Conclusion
The accuracy of such indicators is still relatively low but i presented a way to estimate tops and bottoms without using highest/lowest or differencing thus creating a totally new approach. I encourage you to experiment with it and share your results. If you learned something with this post then i'am happy :)
Notes
Based on several complaints i will have to leave even sooner, i think the 7 of June will be a good day, so if you need something i encourage you to ask me now. With the hope you can understand.
Thanks for reading !
(1)

Double Top Pattern IdentifierHello friends,
This script is a powerful, non-repainting detector for the classic Double Top pattern — one of the most widely recognized bearish reversal setups. The indicator automatically identifies and tracks developing 'M'-shaped formations in real-time, confirming valid entries once the neckline is broken and providing complete trade management features. No manual configuration for detection is needed — it works out of the box.
🛠 How It Works
It uses advanced techniques that involve pivot points analysis and do not rely on other indicators, ensuring robustness and adaptability across different market conditions. When a potential Double Top is detected, the indicator marks the pattern points, draws the neckline, and waits for confirmation.
Once confirmed, it generates a 'Short' signal with calculated Take Profit (TP) and Stop Loss (SL) levels.
The script includes a statistics table summarizing performance metrics — such as number of patterns, trade results, bar distances, and top differences — all dynamically updated on your chart.
🔥 Key Features
Pine Script V6 — optimized logic and performance
Works out of the box — no manual configuration required
Non-repainting detection
Fully visualized structure — points, neckline, TP, and SL plotted automatically
Multiple TP/SL modes: R/R ratio, ATR-based, percent, points, pips, ticks, or top-to-neckline distance
Trailing Stop Loss support
Interactive statistics table with pattern count, trade outcomes, profit ratio, and structural measurements
Smart alert system
Customizable alert messages with placeholders (price, ticker, timeframe, etc.)
Clean, updated UI with improved layout and organization
If you'd like access or have any questions, feel free to reach out to me directly via DM.
👋 Good luck and happy trading!
Tập lệnh trả phí

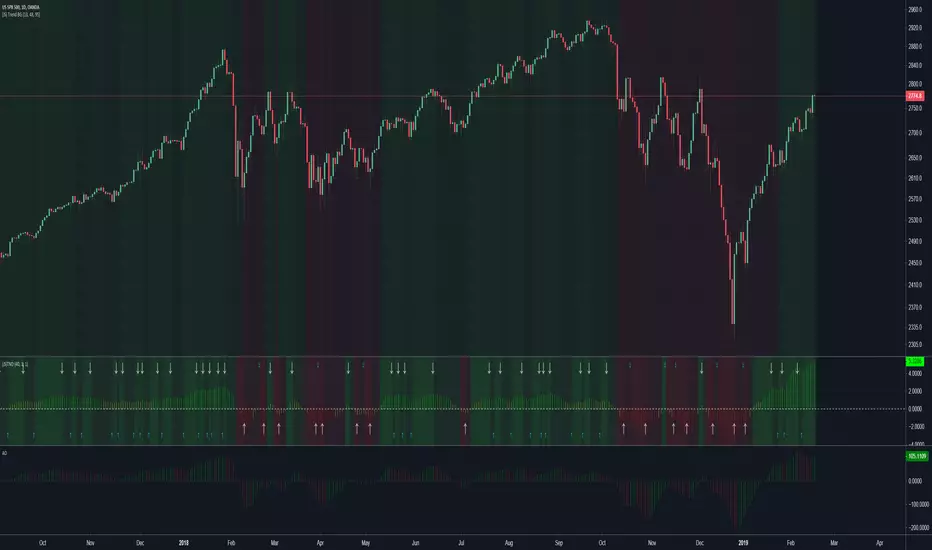
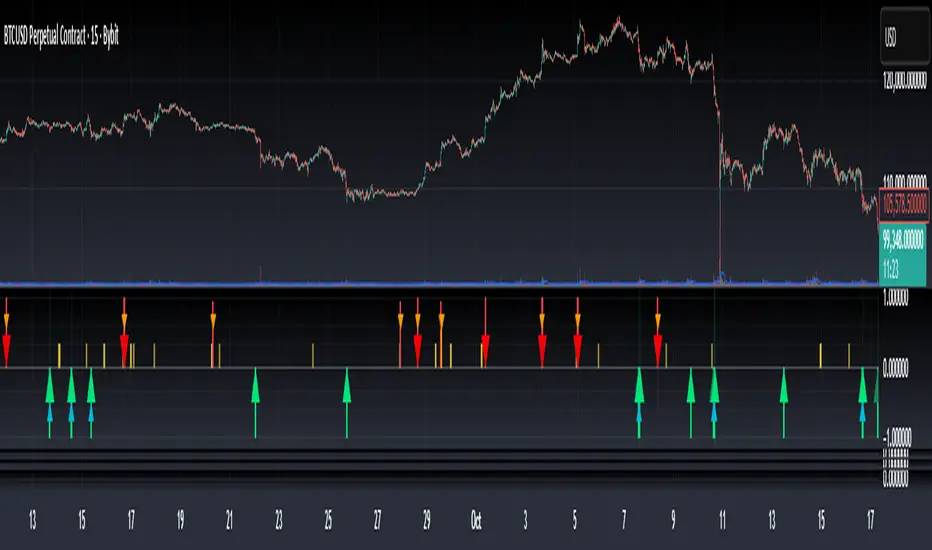
(JS) Tip-and-Dip OscillatorLet me start by saying I know that the name is goofy lol
This is an oscillator that that looks at price action vs. standard deviation in order to illustrate the trend. This thing looks like an Awesome Oscillator but the math behind this and the Awesome Oscillator are totally different (which is pretty interesting, given they look a lot alike). I included the Awesome Oscillator on the chart here so you can look at them and see where they are different.
So the Tip-and Dip Oscillator is meant to help you pinpoint tops and bottoms. I even added arrows where the top and bottom signals are given.
The oscillator itself has 3 colors, an up, down, and neutral color that come as green, red, and yellow. Since the readings given by the oscillator can greatly vary depending on the chart resolution, I included an option to edit the range to fit your chart.
Also - I have 4 different smoothing options that you can use depending on what your preference is. The default setting is the most sensitive so it will identify tops and bottoms more frequently, but it is the most accurate when pinpointing the correct reversal candle. As you smooth it out, the arrows will appear less, but my be slightly delayed and give a later reading. I personally prefer the default, but going up to the second setting in smoothing works nicely as well.
Enjoy!
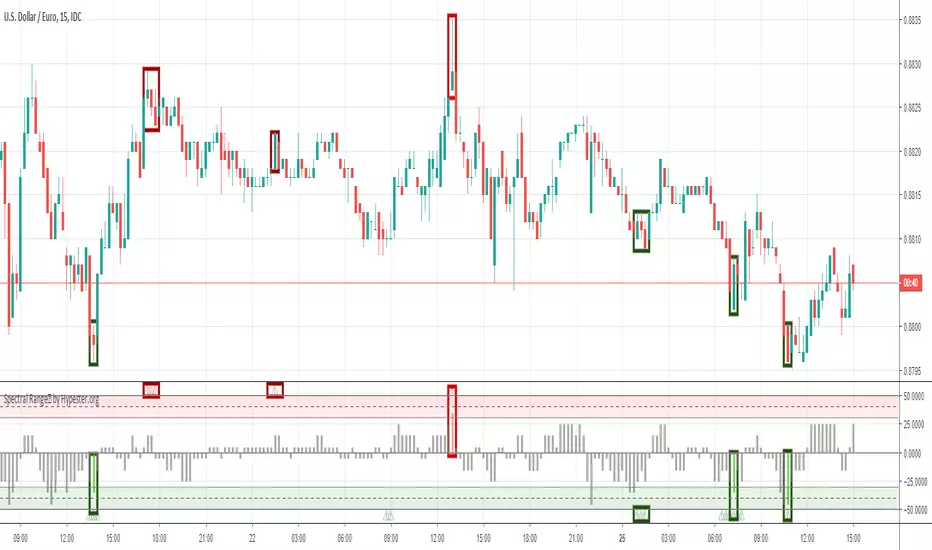
Spectral Range™ by HypesterThe Hypester team strikes again!
Picking tops & bottoms is a real art for any retail trader. It's just like scoring the perfect goal when you get the maximum profit from your trades. It's the difference between an excellent trade and just another trade in your system. It's that last edge you start to seek once you found your profitable strategy.
That's what the Spectral Range™ algorithm does for you - it shows you where all the likely tops/bottoms are . It mixes the famous machine learning Spectro™ technology with cutting edge statistical anomaly detection.
Since all the hard math is done for you, it's deploy and trade. Spectral Range™ will easily tell you when the range of the movement is far out of the normal, healthy and expected movement.
The height of the bar will tell you how aggressive is the anomaly and consequently its correction, plus an extra layer of confirmation with the little warning signs that should be used together for a more conservative approach.
It's really that simple, what are you waiting for?
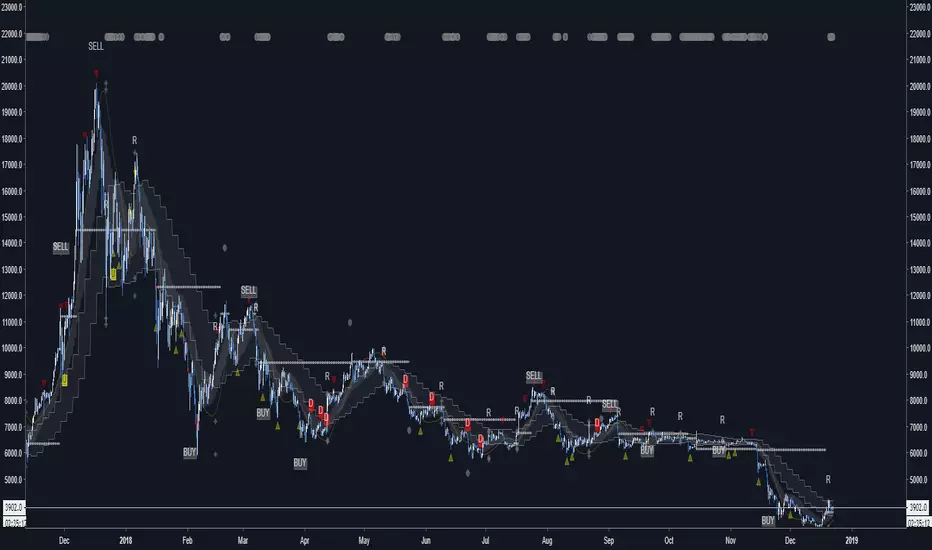
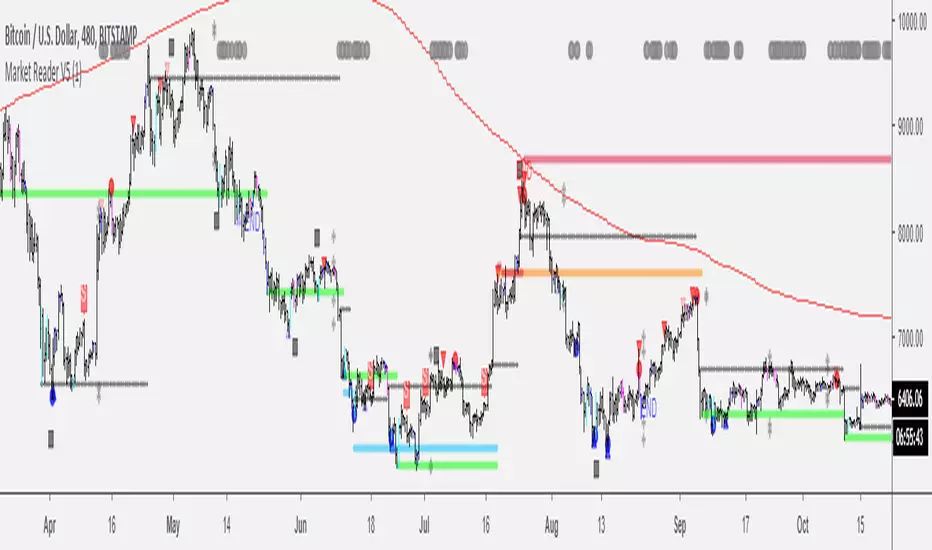
MarketReader[ENG] DARK THEMEMarket Reader is a very sophisticated indicator giving you:
-BUY and SELL Opportunities
-Key supports and resistances where the market will react
-Early detection of RANGE before the contact with the top or the bottom of the range, it will also give you the target of the top and the bottom of the range
-Pattern of smartmoney activities, giving you signal that smart money is moving at this level of price
You will also found my complete strategy on my Youtube Channel
Enjoy
Utilization requires subscription
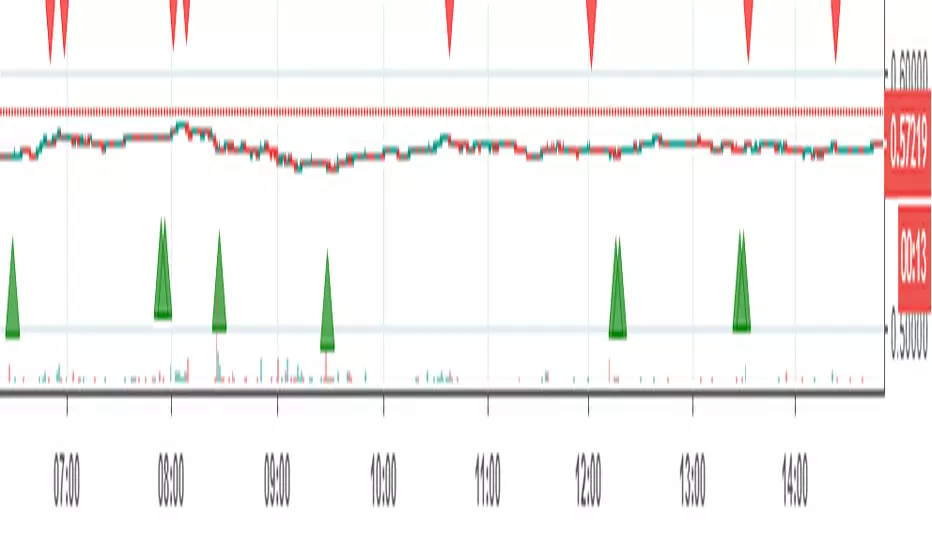
Scalp God (top and bottom finder) (SATURN)I am very happy to present the Tradingview community the first of my new line of powerful indicators.
This is the SCALP GOD. It will clearly label market tops and bottoms for you, if you are scalping and looking to open or close a position this indicator will mark the local highs and lows for you. Or if you are a swing trader this can also give good signals as this indicator works on any pair and any timeframe! When you see the chart turning green you know for sure that a market top is forming, if the chart is turning red you know for sure a market bottom is forming. It is sometimes the absolute top or bottom and sometimes just an important local top or bottom. PM me if you find a better top & bottom indicator because I am trying to make this better than everything out there.
It absolutely can not repaint under any circumstances.
There are a few inputs for you to think about here:
-First is the length, this just decides how many previous bars to consider, making it longer will focus on more historical information while making shorter will make it focus on what has recently happened. 12 seems to be a good value, but it's not as important as the next two options.
-Next is the threshold value, setting it very low will mean that signals will get triggered very quickly, while a higher threshold will take more movement to trigger.
-Last and most important is the sensitivity value. A lower value here will make the signals much more sensitive and therefore able to flip and trigger faster. A higher sensitivity value will make the signals less sensitive and harder to flip, meaning that it will only look for movements that agree with the longer term trend. This is great for swing traders and scalpers that go with the trend.
-There is also a smoothening option, this will make it so the signals don't come on and off so much. Sometimes this will not be good for timing, but other times it will be a more certain signal for traders specifically looking for where the top or bottom ends.
It gets better because I added several of these indicators into one script, so if there is a particular set of sensitivities and thresholds that you like you can look at them all on the same chart without opening so many copies of this. To turn on an additional copy just check the "Sensitivity # On" box.
Everyone can try this for free for 3 days and after that it will be 0.025 BTC for lifetime use and this will include all future updates to this project. This is Project Saturn and this is the first indicator from a new series of indicators that will be coming out over the next year.
Hopefully this makes a lot of you rich! I'm very excited to see all of the uses people make with it.
Happy trading & good health!

Market Reader [ENG]Market Reader is a very sophisticated indicator giving you:
-Pattern of take profit helping you to enter or exit your position
-Pattern of EXIT giving you the signal of market reversal (See on BTC)
-Key supports and resistances where the market will react
-Early detection of RANGE before the contact with the top or the bottom of the range, it will also give you the target of the top and the bottom of the range
-Pattern of institutional activities, giving you signal that smart money is moving at this level of price
You will also found my complete strategy on my youtube Channel (Market Reader)
Enjoy
1 month free trial 8ask on private message or in comment)
The 30 first subscriber will have a 50% discount
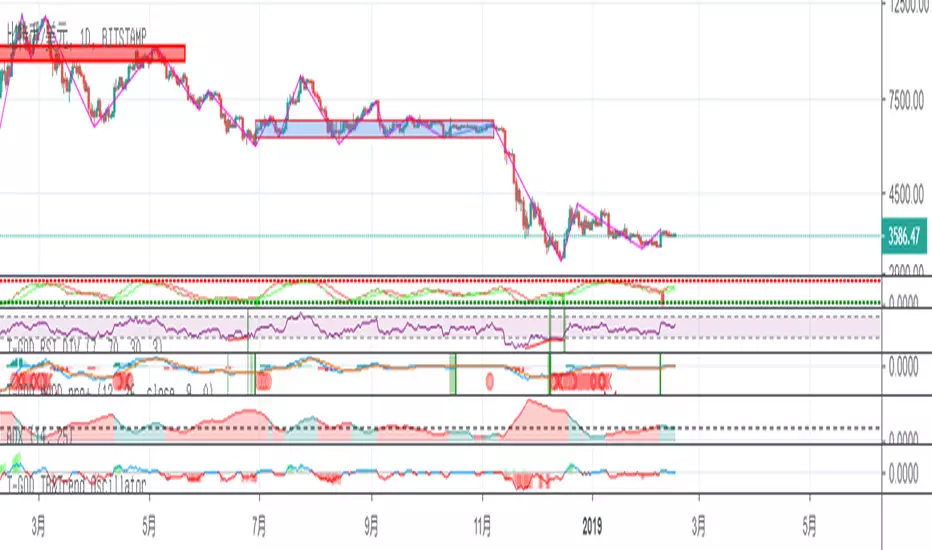
T-GOD TB&Trend OscillatorUsage:
Front side trading: In bumppy market. Use this oscillator to find the top and the bottom of the market. When the hist comes to green, you can find the market bottom by the lowest blue line. When the hist comes to red, the highest red line may help you to find the possible market top.
Back side trading: red line for long trend,blue line for short trend.
For reference only! !
top&bottomYou can find "Top&Bottom" on chart by this indicator. This is described by TMA theory.
I reccomend using this for scalping trade.
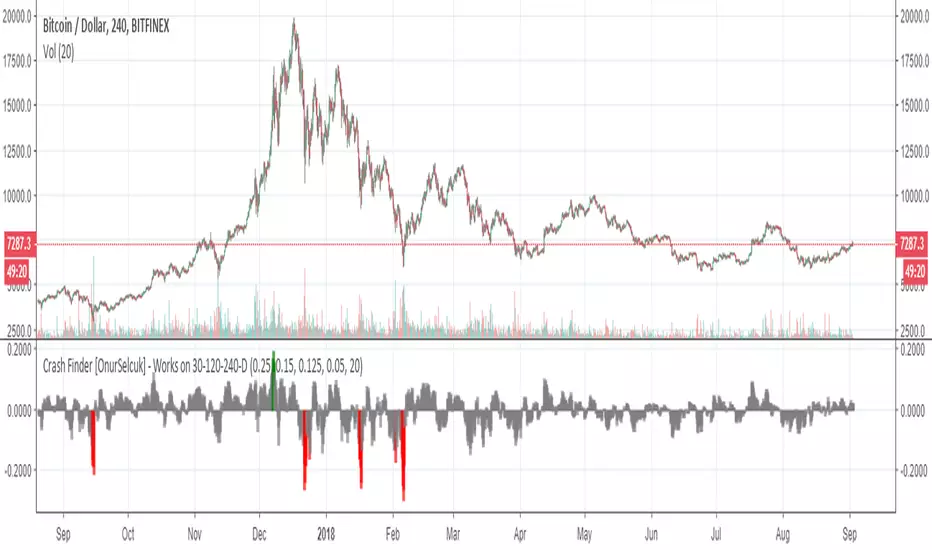
Crash Finder [OnurSelcuk] - Works on 30-120-240-D V.1This indicator helps you to find possible bottoms and tops. Works only 30-120-240-Daily pattern.
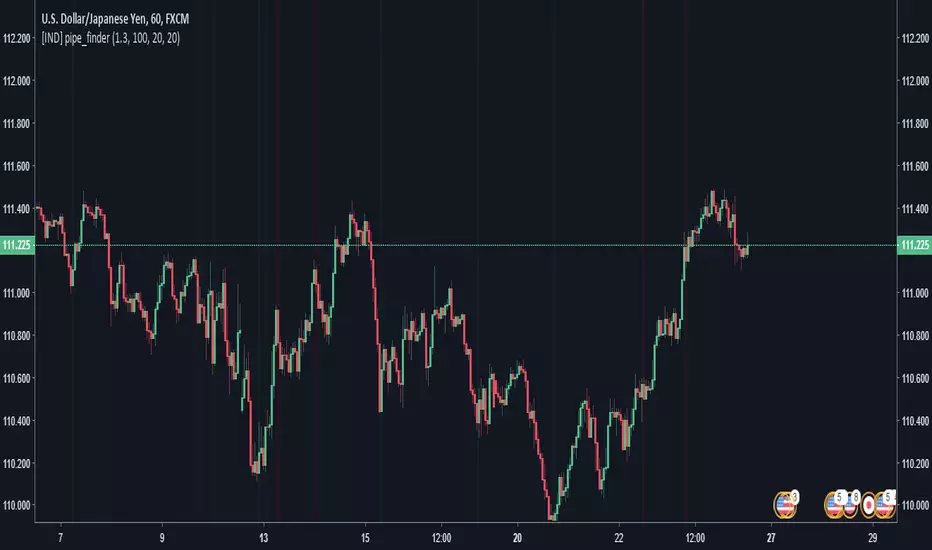
pipe_finder. Reversal Indicator for Pipe Top & Bottom Patterns.Simple indicator to find pipe bottom and top patterns.
Definition:
- Pipe Bottom:
- Positive Difference from Open and Close is greater than the average thickness of the last "x" candles multiplied by sensitivity "y"
- The previous candle is red and the current candle is green
- Trend Definition - (Trend for EMA length 'z" has a slope less than 0 or pointed downwards)
- The average of the current and previous candle's volume is greater than the average volume for the last "n" candles.
- Pipe Top:
- Positive Difference from Open and Close is greater than the average thickness of the last "x" candles multiplied by sensitivity "y"
- The previous candle is green and the current candle is red
- Trend Definition - (Trend for EMA length 'z" has a slope greater than 0 or pointed upwards)
- The average of the current and previous candle's volume is greater than the average volume for the last "n" candles.
Settings:
Sensitivity: How thick do the pipe candles have to be? (Greater sensitivity = more alerts)
Candle Thickness Average Period: The number of past candles used for measuring the average body size of candlestick.
Filter EMA Length: Length of the EMA used to filter between bull trends and bear trends.
Volume EMA Length: Length of the volume EMA.
Bottom & Top Finder v3.0Bottom & Top Finder v3.0 is a proprietary multi-component oscillator designed to identify potential market reversals and extreme price conditions. The indicator analyzes momentum, volatility, and price behavior to generate bullish and bearish signals with strength classification.
█ OVERVIEW
Each signal is classified into three strength levels (Weak, Medium, Strong) allowing traders to prioritize high-conviction setups.
Signal Classification:
• Strong signals (±1.0): High conviction setups with multiple confirmations
• Medium signals (±0.6): Moderate conviction with key component alignment
• Weak signals (±0.33): Early warnings or preliminary indications
█ KEY FEATURES
Smart Signal Management
The indicator includes an intelligent system that allows signal sequences to complete naturally while preventing excessive noise. Unlike traditional cooldown systems that block all signals during a cooldown period, this implementation allows consecutive signals during a "run" and only applies cooldown after the signal run ends. This ensures complete multi-bar patterns are captured while preventing rapid flip-flopping.
Advanced Filtering System
Three optional filters allow adaptation to different market conditions:
• Volume Confirmation Filter: Validates signals against recent volume activity across a configurable lookback period. Checks if any bar in the lookback window exceeded average volume by the specified multiplier.
• Trend Alignment Filter: Four operational modes including With Trend, Counter Trend, Statistical Distance, or Off. The anomaly mode uses calculations to identify signals only at statistical extremes rather than simple directional bias.
• Signal Type Selection: Enable or disable weak, medium, and strong signals independently based on your trading style and risk tolerance.
Comprehensive Alert System
Ten distinct alert conditions cover every use case. Alerts include price level and timestamp, and are ready for webhook integration with automated trading systems.
█ HOW TO USE
Basic Setup
1 — Add "Bottom & Top Finder v3.0" to your chart in a separate indicator pane
2 — Optionally add "Bottom & Top Finder v3.0 - Chart Labels" for on-chart visual markers
3 — Configure lookback periods (defaults work well for most timeframes)
4 — Enable or disable signal strengths based on your trading style
5 — Apply filters as needed to reduce noise in your specific market
Signal Interpretation
Histogram magnitude indicates signal conviction. Multiple signal types can fire simultaneously and are aggregated into the composite score.
Alert Configuration
Set up alerts through TradingView's standard alert system using the built-in alert conditions. Choose from individual signal types (for specific setups) or aggregate alerts (for broader monitoring).
Recommended Approach
• Combine indicator signals with price action and support/resistance analysis
• Use strong signals for entries, weaker signals for early warnings or exits
• Enable filters when trading liquid markets with reliable volume data
• Adjust cooldown period based on timeframe: lower for active trading, higher for swing setups
• Start with default settings and adjust based on backtesting results
█ SETTINGS
Lookback Settings
• Main Lookback Period: Primary calculation period for most components (default: 21). Lower values increase sensitivity, higher values smooth signals.
• Range Lookback: Extended lookback for range high/low analysis (default: 50). Affects extreme condition detection.
Signal Settings
• Enable Weak Signals: Toggle weak signal detection (default: on)
• Enable Medium Signals: Toggle medium signal detection (default: on)
• Enable Strong Signals: Toggle strong signal detection (default: on)
Filter Settings
• Enable Volume Filter: Require volume confirmation (default: off)
• Volume Lookback: Period to check for volume spikes (default: 30)
• Volume Spike Multiplier: Threshold above average volume (default: 1.3x)
• Trend Filter Mode: Off, With Trend, Counter Trend, or Anomaly (default: off)
• Trend SMA Period: Moving average period for trend calculations (default: 50)
• Anomaly Threshold: Minimum statistical deviation for anomaly mode (default: 1.5)
Display Settings
• Show Composite Histogram: Toggle main histogram display (default: on)
• Show Signal Bars: Toggle triangle markers in indicator pane (default: on)
• Show RSI Reference: Overlay normalized RSI for context (default: off)
█ TIMEFRAME CONSIDERATIONS
The indicator works on any timeframe from 1-minute to monthly charts. However, optimal performance requires timeframe-appropriate configuration:
Shorter Timeframes (1m-15m)
Consider reducing main lookback period for increased responsiveness. Volume filter may be less reliable in some markets during low-liquidity sessions.
Medium Timeframes (1H-4H)
Default lookback periods are optimized for these timeframes. Volume and trend filters provide good noise reduction.
Longer Timeframes (1D+)
Consider increasing lookback periods for smoother signals. Filters are highly effective at these timeframes.
█ BEST PRACTICES
Risk Management
This indicator is a technical analysis tool designed to identify potential reversal zones and does not guarantee profitable trades. Users should:
• Understand that signals indicate potential setup zones, not guaranteed outcomes
• Employ proper position sizing and risk management on every trade
• Combine indicator signals with their own analysis and trading strategy
• Paper trade and backtest thoroughly before live implementation
• Never risk more than they can afford to lose
Signal Context
Indicator signals should be evaluated within broader market structure. Consider:
• Proximity to key support and resistance levels
• Overall trend direction and strength
• Market volatility and liquidity conditions
• Confluence with other technical indicators or patterns
• Fundamental factors that may override technical signals
█ NOTES
• All signals use confirmed bar data and do not repaint
• The cooldown system tracks top and bottom signals independently
• Multiple signal types can fire simultaneously; the composite score aggregates them
• Anomaly mode measures standard deviation magnitude, not just directional bias
• Volume filter checks any bar in the lookback period, not just the current bar
• Strong signals require more confirmations than medium or weak signals
PorcupineDisplays "spike days" by colouring the bars (Default: yellow for a Spike High and blue for a Spike Low)
Spike Day's definition taken from Jack D Schwager's Book: A Complete Guide to the Futures Market: Technical Analysis, Trading Systems, Fundamental Analysis, Options, Spreads, and Trading Principles
A spike is:
A wide difference between the spike high and the highs of the preceding and succeeding days.
A close near the low of the day's range.
A substantial price advance preceding the spike's formation.
The more extreme each of these conditions, the greater the likelihood that a spike high will prove to be an important relative high or even a major top.
(inverse is true for lows, basically)
Enjoy!
