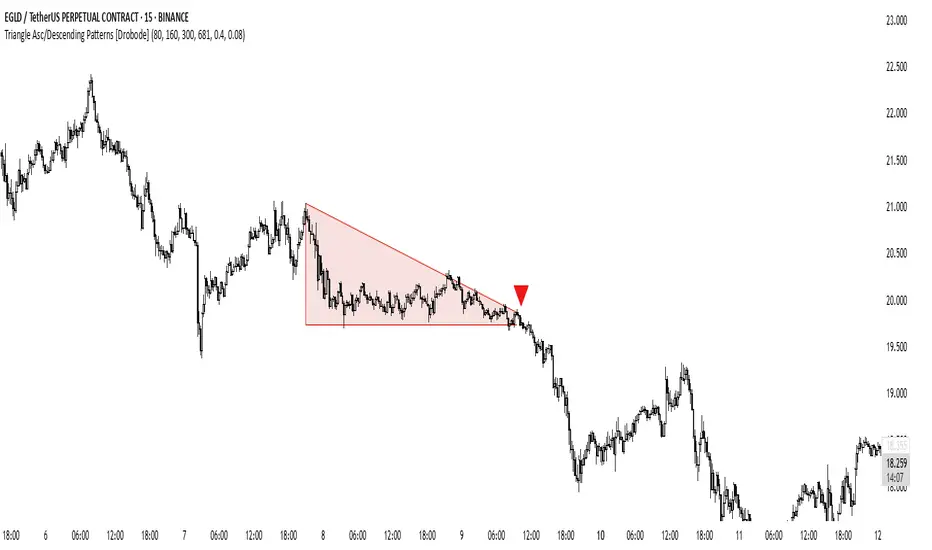
Triangle Asc/Descending Patterns [Drobode]█ DESCRIPTION
The script automatically tracks the descending or ascending triangle pattern. The script provides advanced settings, allowing you to adjust the pattern accuracy from high to low depending on your needs and technical analysis style. The main goal of the script is to facilitate the routine work of a trader in identifying certain trading situations (patterns). However, you should understand that the script is not a full-fledged self-sufficient strategy, in case of receiving a signal, it is recommended that you additionally conduct a comprehensive thorough analysis before taking trading actions. The script can be useful for traders of all levels, both beginners and experienced analysts. This variation of the script, in case of identifying a pattern, draws a contour triangle with the background color of the figure. The ascending triangle has a blue color, the descending triangle has a red color. The logic of the script provides that one of the legs (one side) of the triangle is always a horizontal line, simultaneously being a line of resistance or support, other variations of triangle patterns are not tracked. According to generally defined beliefs and observations of pattern formation, a descending and ascending triangle may indicate a possible breakdown of the conditional horizontal level to which the price of the instrument has approached, however, at the same time it is necessary to deeply analyze many other factors at this point, in particular, such as volumes, consolidation, volatility, and so on.
█ SCRIPT SETTINGS
By default, the script was pre-developed and tested on the M15 timeframe with the USDT.P crypto futures instruments.
Alert
The Alert function in the script is enabled by default, you just need to activate the Alert in the TradingView window and select the signal source - Triangle Asc/Descending Patterns .
The notification provides the following information (example):
Triangle_Ascending
Ticker- EGLDUSDT.P
Price-19.754
Timeframe- 15
Period length-160
Periods length
The script allows you to set the period length (number) of bars on which the calculation will be performed. Different periods make it possible to cover more timeframes (in particular, larger timeframes). The calculation is performed simultaneously on all periods, but you can turn off "Period length 3" and "Period length 4" by clicking on the check mark, this can speed up the script. The following period values are set by default: "Period length 1" – 80,
"Period length 2" – 160, "Period length 3" – 300, "Period length 4" – 681.
Percentage deviation of extremes
The next settings are the percentage deviation from the hypotenuse and horizontal leg, which creates the zone in which the extremes of the bars that will form the triangle shape should be. The smaller the deviation, the greater the accuracy and the closer to the hypotenuse and leg the bar extrema should be, however, in this case the number of pattern identifications will be smaller. By default, the deviation zone from the hypotenuse "Deflection zone of tangents to the hypotenuse" is - 0.4%, the deviation zone from the horizontal leg "Tangent deviation zone horizontal leg" is - 0.08%.
The presence of extrema at certain points on the sides of a triangle
The last block of settings are the conditions that increase the accuracy of the proportions of the pattern figure. These settings are aimed at confirming the presence of extrema in certain areas along the hypotenuse and horizontal leg. Thus, enabling "Extrema on the horizontal leg almost along the entire length" means that only those triangles will be tracked in which the horizontal leg zone has extrema almost along the entire length of this leg, this increases the accuracy but reduces the number of detected patterns. "Extremes present on second half of horizontal leg (more than 50%)" assumes that only those triangles will be tracked in which the extrema are present on the second half of the length of the given leg (more than 50%) in the zone of the horizontal leg. "Presence of an extrema in the middle region of the hypotenuse" assumes that only those triangles will be tracked in which the extrema are present on a certain segment of length in the central region of the hypotenuse.
Hình tam giác
Breakout Patterns Detector: Triangle & Wedge [Splirus]This indicator identifies Breakout Patterns such as Ascending Triangles , Descending Triangles , Symmetric Triangles , Ascending Wedges , and Descending Wedges , using candlestick charts and Trendlines. It provides visual cues, stop-loss (SL), and take-profit (TP) levels, alongside a detailed dashboard to evaluate performance. The indicator supports two alert modes: Manual Mode for trader notifications and Bot Mode for automated trading signals.
To achieve optimal results, users are encouraged to experiment with indicator parameters and analyze the dashboard summary to find the perfect configuration for each timeframe, pair, and market condition.
Pattern Identification
The indicator detects the following breakout patterns based on pivot highs and lows:
Ascending Triangle : Flat upper trendline, rising lower trendline.
Descending Triangle : Flat lower trendline, declining upper trendline.
Symmetric Triangle : Converging trendlines with similar slopes (within a user-defined threshold).
Ascending Wedge : Both trendlines slope upward, converging.
Descending Wedge : Both trendlines slope downward, converging.
Patterns are identified using configurable left and right bars for small and big patterns, with slope thresholds normalized by ATR. A trend confirmation filter ensures breakouts align with market direction, and users can adjust breakout confirmation bars to validate signals.
The goal is to fine-tune these settings to suit specific timeframes and pairs, as each combination may require a unique setup for optimal performance.
Stop-Loss Calculation
Stop-loss levels are calculated dynamically based on pattern type and breakout direction:
Symmetric Triangle : SL is set at the first pivot of the opposite trendline, adjusted by a buffer percentage.
Ascending/Descending Triangle : SL is placed at the breakout trendline’s price, plus the buffer.
Ascending/Descending Wedge : SL is set at the second pivot of the opposite trendline, adjusted by the buffer.
The indicator calculates leverage based on a user-defined risk tolerance percentage. Users should adjust the SL buffer and risk tolerance to balance risk and reward, monitoring the dashboard to assess how these settings impact performance across different timeframes and pairs.
Take-Profit Calculation
Three take-profit levels ( TP1 , TP2 , TP3 ) are calculated using pattern height and user-defined multipliers:
For Ascending/Descending Triangles, height is the difference between the max and min prices within the pattern.
For Symmetric Triangles and Wedges, height is the vertical distance between trendlines at the pattern’s start.
TP levels are set as:
TP1 = Breakout price ± (Height × TP1 Multiplier).
TP2 = Breakout price ± (Height × TP2 Multiplier).
TP3 = Breakout price ± (Height × TP3 Multiplier, with a 1.5x adjustment for Wedges).
Experiment with TP multipliers to optimize the risk-reward ratio, using the dashboard to evaluate TP hit rates and overall profitability for each configuration.
Symmetric Triangle:
Ascending/Descending Wedge:
Ascending/Descending Triangles:
Finding the Perfect Configuration
The indicator’s dashboard provides a comprehensive summary of performance metrics, including total trades, TP1/TP2/TP3 hits, SL hits, profit/loss percentages, and win rates for bullish, bearish, and combined trades. These metrics are crucial for identifying the ideal parameter settings:
Timeframe and Pair Variability : Each timeframe (e.g., 15m, 30min, 1H, 4H, Daily) and pair (e.g., BTC/USD, EUR/USD) behaves differently. Adjust parameters like left/right bars, minimum pattern length, and breakout confirmation bars to match the volatility and trend characteristics of the chosen pair and timeframe.
Parameter Tuning : Modify slope thresholds, trend confirmation filters, and bars inside the pattern to filter out false breakouts. For example, a higher breakout confirmation bar setting may reduce signals but increase reliability on longer timeframes.
Dashboard Analysis : Focus on the dashboard’s win rate, profit/loss ratio, and TP/SL hit frequencies. A “Perfect” win rate (>66%) or high TP hit rate indicates a strong configuration. If the SL hit rate is high, consider tightening the trend confirmation filter or increasing the SL buffer.
Iterative Testing : Test different combinations of settings (e.g., small vs. big patterns, aggressive vs. conservative breakout confirmation) and compare dashboard results over time. The goal is to find a balance where the indicator consistently delivers high win rates and profitability for your specific trading setup.
Alert Modes
The indicator supports two alert modes to suit different trading styles:
Manual Mode : Generates alerts for breakouts with entry price, SL, TP1/TP2/TP3, and leverage, tailored for Crypto or Forex markets. Use this mode to manually evaluate signals while refining configurations.
Bot Mode : Sends automated trading signals. To avoid conflicts, Bot Mode ensures no short position alert is triggered while a long position is active, and vice versa. This mode is ideal once you’ve identified an optimal configuration via the dashboard.
Additional Features
Historical Patterns : Displays past trendlines with customizable transparency and extension, helping users analyze how patterns performed under different settings.
Customizable Settings : Adjust pattern size, breakout confirmation, trend filters, and visual preferences (colors, dashboard location) to match your trading style.
Market Compatibility : Supports Crypto and Forex markets across all timeframes, but requires careful tuning for each market type.
Usage Notes
Start with default settings and monitor the dashboard to establish a baseline performance for your chosen timeframe and pair.
Gradually adjust one parameter at a time (e.g., left/right bars, TP multipliers) and compare dashboard results to identify improvements.
Use historical pattern analysis to understand how past breakouts performed under different configurations, guiding your optimization process.
Once a high win rate and profitability are achieved, consider automating trades with Bot Mode for consistent execution.
Disclaimer
This indicator is intended for educational purposes only and should not be considered financial advice. Trading involves significant risk, and past performance is not indicative of future results. Users are strongly advised to thoroughly test and validate the indicator’s signals in a demo environment before using it in live trading. The author is not responsible for any financial losses incurred while using this indicator. Always conduct your own research and consult with a qualified financial advisor before making trading decisions.

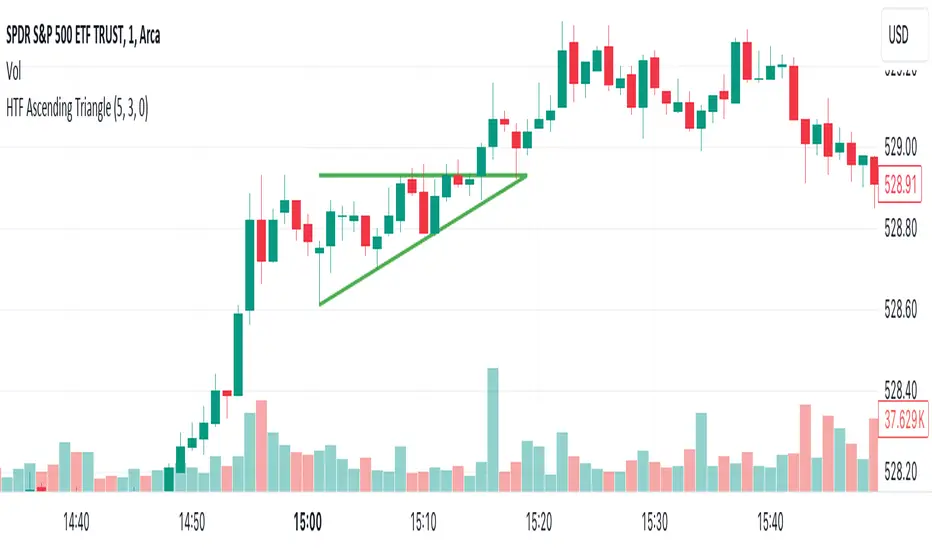
HTF TriangleHTF Triangle by ZeroHeroTrading aims at detecting ascending and descending triangles using higher time frame data, without repainting nor misalignment issues.
It addresses user requests for combining Ascending Triangle and Descending Triangle into one indicator.
Ascending triangles are defined by an horizontal upper trend line and a rising lower trend line. It is a chart pattern used in technical analysis to predict the continuation of an uptrend.
Descending triangles are defined by a falling upper trend line and an horizontal lower trend line. It is a chart pattern used in technical analysis to predict the continuation of a downtrend.
This indicator can be useful if you, like me, believe that higher time frames can offer a broader perspective and provide clearer signals, smoothing out market noise and showing longer-term trends.
You can change the indicator settings as you see fit to tighten or loosen the detection, and achieve the best results for your use case.
Features
It draws the detected ascending and descending triangles on the chart.
It supports alerting when a detection occurs.
It allows for selecting ascending and/or descending triangle detection.
It allows for setting the higher time frame to run the detection on.
It allows for setting the minimum number of consecutive valid higher time frame bars to fit the pattern criteria.
It allows for setting a high/low factor detection criteria to apply on higher time frame bars high/low as a proportion of the distance between the reference bar high/low and open/close.
It allows for turning on an adjustment of the triangle using highest/lowest values within valid higher time frame bars.
Settings
Ascending checkbox: Turns on/off ascending triangle detection. Default is on.
Descending checkbox: Turns on/off descending triangle detection. Default is on.
Higher Time Frame dropdown: Selects higher time frame to run the detection on. It must be higher than, and a multiple of, the chart's timeframe. Default is 5 minutes.
Valid Bars Minimum field: Sets minimum number of consecutive valid higher time frame bars to fit the pattern criteria. Default is 3. Minimum is 1.
High/Low Factor checkbox: Turns on/off high/low factor detection criteria. Default is on.
High/Low Factor field: Sets high/low factor to apply on higher time frame bars high/low as a proportion of the distance between the reference bar high/low and open/close. Default is 0. Minimum is 0. Maximum is 1.
Adjust Triangle checkbox: Turns on/off triangle adjustment using highest/lowest values within valid higher time frame bars. Default is on.
Detection Algorithm Notes
The detection algorithm recursively selects a higher time frame bar as reference. Then it looks at the consecutive higher time frame bars (as per the requested number of minimum valid bars) as follows:
Ascending Triangle
Low must be higher than previous bar.
Open/close max value must be lower than (or equal to) reference bar high.
When high/low factor criteria is turned on, high must be higher than (or equal to) reference bar open/close max value plus high/low factor proportion of the distance between reference bar high and open/close max value.
Descending Triangle
High must be lower than previous bar.
Open/close min value must be higher than (or equal to) reference bar low.
When high/low factor criteria is turned on, low must be lower than (or equal to) reference bar open/close min value minus high/low factor proportion of the distance between reference bar low and open/close min value.

HTF Descending TriangleHTF Descending Triangle aims at detecting descending triangles using higher time frame data, without repainting nor misalignment issues.
Descending triangles are defined by a falling upper trend line and an horizontal lower trend line. It is a chart pattern used in technical analysis to predict the continuation of a downtrend.
This indicator can be useful if you, like me, believe that higher time frames can offer a broader perspective and provide clearer signals, smoothing out market noise and showing longer-term trends.
You can change the indicator settings as you see fit to tighten or loosen the detection, and achieve the best results for your use case.
Features
It draws the detected descending triangle on the chart.
It supports alerting when a detection occurs.
It allows for setting the higher time frame to run the detection on.
It allows for setting the minimum number of consecutive valid higher time frame bars to fit the pattern criteria.
It allows for setting a low factor detection criteria to apply on higher time frame bars low as a proportion of the distance between the reference bar low and open/close.
It allows for turning on an adjustment of the triangle using highest/lowest values within valid higher time frame bars.
Settings
Higher Time Frame dropdown: Selects higher time frame to run the detection on. It must be higher than, and a multiple of, the chart's timeframe.
Valid Bars Minimum field: Sets minimum number of consecutive valid higher time frame bars to fit the pattern criteria.
Low Factor checkbox: Turns on/off low factor detection criteria.
Low Factor field: Sets low factor to apply on higher time frame bars low as a proportion of the distance between the reference bar low and open/close.
Adjust Triangle checkbox: Turns on/off triangle adjustment using highest/lowest values within valid higher time frame bars.
Detection Algorithm Notes
The detection algorithm recursively selects a higher time frame bar as reference. Then it looks at the consecutive higher time frame bars (as per the requested number of minimum valid bars) as follows:
High must be lower than previous bar.
Open/close min value must be higher than reference bar low.
When low factor criteria is turned on, low must be lower than reference bar open/close min value minus low factor proportion of the distance between reference bar low and open/close min value.

HTF Ascending TriangleHTF Ascending Triangle aims at detecting ascending triangles using higher time frame data, without repainting nor misalignment issues.
Ascending triangles are defined by an horizontal upper trend line and a rising lower trend line. It is a chart pattern used in technical analysis to predict the continuation of an uptrend.
This indicator can be useful if you, like me, believe that higher time frames can offer a broader perspective and provide clearer signals, smoothing out market noise and showing longer-term trends.
You can change the indicator settings as you see fit to tighten or loosen the detection, and achieve the best results for your use case.
Features
It draws the detected ascending triangle on the chart.
It supports alerting when a detection occurs.
It allows for setting the higher time frame to run the detection on.
It allows for setting the minimum number of consecutive valid higher time frame bars to fit the pattern criteria.
It allows for setting a high factor detection criteria to apply on higher time frame bars high as a proportion of the distance between the reference bar high and open/close.
It allows for turning on an adjustment of the triangle using highest/lowest values within valid higher time frame bars.
Settings
Higher Time Frame dropdown: Selects higher time frame to run the detection on. It must be higher than, and a multiple of, the chart's timeframe.
Valid Bars Minimum field: Sets minimum number of consecutive valid higher time frame bars to fit the pattern criteria.
High Factor checkbox: Turns on/off high factor detection criteria.
High Factor field: Sets high factor to apply on higher time frame bars high as a proportion of the distance between the reference bar high and close/open.
Adjust Triangle checkbox: Turns on/off triangle adjustment using highest/lowest values within valid higher time frame bars.
Detection Algorithm Notes
The detection algorithm recursively selects a higher time frame bar as reference. Then it looks at the consecutive higher time frame bars (as per the requested number of minimum valid bars) as follows:
Low must be higher than previous bar.
Open/close max value must be lower than reference bar high.
When high factor criteria is turned on, high must be higher than reference bar open/close max value plus high factor proportion of the distance between reference bar high and open/close max value.
Price Action Pattern Breakout Strategy: Wedge,Triangle,ChannelIntroducing the Price Action Pattern Breakout Strategy: Wedge,Triangle,Channel 💹🚀
The "Price Action Pattern Breakout Strategy: Wedge, Triangle, Channel" is a dynamic and automated trading strategy that excels in recognizing and capitalizing on breakout opportunities within the realm of powerful price action patterns. It is finely tuned to achieve exceptional precision in detecting three distinct pattern types: Wedge, Triangle, and Channel. This diversity equips you to confidently navigate a wide range of market scenarios and opportunities.
This strategy automates trade entries and exits upon confirmed pattern breakouts, this eliminates human errors in correctly recognizing patterns and prevents emotional decisions. This strategy is designed to work across different time frames, making it suitable for both short-term and long-term traders. Whether you're a day trader, swing trader, or investor, this strategy provides the flexibility you need to thrive in diverse market conditions.
💎 How it Works:
▶️ In this strategy, three price action patterns have been utilized, one of which is the "Wedge" pattern. The Wedge pattern has consistently demonstrated a high level of credibility, typically resulting in sharp and rapid price movements following a confirmed breakout from this pattern. This characteristic makes the Wedge pattern highly noteworthy in our strategy. The second pattern is the "Triangle" pattern, which, depending on its formation, whether ascending or descending, can indicate a strong continuation or reversal of the trend. The last pattern is the "Channel" pattern. The reason for using the Channel pattern is its versatility in various market conditions and its tendency to produce reliable results.
In the snapshot below, you can observe the types of patterns that this strategy is capable of identifying at a glance:
▶️ This strategy employs two types of targeting systems: Fixed Targets and Trailing Targets.
Fixed Targets is the default targeting system of the strategy, incorporating two primary targets: TP1 (Target Point 1) and TP2 (Target Point 2). These targets are thoughtfully adjusted in alignment with specific rules for each pattern. With Fixed Targets, you have the flexibility to designate the position size percentage for your exits at TP1 and TP2. For instance, should you opt to allocate 60% of your position size to TP1, as soon as the price triggers the first take profit level, 60% of your initial position is gracefully closed, leaving the remaining 40% to exit the trade upon reaching TP2.
Trailing Targets represent the strategy's alternative targeting system. With this system, the trailing stop becomes active once the price reaches the specified trigger point. The strategy then exits the trade based on the defined offset percentage and price retracement from the trailing limit.
▶️ This strategy relies on a single type of stop loss, determined by previous pivot points and adjusted based on the trade's direction, whether long or short, placing the stop loss above or below the prior pivot. This stop loss approach has demonstrated reliability when used alongside price action patterns.
In addition to this fixed stop loss, you can specify a percentage buffer, offering protection against potential stop hunting due to market fluctuations. This buffer helps protect your positions from sudden price swings. For example, selecting a 1% buffer means your stop loss will be positioned 1% higher or lower concerning the last pivot, depending on your trade's direction. This added layer of security ensures your trades remain resilient and less vulnerable to market volatility.
▶️ A practical feature of this strategy is the "Risk-Free" option. Once activated, it continuously monitors price movements, and as soon as the price progresses in the trade's direction and surpasses the designated Risk-Free Trigger Point in percentage, the stop loss is dynamically shifted from its initial position to the entry price, effectively making the trade "risk-free." This means that if the trade doesn't go as expected, we exit at the entry point, incurring neither profit nor loss from the trade.
Additionally, you have the flexibility to fine-tune the modified stop loss, positioning it slightly above or below the entry price through the configuration of a specified percentage. This allows for effective consideration of commission fees in your trading strategy.
▶️ Risk management is a crucial concept in trading, playing a significant role in a trader's long-term success. This strategy introduces a unique feature called "Fixed Loss Position Sizing", where upon activation, you can limit the risk exposure to a specified percentage of your capital per trade. Set your preferred risk percentage along with the intended leverage. The strategy independently considers your available capital and designated leverage, determining the position size before executing any trade.
In the case of a stop loss, your loss is limited to the specified risk percentage. For instance, with a $1000 account and a 1% risk set, the strategy adjusts each trade's size to ensure a maximum loss of $10 if the stop loss is triggered. Enabling this feature will ensure disciplined risk management, aligning potential losses precisely with your predetermined risk percentage, contingent upon your total available capital.
▶️ Another feature of this strategy is a sophisticated mechanism called "Loss Compensation". When enabled, Loss Compensation dynamically adjusts the position size after a loss, aiming to recover from previous losses in subsequent trades. This adaptive mechanism continually modifies the position size to mitigate the impact of consecutive losses until reaching a user-defined limit for consecutive loss compensations.
The feature's configurability allows users to set the maximum number of consecutive losses to compensate for and also includes an option to factor in trading fees from prior trades into the compensation calculation. Loss Compensation operates in conjunction with the 'Fixed Loss Position Sizing' setting, ensuring that once losses are sufficiently compensated, subsequent entries revert to the predefined configurations within the 'Fixed Loss Position Sizing' settings.
This advanced tool ensures a stable risk management approach by changing trade sizes dynamically according to past results during consecutive loss periods.
▶️ This strategy incorporates a feature known as the "Counter-Pattern Breakout", altering its approach to wedge, triangle, and channel pattern breakouts. Normally, the strategy relies on standard pattern signals to determine whether to enter long or short positions based on breakout directions.
For example, in an ascending channel or a rising wedge pattern, the strategy typically seeks a short position opportunity upon a confirmed breakout in the lower line, and breakouts from the upper line are disregarded by the strategy. But with this feature enabled, strategy disregards the conventional pattern signals, seizing breakouts from upper or lower lines to open corresponding positions. For instance, in the ascending channel or the rising wedge pattern example, the strategy might enter a long position if the upper line breaks or a short position if the lower line breaks.
This introduces a more adaptive and opportunistic trading style, allowing you to capitalize on price movements, irrespective of the typical signal direction indicated by the pattern.
▶️ This strategy is fully compatible with third-party trading bots, allowing for easy connectivity to popular trading platforms. By leveraging the TradingView webhook functionality, you can effortlessly link the strategy to your preferred bot and receive accurate signals for position entry and exit. The strategy provides all the necessary alert message fields, ensuring a smooth and user-friendly trading experience. With this integration, you can automate the execution of trades, saving time and effort while enjoying the benefits of this powerful strategy.
⚙️ How to Use & Configure User Settings:
To fully utilize the "Price Action Pattern Breakout Strategy: Wedge, Triangle, Channel," it's essential to consider and comprehend the following steps. They play a crucial role in enhancing its functionality and achieving its utmost potential outcomes:
1. General Strategy Settings:
Enable Dark Mode if using a dark TradingView theme for improved chart visibility.
Select the Strategy's Trade Direction: Long, Short, or Both.
Choose Pattern Recognition Accuracy: High for precise recognition but fewer positions, Low for more positions with slightly less accuracy.
Enable 'Prevent New Entry on Opposite Signal While In Position' to avoid new trades if the opposite signal occurs.
Switch to Indicator Mode if solely using the strategy as an indicator or in combination with other strategies.
2. Pattern and Pivot Configuration:
Consider configuring the Number of Patterns and Pivot Lookback Lengths. Here, you can personalize the pivot lookback lengths for wedge, triangle, and channel patterns across eight different settings on your chart. For lower time frames, consider larger lengths to reduce chart noise. Alternatively, to maintain clarity on your chart, you can disable multiple patterns with different lengths while ensuring at least one pattern remains enabled.
Note that enabling more patterns doesn't always equate to increased potential profit. Sometimes, fewer patterns result in greater profit potential, and vice versa. Experiment with lengths and the number of patterns to determine the most profitable and optimal outcome for your trading symbol and timeframe.
3. Targeting System Selection:
Choose between 'Fixed Targets' or 'Trailing Targets' for your targeting system.
'Fixed Targets' is the default setting, operational when 'Trailing Targets' are turned off.
Set the TP1 Position Size as a percentage, defining the size for TP1, and the rest exits at TP2.
Optionally activate 'Skip Entry if TP1 is Passed' to bypass entering positions if the price has exceeded TP1.
Alternatively, opt for the 'Trailing Target' for dynamic exits based on trigger points and offsets. Note that this option disables fixed targets.
4. Stop Loss Configuration:
Determine the number of candles to consider for stop loss placement based on the last pivot.
Optionally add a percentage to the stop loss to create a buffer against market fluctuations, guarding your positions from sudden price swings.
5. Risk Management Configuration:
You can activate the 'Risk-Free' feature, making your trades risk-free by moving the stop loss to the entry price upon reaching a specified trigger point.
You have the possibility to enable 'Fixed Loss Position Sizing' to limit risk to a percentage of total capital per trade, ensuring prudent risk management.
You can employ 'Use Real-Time Balance for Each Entry' to precisely calculate fixed loss position sizing according to the real-time balance for every entry.
The 'Loss Compensation' feature can be activated to automatically adjust trade sizes during consecutive losses and compensate for prior incurred losses.
Loss compensation continues adjusting trade sizes until it reaches the defined limit of consecutive losses specified in the 'Maximum Consecutive Losses To Compensate' field.
You can factor in commission fees by specifying a percentage in the 'Include Trading Fees in Compensation (%)' field, providing an option for more accurate loss compensation calculations.
You have the option to enable 'Limit Compensation to Real-Time Balance' to prevent consecutive loss compensation from exceeding your current real-time account balance.
It's important to note that for the 'Loss Compensation' feature to operate, the 'Fixed Loss Position Sizing' must be enabled.
6. Counter-Pattern Breakout Configuration:
In this section you have the option to enable the "Counter-Pattern Breakout" feature to adjust the strategy's approach to wedge, triangle, and channel pattern breakouts. Once enabled, the strategy disregards traditional pattern signals and capitalizes on breakouts from either the upper or lower lines, initiating corresponding positions accordingly.
Choose between 'Fixed Target' or 'Trailing Target' for your targeting system. If you opt for the 'Fixed Target', set a specific target point as a percentage, serving as the default target for counter-pattern breakouts. Alternatively, choose the 'Trailing Target' for dynamic exits based on trigger points and offsets. Do keep in mind that selecting the 'Trailing Target' option disables the fixed target setting.
Keep in mind that for standard, non-counter-pattern breakouts, the target point settings in their respective sections remain applicable, distinct from the settings configured for targeting within this section.
Note that the stop loss configurations are shared across standard pattern and counter-pattern breakouts and can be adjusted within the stop loss section.
7. Info Tables:
In the info tables section, you can show or hide different tables on the charts. This includes the backtest table, the current balance table displaying available funds, and a table showcasing Maximum Consecutive Wins or Losses. Choose which to display according to your preferences and specific needs.
8.Date & Time Range Filter:
Utilize the Date & Time Range filter feature to precisely select a start and end date, including time, to filter data within the chosen range.
When connecting this strategy to a trading bot for automated trades, ensure to set the start date and time to the intended initiation moment to avoid undesired outcomes as this directly affects the real-time balance calculations of the strategy.
8. Integration with Third-Party Bots:
To automate trading, leverage the strategy's compatibility with third-party trading bots. Seamlessly integrate the strategy into well-known trading platforms by using alert message fields to input commands from third-party trading bots, enabling automated trade execution for both long and short positions.
By furnishing these adjustable settings, the strategy empowers you to personalize it according to your unique requirements, thereby bolstering the adaptability and efficacy of your trading approach.
🔐 Source Code Protection:
The 'Price Action Pattern Breakout Strategy: Wedge, Triangle, Channel' source code is engineered for precision, reliability, and effectiveness. Its original and innovative design warrants protection and restricted access, preserving the strategy's exclusivity. Safeguarding the code maintains the strategy's integrity and distinctiveness, providing users with a competitive advantage in their trading endeavors.

TradewithPuneet: Pro-PatternsThe Pro-Patterns strategy is designed to trade classic chart patterns. At present, it identifies the Ascending Triangle patterns and Weekly Inside Bars patterns and takes Long or Short entries, as the case may be.
Ascending Triangle patterns:
- The strategy identifies ascending triangle patterns ranging from 40 to 120 days.
- BUY signals are generated on the breakout of the horizontal resistance line. No SHORT signal is generated on the breakdown of the rising trend line.
- The importance is given to higher lows, instead of attempting to make a perfectly straight rising trend line. Hence, the drawing of the rising trend line is skipped.
- The strategy gives BUY signals on continuation as well as reversal patterns.
- Users can choose exit rules either on the breakdown of a certain number of days or based on ATR.
- The Ascending triangle patterns can be seen on Daily timeframes only.
Weekly Inside Bars
- The strategy identifies inside bars on weekly charts with three candles. This means, that Weekly Inside Bars pattern is said to be formed when the current week's candle is inside the previous week and the previous week's candle is inside the week prior to it.
- A BUY or SHORT signal is generated next week on breakout or breakdown of high or low of third week’s candle.
- The importance is given to a decrease in volume on second & third weeks’ candles.
- The strategy gives BUY or SHORT signals on continuation as well as reversal patterns. However, users can choose to see trading signals on continuation patterns only.
- Users can choose exit rule on breakdown or breakout of a certain number of weeks in case of BUY & SHORT signals respectively.
- The Weekly Inside Bars patterns can be seen on Weekly timeframes only.
The strategy guides you the price level at which to BUY / SHORT and EXIT. It is intended for short to medium-term traders. It is important for the security to close beyond the trigger point for the signal to remain in force.

Triangular Moving AverageThe TRIMA is simply the SMA of the SMA -- a double-smoothed simple moving average . The end effect of the double smoothing is that greater weight is placed on values near the middle of the lookback period. It therefore reacts relatively slowly to price changes compared to most moving averages .
But why would I want more lag?
One potential use of this moving average that I've found is that it can allow price to run for a bit after crossing the TRIMA before catching up and creating an opposing signal. It therefore creates the chance for the price to "run its course" so to speak, which can make whipsaw signals less common.
