Turn around Tuesday on Steroids Strategy█ STRATEGY DESCRIPTION
The "Turn around Tuesday on Steroids Strategy" is a mean-reversion strategy designed to identify potential price reversals at the start of the trading week. It enters a long position when specific conditions are met and exits when the price shows strength by exceeding the previous bar's high. This strategy is optimized for ETFs, stocks, and other instruments on the daily timeframe.
█ WHAT IS THE STARTING DAY?
The Starting Day determines the first day of the trading week for the strategy. It can be set to either Sunday or Monday, depending on the instrument being traded. For ETFs and stocks, Monday is recommended. For other instruments, Sunday is recommended.
█ SIGNAL GENERATION
1. LONG ENTRY
A Buy Signal is triggered when:
The current day is the first day of the trading week (either Sunday or Monday, depending on the Starting Day setting).
The close price is lower than the previous day's close (`close < close `).
The previous day's close is also lower than the close two days ago (`close < close `).
The signal occurs within the specified time window (between `Start Time` and `End Time`).
If the MA Filter is enabled, the close price must also be above the 200-period Simple Moving Average (SMA).
2. EXIT CONDITION
A Sell Signal is generated when the current closing price exceeds the high of the previous bar (`close > high `). This indicates that the price has shown strength, potentially confirming the reversal and prompting the strategy to exit the position.
█ ADDITIONAL SETTINGS
Starting Day: Determines the first day of the trading week. Options are Sunday or Monday. Default is Sunday.
Use MA Filter: Enables or disables the 200-period SMA filter for long entries. Default is disabled.
Start Time and End Time: The time window during which the strategy is allowed to execute trades.
█ PERFORMANCE OVERVIEW
This strategy is designed for markets with frequent weekly reversals.
It performs best in volatile conditions where price movements are significant at the start of the trading week.
Backtesting results should be analysed to optimize the Starting Day and MA Filter settings for specific instruments.
Turnaround

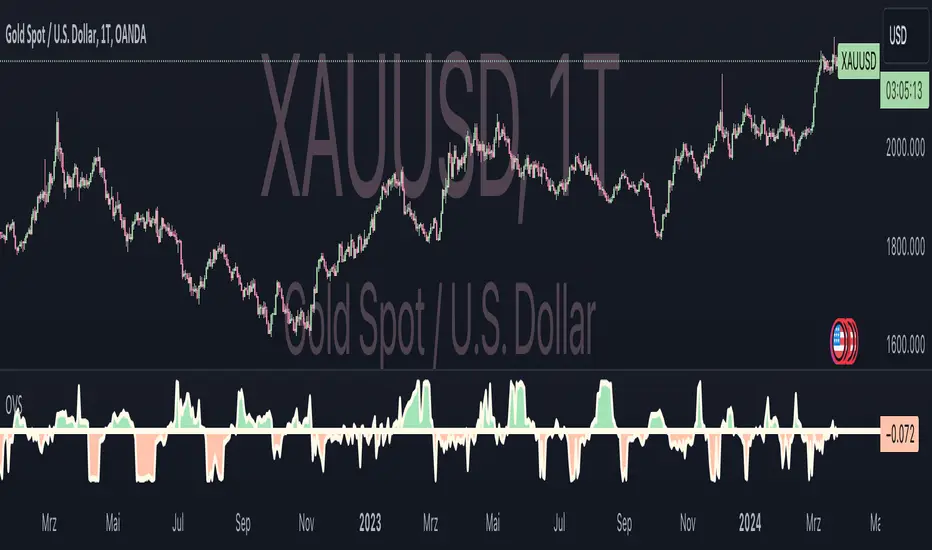
Oster's Vola Sentiment (OVS)Overview:
Oster's Vola Sentiment (OVS) is an indicator that reflects market sentiment dynamics based on volatility , employing Oster's Volatility Method for calculation. Inspired by traditional volatility analysis, this indicator provides a versatile tool for traders to interpret market sentiments and identify potential trading opportunities, including potential reversal points . By adjusting the period length in the settings, users can fine-tune OVS sensitivity to capture buy or sell signals, achieving different signal qualities.
Sophisticated Calculation Methodology:
The OVS derives insights from Oster's Volatility Method, utilizing metrics related to price range and movement to assess market dynamics. It calculates the relative movement index, providing traders with a quantifiable measure of market sentiment. Additionally, OVS incorporates the Average True Range (ATR) to further refine its analysis, ensuring comprehensive insights into market volatility dynamics.
Interpretation:
Oster's Vola Sentiment (OVS) , represented on the chart, offers traders insights into market sentiment dynamics and potential reversal points . Values above 0 indicate a buy tendency, suggesting favorable conditions for buying opportunities, while values below 0 suggest a sell tendency, signaling potential selling pressure. The probability of a significant market move increases as OVS values approach the predefined buy or sell thresholds. Values exceeding the buy threshold indicate stronger buying signals, while values below the sell threshold signify stronger selling signals. By aligning these interpretations with the trader's investment strategy, OVS aids in decision-making processes, offering nuanced perspectives on market movements.
Dynamic Color Coding for Visual Clarity:
To enhance user experience and facilitate quick decision-making, OVS incorporates dynamic color coding . Market conditions favoring selling are denoted by red hues, while those conducive to buying are highlighted in green. Neutral conditions, indicative of balanced market sentiment, are represented in neutral colors. This intuitive visual feedback enables traders to swiftly identify market opportunities and risks, empowering them to make informed trading decisions.
Customizable Parameters for Tailored Analysis:
Acknowledging the diverse trading preferences and strategies of its users, OVS offers customizable parameters. Traders can adjust the period length to fine-tune the indicator's sensitivity to their desired level, balancing the frequency and quality of signals according to their trading objectives. Additionally, OVSs alert functionalities allow traders to set personalized thresholds, aligning with their risk tolerance and market outlook.
Conclusion:
In conclusion, Oster's Vola Sentiment (OVS) emerges as a valuable addition to the trader's toolkit, offering a versatile and accessible approach to market analysis. Built upon Oster's Volatility Method and sophisticated calculation methodologies, OVS provides traders with actionable insights into market sentiment across various timeframes and asset classes , including potential reversal points. Its intuitive visualizations, coupled with customizable parameters and alert functionalities, empower traders to navigate dynamic market conditions with confidence. Whether you're a seasoned investor or a novice trader, OVS equips you with the tools needed to stay ahead in today's competitive markets.
Rob Booker Reversal Tabs StrategyRob Booker Reversal Tabs Strategy is an updated version of Rob Bookers Reversal Tab study: Rob Booker Reversal Tabs
While the original is a Pinescript study, this version can be switched between strategy and indicator mode.
Rob Bookers script generates reversal signal based on MACD and Stochastics, it is not a true reversal system, default pyramiding value is set to 5.
Inputs determine MACD and Stochastics settings. The only additional input is the "Strategy Mode" checkbox.
This script works well on its own for some tickers, but like any reversal pattern generating scripts, traders will profit from looking at overall price action and trend strength before making a trade.
From the original:
A simple reversal pattern indicator that uses MACD and Stochastics.
Created by Rob Booker and programmed by Andrew Palladino.
Please note that I only updated the original to V5 and edited it to be a strategy, which was a grand total of 5 minutes of work. I updated it because I wanted to see how the script performs as a strategy and I'm publishing it in case others would like to use it. I take no credit whatsoever for the original and WILL take this version down if Rob Booker or his Team ask me to or decide to release their own strategy version of the original.
Check out Rob Bookers scripts and ideas on his Tradingview account: robbooker
