Impulsive Trend Detector [dtAlgo]This advanced Pine Script indicator identifies and tracks impulsive price movements based on Break of Structure (BOS) and Change of Character (CHoCH) concepts from Smart Money trading methodology.
The indicator automatically detects pivot highs and lows, then monitors when price breaks these key levels to signal potential impulsive moves. BOS indicates continuation in the current trend direction, while CHoCH signals potential trend reversals. Each detected move is measured from the break point to the next opposing pivot, providing accurate percentage calculations that match TradingView's measuring tool.
Impulsive moves are categorized into four levels based on magnitude (Level 1: 5-10%, Level 2: 10-15%, Level 3: 15-20%, Level 4: 20%+), with color-coded visual labels and connecting lines displayed directly on the chart.
Comprehensive Session Analysis:
Track moves across 11 distinct trading sessions in Eastern Time: Pre-London/NY, London/NY overlap, NY (with Power Hour and End subdivisions), Sydney, Asia, Sake Time, Asia/London overlap, London, Weekend, and No Session periods.
Three Dynamic Tables provide:
Real-time statistics (bullish/bearish, BOS/CHoCH, levels)
Session breakdown with move counts and average percentages
Event log showing last 10 moves with date, day, session, direction, type, level, percentage, duration, and bar count
Perfect for Smart Money traders seeking data-driven insights into market structure behavior across global trading sessions.
Biến động

IDAHL | QuantEdgeBIDAHL | QuantEdgeB
🔍 Overview
The IDAHL indicator builds adaptive, volatility-aware threshold bands from two separate ALMA lines—one smoothed from recent highs, the other from recent lows—then uses percentiles of those lines to define a dynamic “high/low” channel. Price crossing above or below that channel triggers clear long/short signals, with on-chart candle coloring, fills, optional labels and even a built-in backtest table.
✨ Key Features
• 📈 Dual ALMA Bands (with DEMA pre-smoothing)
o High ALMA: ALMA applied to DEMA-smoothed highs (high → DEMA(30) → ALMA).
o Low ALMA: ALMA applied to DEMA-smoothed lows (low → DEMA(30) → ALMA).
• 📊 Percentile Thresholds
o Computes a high threshold at the Xth percentile of the High ALMA over a lookback window.
o Computes a low threshold at the Yth percentile of the Low ALMA.
o Shifts each threshold forward by a small period to reduce repainting.
• ⚡ Dynamic Channel Logic
o When price closes above the high percentile line, the “final” threshold flips down to the low percentile line (and vice versa), creating an adaptive channel that only moves when the outer bound is violated.
o Inside the channel, the threshold holds its last value to avoid whipsaw.
• 🎨 Visual & Alerts
o Plots the two percentile lines and fills between them with a color that reflects the current regime (green for long, yellow for neutral, orange for short).
o Colors your candles to match the active signal.
o Optional “Long”/“Short” labels on confirmed flips.
o Alert conditions fire on each long/short crossover.
• 📊 On-Chart Backtest Metrics
o Toggle on a small performance table—complete with win-rate, net P/L, drawdown—from your chosen start date, without any extra code.
⚙️ How It Works
1. Adaptive Smoothing (ALMA)
o Uses ALMA (Arnaud Legoux Moving Average) for smooth, low-lag filtering. In this script, the inputs are additionally pre-smoothed with DEMA(30) to reduce noise before ALMA is applied—improving stability on highs/lows.
2. Percentile Lines
o The High ALMA series feeds a linear-interpolation percentile function to generate the upper bound; the Low ALMA produces the lower bound.
o These lines are offset by a small look-ahead (X bars) to reduce repaint behavior.
3. Channel Logic
o Breakout Flip: When the selected source (default: Close) closes above the upper bound, the active threshold “jumps” to the lower bound—locking in a new channel until price next crosses.
o Breakdown Flip: Conversely, a close below the lower bound flips the threshold to the upper bound.
4. Signal Generation
o Long while the source is above the current “final” threshold.
o Short while below.
o Neutral inside the channel before any flip.
5. Visualization & Alerts
o Dynamic fills between the two percentile lines change hue as the regime flips.
o Candles adopt the regime color.
o Optional pinned “Long”/“Short” labels at flip bars.
o Alerts on every signal crossover of the zero-based regime line.
6. Backtest Table
o From your chosen start date, a mini-table displays cumulative P/L, win rate and drawdown for this strategy—handy for quick in-chart validation.
🎯 Who Should Use It
• Breakout Traders hunting for adaptive channels that auto-recenter on new highs/lows.
• Volatility Traders who want thresholds that expand and contract with market turbulence.
• Trend-Chasers seeking a fresh take on high/low channels with built-in smoothing.
• Systematic Analysts who appreciate on-chart backtesting without leaving TradingView.
⚙️ Default Settings
• ALMA Length: 14
• Percentile Length: 35 bars
• Percentile Lookback Period (offset): 4 bars
• Upper Percentile: 92%
• Lower Percentile: 50%
• Threshold Source: Close
• Visuals: Candle coloring on, labels off by default, “Strategy” palette
• Backtest Table: on by default (toggleable)
• Start Date (Backtest): 09 Oct 2017
📌 Conclusion
IDAHL blends two smooth, low-lag ALMA filters (fed by DEMA-smoothed highs/lows) with percentile-based channel construction for a self-rewiring high/low envelope. It gives you robust breakout/breakdown signals, immediate visual context via colored fills and candles, optional labels, alerts, and even performance stats—everything you need to spot and confirm regime shifts in one compact script.
🔹 Disclaimer : Past performance is not indicative of future results. Always backtest and align settings with your risk tolerance and objectives before live trading.
🔹 Strategic Advice : Always backtest, optimize, and align parameters with your trading objectives and risk tolerance before live trading.

TwinSmooth ATR Bands | QuantEdgeBTwinSmooth ATR Bands | QuantEdgeB
🔍 Overview
TwinSmooth ATR Bands | QuantEdgeB is a dual-smoothing, ATR-adaptive trend filter that blends two complementary smoothing engines into a single baseline, then builds dynamic ATR bands around it to detect decisive breakouts. When price closes above the upper band it triggers a Long regime; when it closes below the lower band it flips to Short—otherwise it stays neutral. The script enhances clarity with regime-colored candles, an active-band fill, and an optional on-chart backtest table.
✨ Key Features
1. 🧠 Twin-Smooth Baseline (Dual Engine Blend)
- Computes two separate smoothed baselines (a slower “smooth” leg + a faster “responsive” leg).
- Blends them into a single midpoint baseline for balanced stability + speed.
- Applies an extra EMA smoothing pass to produce a clean trend_base.
2. 📏 ATR Volatility Bands
- Builds upper/lower bands using ATR × multiplier around the trend_base.
- Bands expand in volatile conditions and contract when markets quiet down—auto-adapting without manual tweaks.
3. ⚡ Clear Breakout Regime Logic
- Long when close > upperBand.
- Short when close < lowerBand.
- Neutral otherwise (no forced signals inside the band zone).
4. 🎨 Visual Clarity
- Plots only the active band (lower band in long regime, upper band in short regime).
- Fills between active band and price for instant regime context.
- Colors candles to match the current state (bullish / bearish / neutral).
- Multiple color palettes + transparency control.
💼 Use Cases
• Trend Confirmation Filter: Use the regime as a higher-confidence trend gate for entries from other indicators.
• Breakout/Breakdown Trigger: Trade closes outside ATR bands to catch momentum expansions.
• Volatility-Aware Stops/Targets: Bands naturally reflect volatility, making them useful as adaptive reference levels.
• Multi-Timeframe Alignment: Confirm higher-timeframe regime before executing on lower timeframes.
🎯 For Who
• Trend Traders who want clean regime shifts without constant whipsaw.
• Breakout Traders who prefer confirmation via ATR expansion rather than raw MA crossovers.
• System Builders needing a simple, robust “state engine” (Long / Short / Neutral) to plug into larger strategies.
• Analysts who want quick on-chart validation with a backtest table.
⚙️ Default Settings
• SMMA Length (Base Smooth Leg): 24
• TEMA Length (Base Responsive Leg): 8
• EMA Extra Smoothing: 14
• ATR Length: 14
• ATR Multiplier: 1.1
• Color Mode: Alpha
• Color Transparency: 30
• Backtest Table: On (toggleable)
• Backtest Start Date: 09 Oct 2017
• Labels: Off by default
📌 Conclusion
TwinSmooth ATR Bands | QuantEdgeB merges a dual-speed smoothing core into a single trend baseline, then wraps it with ATR-based bands to deliver clean, volatility-adjusted breakout signals. With regime coloring, active-band plotting, and optional backtest stats, it’s a compact, readable tool for spotting momentum shifts and trend continuation across any market and timeframe.
🔹 Disclaimer: Past performance is not indicative of future results. Always backtest and align settings with your risk tolerance and objectives before live trading.
🔹 Strategic Advice: Always backtest, optimize, and align parameters with your trading objectives and risk tolerance before live trading.

SD-Range Oscillator | QuantEdgeBSD-Range Oscillator | QuantEdgeB
🔍 Overview
SD-Range Oscillator | QuantEdgeB (SDRO) is a normalized momentum oscillator that compresses a low-lag trend core into a 0–100 style range using standard-deviation (SD) bands. It builds a smooth baseline from a fast triple-smoothed average, wraps it with ±2×SD volatility bounds, then normalizes the core value inside that envelope. Clear Long/Short regimes trigger when the normalized value crosses user-defined thresholds, with optional labels, regime-colored candles, and intuitive filled zones.
✨ Key Features
1.⚡ Low-Lag Core (Triple-Smooth Engine)
- Uses a fast, low-lag triple-smoothed average as the oscillator’s primary signal input.
- Helps keep momentum readings responsive while filtering noise.
2. 📏 SD Volatility Envelope (±2×SD)
- Builds a volatility channel around a smoothed baseline using standard deviation.
- Automatically adapts to changing market turbulence.
3. 🧮 Normalized Range Output
- Converts the core signal into a normalized value by mapping it between the upper/lower SD bounds.
- Makes readings consistent across assets and timeframes.
4. 🎯 Threshold-Based Regimes
- Long when the normalized value exceeds the Long threshold.
- Short when it falls below the Short threshold.
- Includes an additional safety filter to reduce “forced” longs when price is already extended near the upper envelope.
5. 🎨 Visual Clarity & Zones
- Regime-colored oscillator line and candles.
- Filled SD bands around the baseline for quick volatility context.
- Optional highlight fills between the oscillator and thresholds to show active long/short phases.
- Extra OB/OS background zones for quick overextension awareness.
6. 🔔 Signals & Alerts
- Optional “Long/Short” labels on confirmed regime flips.
- Alert conditions fire on long/short regime crossovers.
💼 Use Cases
• Momentum Confirmation: Validate breakouts by requiring SDRO to hold above the Long threshold.
• Mean-Reversion Awareness: Watch for extreme normalized readings near upper/lower bounds.
• Regime Filtering: Use SDRO state (Long/Short/Neutral) to filter trades from other systems.
• Cross-Market Comparison: Normalization makes it easier to compare momentum across different tickers.
🎯 For Who
• Trend traders who want a clean momentum filter with adaptive volatility context.
• System builders needing a simple regime variable (1 / -1 / neutral) to gate entries.
• Discretionary traders who like visual confirmation (fills, candle coloring, threshold zones).
• Multi-asset traders who benefit from normalized, comparable oscillator readings.
⚙️ Default Settings
• TEMA Period: 7
• Base Length (SMMA): 25
• Long Threshold: 55
• Short Threshold: 45
• SD Multiplier: 2× (fixed in code)
• Color Mode: Alpha
• Color Transparency: 60
• Labels: Off by default
📌 Conclusion
SD-Range Oscillator | QuantEdgeB blends a low-lag triple-smoothed core with an adaptive SD envelope to produce a normalized, easy-to-read momentum signal. With clear threshold regimes, volatility-aware context, and strong visuals (fills + candle coloring), SDRO helps separate meaningful momentum shifts from noise across any asset or timeframe.
🔹 Disclaimer: Past performance is not indicative of future results. Always backtest and align settings with your risk tolerance and objectives before live trading.
🔹 Strategic Advice: Always backtest, optimize, and align parameters with your trading objectives and risk tolerance before live trading.

Gemini Smart SMA Pro + Wyckoff V2 (Enhanced Cloud)The Smart SMA Pro + Wyckoff V2 is an advanced trend-following and market-cycle indicator built for traders who utilize Wyckoff Theory and Volume Spread Analysis (VSA). It is specifically designed to identify the transition from "Cause" (Squeeze/Accumulation) to "Effect" (Expansion/Markup).
By analyzing the volatility spread between two customizable Moving Averages and validating movements with relative volume, this tool helps traders stay out of sideways markets and enter only when high-conviction momentum is present.
Key Features
Wyckoff Phase Detection: Automatically detects Squeeze (Accumulation/Distribution) and Expansion (Markup/Markdown) phases.
Intelligent Dynamic Cloud: The cloud between the MAs changes its transparency dynamically based on the Volume Ratio and trend slope. Darker colors indicate high-volume trend confirmation.
Dual-Layered SOS/SOW Signals: * SOS (Sign of Strength): A Yellow Dot appears on a bullish squeeze breakout. A Yellow Arrow is added only if the move is validated by High Relative Volume.
SOW (Sign of Weakness): An Orange Dot appears on a bearish breakout, with an Orange Arrow appearing only if supported by high volume.
Live Multi-Data Dashboard: A real-time table displaying the status of Fast/Slow MAs, the current market cycle stage, and the Volume Ratio.
Professional Alerts: Built-in alerts for Sign of Strength (SOS) and Sign of Weakness (SOW) breakouts.
How to Trade with it
Grey Cloud (Squeeze): Market is building a "Cause." Avoid trading and prepare for a breakout.
Yellow Dot + Arrow: This is a Confirmed SOS. It indicates institutional participation and a high probability of a new Markup phase.
Buy/Sell Labels: Standard trend entries based on price crossing the Signal Line (Fast MA). Use these to join an already established trend.
Dashboard Monitoring: Check the "Vol. Ratio" to see if the current move has enough strength to sustain the expansion.
How this Indicator was Created
This project is the result of a cutting-edge collaborative development process between a human trader and Gemini (Google’s AI).
Logic Synthesis: We combined traditional technical analysis with AI-optimized algorithms to calculate the Volatility Ratio, ensuring the "Squeeze" detection is more accurate than standard Bollinger-based tools.
Conditional Visuals: The logic was refined through multiple iterations to create a "Smart Visual" system. For instance, the Volume-Validated Arrow was an architectural decision to separate minor breakouts from high-conviction institutional moves.
Code Optimization: The entire script was written in Pine Script® V6, ensuring maximum performance, low latency on charts, and a clean, responsive Dashboard interface using advanced table objects.
----------------------------------------------------------------------------------------------------------------------------------------------------
The Partnership: This indicator represents the perfect synergy between human market intuition and AI’s computational precision, resulting in a tool that is both mathematically sound and visually intuitive for professional use.

SMC Post-Analysis Lab [PhenLabs]📊 SMC Post-Analysis Lab
Version: PineScript™ v6
📌 Description
The SMC Post-Analysis Lab is a dedicated hindsight analysis tool built for traders who want to understand what really happened during any historical trading period. Unlike forward-looking indicators, this tool lets you scroll back through time and instantly receive algorithmic classification of market states using Smart Money Concepts methodology.
Whether you’re reviewing a losing trade, studying a successful session, or building your pattern recognition skills, this indicator provides immediate context. The expansion-aware algorithm processes price action within your selected window and outputs clear, actionable classifications ranging from Parabolic Expansion to Consolidation Inducements.
Stop relying on subjective post-trade analysis. Let the algorithm objectively tell you whether institutional players were accumulating, distributing, or running inducements during your trades.
🚀 Points of Innovation
First indicator specifically designed for SMC-based post-trade review rather than live signal generation
Dual-mode analysis system allowing both dynamic scrollback and precise date selection
Expansion-aware classification algorithm that weighs range position against net displacement
Real-time efficiency metrics calculating directional quality of price movement
Integrated visual FVG detection within the analysis window only
Interactive table with clickable date range adjustment via chart interface
🔧 Core Components
Pivot Detection Engine: Uses configurable pivot length to identify significant swing highs and lows for structure break detection
Window Calculator: Determines active analysis zone based on either bar offset or timestamp boundaries
Data Aggregator: Tracks window open, high, low, close and counts bullish/bearish structure break events
State Classification Algorithm: Applies hierarchical logic to determine market state from six possible classifications
Visual Renderer: Draws structure breaks, FVG boxes, and window highlighting within the active zone
🔥 Key Features
Sliding Window Mode: Use the Scroll Back slider to dynamically move your analysis zone backwards through history bar-by-bar
Date Range Mode: Select specific start and end timestamps for precise session or trade review
Six Market State Classifications: Parabolic Expansion (Bull/Bear), Bullish/Bearish Order Flow, Accumulation/Distribution Reversal, and Consolidation/Inducement
Range Position Percentile: See exactly where price closed relative to the window’s high-low range as a percentage
Bull/Bear Event Counter: Quantified count of structure breaks in each direction during the analysis period
Efficiency Calculation: Net move divided by total range reveals trending quality versus chop
🎨 Visualization
Blue Window Highlight: Active analysis zone is clearly marked with blue background shading on the chart
Structure Break Lines: Dashed lines appear at each bullish or bearish structure break within the window
FVG Boxes: Fair Value Gaps automatically render as semi-transparent boxes in bullish or bearish colors
Dashboard Table: Top-right positioned table displays State, Analysis description, and Metrics in real-time
Color-Coded States: Each classification uses distinct coloring for immediate visual recognition
Interactive Tip Row: Optional help text guides users on clicking the table to adjust date range
📖 Usage Guidelines
General Configuration
Analysis Mode: Default is Sliding Window. Choose Date Range for specific timestamp analysis.
Sliding Window Settings
Scroll Back (Bars): Default 0. Increase to move window backwards into history.
Window Width (Bars): Default 100. Range 20-50 for scalping, 100+ for swing analysis.
Date Range Settings
Start Date: Select the beginning timestamp for your analysis period.
End Date: Select the ending timestamp for your analysis period.
Visual Settings
Show Help Tip: Default true. Toggle to hide instructional row in dashboard.
Bullish Color: Default teal. Customize for bullish elements.
Bearish Color: Default red. Customize for bearish elements.
SMC Parameters
Pivot Length: Default 5. Lower values (3-5) catch minor breaks. Higher values (10+) focus on major swings.
✅ Best Use Cases
Post-trade review to understand why entries succeeded or failed
Session analysis to identify institutional activity patterns
Trade journaling with objective algorithmic classifications
Pattern recognition training through historical scrollback
Identifying whether stop hunts were inducements or legitimate breaks
Comparing your real-time read versus what the algorithm detected
⚠️ Limitations
Designed for historical analysis only, not live trade signals
Classification accuracy depends on appropriate pivot length for the timeframe
FVG detection uses simple gap logic without mitigation tracking
State classification is based on window data only, not broader context
Requires manual scrolling or date input to review different periods
💡 What Makes This Unique
Purpose-Built for Review: Unlike most indicators focused on live signals, this is designed specifically for post-trade analysis
Expansion-Aware Logic: Algorithm weighs both position in range AND directional efficiency for accurate state detection
Interactive Date Control: Click the dashboard table to reveal draggable anchors for window adjustment directly on chart
🔬 How It Works
1. Window Definition:
User selects either Sliding Window or Date Range mode
System calculates which bars fall within the active analysis zone
Active zone receives blue background highlighting
2. Data Collection:
Algorithm captures window open, running high, running low, and current close
Structure breaks are detected when price crosses above last pivot high or below last pivot low
Bullish and bearish events are counted separately
3. State Classification:
Range Position calculates where close sits as percentage of high-low range
Efficiency calculates net move divided by total range
Hierarchical logic applies priority rules from Parabolic states down to Consolidation
4. Output Rendering:
Dashboard table updates with State title, Analysis description, and Metrics
Visual elements render within window only to keep chart clean
Colors reflect bullish, bearish, or neutral classification
💡 Note:
This indicator is intended for educational and review purposes. Use it to develop your understanding of Smart Money Concepts by analyzing what institutional order flow looked like during historical periods. Combine insights with your own analysis methodology for best results.

TSF - Rel Vol & Stop calcSimple swing data table showing:
1. Avg 20D dollar vol
2. Live dollar vol
3. Live % relative vol compared to avg 20d daily vol
4.Percent to LOD current price with color codes
5. Avg 20d ATR%

Swing HelperThis script, titled "Swing helper", is a multi-metric dashboard designed to provide a comprehensive snapshot of a security's volatility, relative volume, and price action health directly on the chart. It focuses on Average Daily Range (ADR) relationship and key performance indicators to help traders identify setups like volatility contractions or trend strength.
Key Features
Dual-ADR Analysis: Calculates and compares Long-Term (LT) and Short-Term (ST) ADR percentages. The ADR Ratio helps identify when volatility is expanding or contracting relative to historical norms.
Relative Volume (RVol): Compares current volume to a 20-day moving average, highlighting institutional participation.
Dynamic Closing Range: Visualizes where the price is closing relative to the day's true range (the "Closing Range %"), indicating buying or selling pressure.
SMA 50 Distance: A unique metric that measures the price's distance from the 50-day Simple Moving Average in "ADR units," helping to gauge how overextended a stock is.
Automated Price Projections: Dynamically plots -1x and -2x ADR levels from the current price to provide immediate downside targets or support levels.
Custom Bar Coloring: Highlights specific price action patterns:
Inside Days (Blue)
Upside Reversals (Green)
Downside Reversals (Red)
Visual Customization
The script includes a highly flexible Summary Table with customizable positions, sizes, and colors (including borders and headers), allowing it to fit into any dark or light mode chart layout without obstructing price action.
How to Use
Volatility Contraction: Watch for the ADR Ratio to drop, indicating a tightening range before a potential breakout.
Relative Strength: Look for high RVol combined with a high Closing Range % (e.g., >75%) to confirm strong demand.
Mean Reversion: Use the SMA50 Dist metric to identify when a stock is "stretched" too far from its moving average relative to its daily volatility.

Momentum Echo Oscillator [Community Edition]Concept: The Momentum Echo Oscillator (MEO) is a modern take on classical momentum oscillators. Most indicators only look at the "now". MEO introduces the concept of Momentum Echoes—historical momentum harmonics that are weighted and blended back into the current price velocity.
Why use MEO? Standard momentum tools (like ROC or RSI) can be very "jittery" or noisy. By integrating historical echoes, MEO provides a smoother, more rhythmic representation of price flow, making it easier to spot genuine trend reversals.
Key Elements:
Primary Momentum: The immediate speed of price.
Echo Harmonics: Two adjustable lookback points that act as a "memory" for the indicator, filtering out false breakouts.
Dynamic Histogram: Visualizes the gap between the Echo Engine and the Trigger Line, highlighting acceleration and deceleration.
Settings:
Echo Weight: Adjust how much "memory" you want the indicator to have.
Smoothing: Clean up the signals for higher timeframes.
This is an open-source tool for the TradingView community. Enjoy!

High-Probability Scalper (Market Open)Market open is where volatility is real, spreads are tight, and momentum shows itself early. This scalping strategy is built specifically to operate during that window, filtering out low-quality signals that usually appear later in the session.
Instead of trading all day, the logic is restricted to the first 90 minutes after market open, where continuation moves and fast pullbacks are more reliable.
What This Strategy Does
This script looks for short-term momentum alignment using:
Fast vs slow EMA structure
RSI confirmation to avoid chasing extremes
ATR-based risk control
Session-based filtering to trade only when volume matters
It’s designed for intraday scalping, not swing trading.
Core Trading Logic
1. Market Open Filter
Trades are allowed only between 09:30 – 11:00 exchange time.
This avoids low-liquidity chop and focuses on the period where most breakouts and reversals form.
2. Trend Confirmation
Bullish bias: 9 EMA crosses above 21 EMA
Bearish bias: 9 EMA crosses below 21 EMA
This keeps trades aligned with short-term direction instead of random entries.
3. Momentum Check (RSI)
RSI is used as a quality filter, not as an overbought/oversold signal.
Long trades only when RSI is strong but not extended
Short trades only when RSI shows weakness without exhaustion
This removes late entries and reduces whipsaws.
Entries & Exits
Entries
Executed only on confirmed candles
No intrabar repainting
One position at a time
Risk Management
Stop-loss based on ATR
Take-profit calculated using a fixed risk–reward ratio
Same structure for both long and short trades
This keeps risk consistent across different symbols and volatility levels.
Why This Strategy Works Better at Market Open
Volume is highest
False breakouts are fewer
EMA crosses have follow-through
RSI behaves more cleanly
By not trading all day, the strategy avoids most of the noise that kills scalpers.
Best Use Cases
Index futures
High-liquidity stocks
Major crypto pairs during active sessions
1m to 5m timeframes
What This Strategy Is NOT
Not a martingale
Not grid-based
Not designed for ranging markets
Not a “set and forget” system
It’s a controlled scalping template meant for disciplined execution.
How to Use It Properly
Test on multiple symbols
Adjust ATR length for volatility
Tune RSI ranges per market
Always forward-test before live alerts
Final Note
This strategy focuses on structure, timing, and risk, not indicator stacking.
If you trade the open, this gives you a clear framework instead of emotional entries.
If you want:
Alerts
Session customization
News filters
Partial exits
You can extend this logic without breaking the core system.

MACD Classic MT5 Style (2 Lines + Histogram)MACD Classic MT5 Style (แบบ MetaTrader 5) มีความแตกต่างจาก MACD ทั่วไปที่ใช้กันใน TradingView พอสมควรครับ นี่คือคำอธิบายว่ามันทำงานอย่างไรและอ่านค่าอย่างไรครับ:
1. ความแตกต่างสำคัญ (Key Difference)
MACD ทั่วไป (Standard):
มี 2 เส้น (เส้น MACD และ เส้น Signal)
ฮิสโตแกรม (แท่งกราฟ) คือ ส่วนต่าง (Gap) ระหว่าง 2 เส้นนั้น
MACD แบบ MT5 (Classic MT5):
เส้น MACD จะถูกวาดออกมาเป็น แท่งกราฟ (Histogram) แทนที่จะเป็นเส้น
เส้น Signal จะเป็น เส้น (Line) สีแดงพาดผ่านแท่งกราฟ
สรุปคือ: ในแบบ MT5 แท่งกราฟคือตัวพระเอก (MACD) ส่วนเส้นคือตัวช่วยกรอง (Signal)
Here is the English translation of the explanation:
MACD Classic MT5 Style vs. Standard MACD
The "Classic MT5 Style" MACD differs significantly from the standard MACD typically found on TradingView. Below is an explanation of its mechanics and how to interpret it.
1. Key Differences
Standard MACD (TradingView Default):
Displays 2 Lines (MACD Line and Signal Line).
The Histogram represents the difference (gap) between those two lines.
MT5 Style MACD (Classic):
The MACD value is plotted as a Histogram (bars) instead of a line.
The Signal Line appears as a standard Line (usually red) overlaying the histogram.
In summary: In the MT5 style, the Histogram represents the actual MACD Line, while the separate line acts as the Signal filter.

Clock&Flow: Elements of Cycle Analysis 2nd partClock&Flow – Elements of Cycle Analysis (ECA) | Complete Suite
Elements of Cycle Analysis (ECA) is an advanced cyclic analysis suite designed to interpret the market through time, structure, strength, and energy, combining cycles, volatility, and participation into a single operational framework.
The suite consists of two complementary modules:
🔹ECA 1 – Cycles, Structure, and Volatility (Overlay: True)
ECA 1 is dedicated to the structural and temporal analysis of the market.
Cyclic SMAs (Cyclic Ratio) Moving averages are calibrated according to nominal cycles and timeframes to monitor multiple cycles simultaneously (from the lower cycle to the upper cycles). Crossovers between fast and slow SMAs certify the closing or transition of the cycle related to the faster SMA. The specific cycle is identified in the Info Table at the bottom right (for 15m - 1h - 2h - 1D timeframes). You can select the number of cycles to observe and the asset type to apply them to:
Index: Standard quotes (e.g., Cash sessions).
Future: Extended quotes (24h).
50-200: Classic institutional references for the medium-long term.
ATR-based Dynamic Cyclic Channels The channels represent a lower cycle and its upper counterpart; their width is determined by the observed timeframe and calculated based on average volatility (ATR). Volatility is not treated as noise but as a structural component of the cycle, essential for contextualizing excesses, compressions, and expansions.
Info Table and Quick Guide Dynamic tables automatically link SMAs, timeframes, and time cycles, providing an immediate reading of the current cyclic context.
Time Bands (Weekly / Daily) Temporal visualization helps identify cyclic pivots and rhythm transitions.
🔹 ECA 2 – Market Excesses, Strength, and Energy
ECA 2 analyzes how the market moves within the cyclic structure.
Excesses and Divergences (Cyclic Stochastic) An oscillator calibrated on the same cyclic ratio as the suite. Crossovers between the lower cycle (blue) and upper cycle (red) signal potential phase changes. In areas of excess, divergences often confirm the closing and restart of a cycle.
Directional Movement System (DMS) The ADX measures the strength of the movement, while +DI and -DI indicate direction. A simultaneous crossover of ADX, +DI, and -DI signals imminent acceleration, even before the strength is fully expressed.
Market Pulse – Real Market Energy The Market Pulse measures the amount of real energy moving through the market by relating three factors:
Price Velocity
Normalized Volume
Volatility (ATR relative to price)
These three factors are combined multiplicatively: if one is missing, the impulse weakens. The zero line represents a state of energy equilibrium; values above or below indicate a real imbalance (bullish or bearish). Note: Market Pulse is not a classic oscillator and should not be interpreted as overbought or oversold; it is used to evaluate the energetic quality of a movement.
Operational Convergence
The maximum operational effectiveness of the ECA suite is achieved when all modules converge on the same market phase.
When cyclic timing, volatility, price structure, trend strength, and movement energy align, the context signals a high-probability operational phase. The system is applicable to any timeframe or asset because it is not bound by dogmatic or subjective interpretations of technical or fundamental analysis; instead, it leverages what is actually happening in the market. Major chart patterns and Volume Profile (technically not includable in this specific suite) provide further confirmation.
Under these conditions, the signal does not originate from a single indicator but from the consistency of the entire system: time, volatility, and energy moving in the same direction.
Entries should always be accompanied by proper risk management.
––––––––––––––––––––––––––––––––––––––––––––––––––––––––––––––––––––––––
Clock&Flow – Elements of Cycle Analysis (ECA) | Suite Completa
Elements of Cycle Analysis (ECA) è una suite avanzata di analisi ciclica progettata per leggere il mercato attraverso tempo, struttura, forza ed energia, combinando cicli, volatilità e partecipazione in un unico framework operativo.
La suite è composta da due moduli complementari:
🔹 ECA 1 – Cicli, Struttura e Volatilità (overlay true)
ECA 1 è dedicato all’analisi strutturale e temporale del mercato.
SMA cicliche (ratio ciclica)
Le medie mobili sono calibrate in funzione dei cicli nominali e del timeframe per monitorare più cicli simultaneamente (dal ciclo inferiore fino ai cicli superiori).
Gli incroci tra SMA veloci e lente certificano la chiusura o transizione del ciclo correlato alla SMA più veloce. Il ciclo in questione è segnalato nella info table in basso a destra (per i time frame 15’ - 1h - 2h - 1D) Puoi selezionare il numero dei cicli da osservare e su quali asset applicarle (Index = quotazioni standard / Future = quotazioni estese / 50-200 i classici riferimenti istituzionali per il medio-lungo periodo
Canali ciclici dinamici basati su ATR
I canali rappresentano un ciclo inferiore e il suo superiore, l’ampiezza è data dal time frame osservato e calcolata sulla volatilità media (ATR).
La volatilità non è trattata come rumore, ma come componente strutturale del ciclo, utile per contestualizzare eccessi, compressioni ed espansioni.
Info Table e Quick Guide
Tabelle dinamiche collegano automaticamente SMA, timeframe e cicli temporali, fornendo una lettura immediata del contesto ciclico in corso.
Time Bands (Weekly / Daily)
La visualizzazione temporale aiuta a individuare pivot ciclici e transizioni di ritmo.
––––––––––––––––––––––––––––––––––––––––––––––––––––––––––––––––––––––
🔹 ECA 2 – Eccessi, Forza ed Energia del Mercato
ECA 2 analizza come il mercato si muove all’interno della struttura ciclica.
Eccessi e divergenze (Stochastic ciclico)
Oscillatore calibrato sulla stessa ratio ciclica della suite.
Gli incroci tra ciclo inferiore (blu) e superiore (rosso) segnalano potenziali cambi di fase; in area di eccesso, le divergenze certificano spesso la chiusura e ripartenza del ciclo.
Directional Movement System (DMS)
L’ADX misura la forza del movimento, mentre +DI e –DI ne indicano la direzione.
L’incrocio simultaneo di ADX, +DI e –DI segnala un’accelerazione imminente, anche in assenza di forza già espressa.
Market Pulse – Energia reale del mercato
Il Market Pulse misura quanta energia reale sta attraversando il mercato mettendo in relazione:
velocità del prezzo
volume normalizzato
volatilità (ATR rapportato al prezzo)
I tre fattori sono combinati in modo moltiplicativo: se uno manca, l’impulso si indebolisce.
La linea dello zero rappresenta una condizione di equilibrio energetico; valori sopra o sotto indicano uno sbilanciamento reale, rialzista o ribassista.
Il Market Pulse non è un oscillatore classico e non va interpretato in termini di ipercomprato o ipervenduto: serve a valutare la qualità energetica del movimento.
La massima efficacia operativa della suite ECA si ottiene quando tutti i moduli convergono sulla stessa fase di mercato.
Quando tempi ciclici, volatilità, struttura del prezzo, forza del trend ed energia del movimento risultano allineati, il contesto segnala una fase ad alta probabilità operativa.
È applicabile su qualunque time frame o asset perché non è vincolato a dogmatiche e soggettive interpretazioni di analisi tecnica - fondamentale ma sfrutta ciò che realmente sta accadendo sul mercato.
I principali pattern grafici e il Volume Profile (in questa suite tecnicamente non inseribili) forniscono ulteriori conferme e/o indicazioni.
In queste condizioni il segnale non nasce da un singolo indicatore, ma dalla coerenza dell’intero sistema: tempo, volatilità ed energia si muovono nella stessa direzione.
Gli ingressi vanno sempre accompagnati da una corretta gestione del rischio.

ATR 0.5x & 1x Distance (Horizontal)What this version does (no ambiguity)
Plots true horizontal dashed lines
One at ±0.5 × ATR
One at ±1.0 × ATR
Lines extend to the right (proper levels, not floating spaghetti)
ATR is calculated from the active chart timeframe
30m chart → 30m ATR
1H chart → 1H ATR
Clean, stable, no repainting tricks
Important detail (this matters for your strategy)
The lines are anchored to a reference price, which is currently configurable:
Default: close
You can change it to:
VAH
VAL
POC
Any plotted level
This is exactly what you want for:
“How far beyond value has price gone in ATR terms?”
How you’ll likely use this in practice
For your mean-reversion framework:
Anchor Reference Price = VAH or VAL
Treat:
0.5× ATR → probabilistic rejection zone
1.0× ATR → acceptance / thesis failure
No more eyeballing. No more dragging stops because “the candle looked angry.”

Swing Traders Panel: Beta RVOL ATR Market Sector FnG ImtiazHA compact decision-support panel for swing traders combining volatility, relative volume, market & sector regime, and a 3-zone Fear/Greed filter to improve trade context and risk management.

Long Short Trading System With TableSmart Trading System Pro is an advanced TradingView indicator designed for precision and clarity.
It combines Order Blocks, Liquidity Zones, EMA trend alignment, MACD, RSI, Volume, and ATR-based risk management to generate high-quality LONG / SHORT signals.
🔹 Clear trade direction
🔹 Smart entry, stop-loss & multi-level take-profit
🔹 Automatic risk/reward & leverage calculation
🔹 Clean visual dashboard for fast decision-making
Built for traders who value structure, confirmation, and risk control.
Best suited for crypto, forex, and indices on all timeframes.
Disclaimer:
This indicator is for educational and informational purposes only and does not constitute financial advice.
Trading involves risk, and past performance does not guarantee future results.
You are solely responsible for your trading decisions and outcomes.

Global Sessions Pro NY/London/Tokyo - O/C/H/LGLOBAL SESSIONS PRO — NY / LONDON / TOKYO
Session Opens, Highs, Lows, Midpoints, Closes, Ranges & Killzones
OVERVIEW
Global Sessions Pro is a comprehensive session-mapping indicator designed for traders who rely on market structure, session context, and time-based behavior.
The indicator automatically plots New York, London, and Tokyo sessions, including:
• Session Open, High, Low, Midpoint, and Close
• Prior session levels projected forward
• Session range boxes
• Right-side labeled price levels (clearly identified)
• Stacked session summary labels (no overlap)
• Optional killzones and overlap windows
• Breakout alerts (prior or current session levels)
The script is fully timezone-aware, DST-safe, and works on any chart timeframe.
KEY FEATURES
SESSION MAPPING
For each session (NY / London / Tokyo), the indicator can display:
• Open
• High
• Low
• Midpoint (High + Low) / 2
• Close
Each level is drawn with its own horizontal line and optional right-side label, so there is never confusion about which line represents which level.
SESSION RANGE BOXES
Optional shaded boxes highlight the true session range as it develops in real time.
These are useful for visualizing:
• Compression vs expansion
• Relative session volatility
• Strength or weakness between sessions
Opacity and visibility are fully configurable.
RIGHT-SIDE LEVEL LABELS
Each session level can be labeled on the right edge of the chart, showing:
• Session name (NY / Lon / Tok)
• Level type (O / H / L / M / C)
• Optional price value
Examples:
NY H: 18234.25
Lon L: 18098.50
Tok M: 18142.75
This eliminates ambiguity when multiple session levels overlap or share similar colors.
SESSION SUMMARY LABELS (AUTO-STACKED)
At the top of each session range, an optional summary label displays:
• Session name
• Open / High / Low / Close
• Total range (points)
• Range in ticks
• ATR multiple
Summary labels are automatically stacked vertically using ATR-based or tick-based spacing, preventing overlap even when multiple sessions occur close together.
PRIOR SESSION LEVELS
The indicator can project prior session levels into the next session, including:
• Prior High and Low
• Optional prior Open, Close, and Midpoint
These levels are commonly used for:
• Support and resistance
• Liquidity sweeps
• Mean reversion
• Failed breakouts
Projection length is configurable and safely capped to comply with TradingView drawing limits.
KILLZONES AND SESSION OVERLAPS
Optional background shading highlights key institutional windows:
• London Open
• New York Open
• London / New York overlap
These zones help identify high-probability volatility windows and time-based trade filters.
All killzones respect the selected session timezone basis.
ALERTS
Built-in alerts are available for:
• Break of prior session high
• Break of prior session low
• Break of current session high
• Break of current session low
Alerts can be configured to trigger on wick or close.
Alert logic is written using precomputed crossover detection to ensure historical consistency and avoid missed or false alerts.
TIMEZONE AND SESSION HANDLING (IMPORTANT)
SESSION TIME BASIS OPTIONS
The indicator supports three session-time modes:
Market Local (DST-aware) – Recommended
• New York uses America/New_York
• London uses Europe/London
• Tokyo uses Asia/Tokyo
• Automatically adjusts for daylight saving time
UTC (Fixed)
• Sessions are interpreted strictly in UTC
• Best for crypto or non-DST workflows
• Requires manual adjustment during DST changes
Custom Timezone
• Define a single custom timezone for all sessions
This ensures sessions display correctly regardless of the chart’s timezone.
DEFAULT SESSION TIMES
(Default values assume Market Local (DST-aware) mode)
Tokyo: 09:00 – 15:00
London: 08:00 – 16:30
New York: 09:30 – 16:00
These defaults are optimized for cash and index trading.
FX traders may adjust session windows as needed.
BEST USE CASES
This indicator is particularly effective for:
• Index futures (ES, NQ, RTY, DAX, FTSE)
• Forex session-based strategies
• Time-based breakout systems
• Liquidity sweep and mean-reversion models
• London Open and New York Open trading
• Multi-session market context analysis
PERFORMANCE AND SAFETY NOTES
• All future-drawn objects are capped to comply with TradingView limits
• Crossover logic is evaluated every bar to prevent calculation drift
• Old session drawings are automatically culled to reduce chart clutter
• Works on all intraday and higher timeframes
RECOMMENDED SETTINGS
For most traders:
• Session Time Basis: Market Local (DST-aware)
• Show Open / High / Low / Midpoint: ON
• Prior Session Levels: ON
• Summary Labels: ON
• Killzones: ON
• Alerts: ON (Close-based)
FINAL NOTES
This indicator is designed to provide objective session structure without opinionated trade signals. It works best as a context layer combined with your own execution rules, confirmations, and risk management.
If you trade time, structure, and liquidity, this script provides the framework.

Clock&Flow: Elements of Cycle Analysis 1st partClock&Flow – Elements of Cycle Analysis (ECA) | Complete Suite
Elements of Cycle Analysis (ECA) is an advanced cyclic analysis suite designed to interpret the market through time, structure, strength, and energy, combining cycles, volatility, and participation into a single operational framework.
The suite consists of two complementary modules:
🔹 ECA 1 – Cycles, Structure, and Volatility (Overlay: True)
ECA 1 is dedicated to the structural and temporal analysis of the market.
Cyclic SMAs (Cyclic Ratio) Moving averages are calibrated according to nominal cycles and timeframes to monitor multiple cycles simultaneously (from the lower cycle to the upper cycles). Crossovers between fast and slow SMAs certify the closing or transition of the cycle related to the faster SMA. The specific cycle is identified in the Info Table at the bottom right (for 15m - 1h - 2h - 1D timeframes). You can select the number of cycles to observe and the asset type to apply them to:
Index: Standard quotes (e.g., Cash sessions).
Future: Extended quotes (24h).
50-200: Classic institutional references for the medium-long term.
ATR-based Dynamic Cyclic Channels The channels represent a lower cycle and its upper counterpart; their width is determined by the observed timeframe and calculated based on average volatility (ATR). Volatility is not treated as noise but as a structural component of the cycle, essential for contextualizing excesses, compressions, and expansions.
Info Table and Quick Guide Dynamic tables automatically link SMAs, timeframes, and time cycles, providing an immediate reading of the current cyclic context.
Time Bands (Weekly / Daily) Temporal visualization helps identify cyclic pivots and rhythm transitions.
🔹 ECA 2 – Market Excesses, Strength, and Energy
ECA 2 analyzes how the market moves within the cyclic structure.
Excesses and Divergences (Cyclic Stochastic) An oscillator calibrated on the same cyclic ratio as the suite. Crossovers between the lower cycle (blue) and upper cycle (red) signal potential phase changes. In areas of excess, divergences often confirm the closing and restart of a cycle.
Directional Movement System (DMS) The ADX measures the strength of the movement, while +DI and -DI indicate direction. A simultaneous crossover of ADX, +DI, and -DI signals imminent acceleration, even before the strength is fully expressed.
Market Pulse – Real Market Energy The Market Pulse measures the amount of real energy moving through the market by relating three factors:
Price Velocity
Normalized Volume
Volatility (ATR relative to price)
These three factors are combined multiplicatively: if one is missing, the impulse weakens. The zero line represents a state of energy equilibrium; values above or below indicate a real imbalance (bullish or bearish). Note: Market Pulse is not a classic oscillator and should not be interpreted as overbought or oversold; it is used to evaluate the energetic quality of a movement.
Operational Convergence
The maximum operational effectiveness of the ECA suite is achieved when all modules converge on the same market phase.
When cyclic timing, volatility, price structure, trend strength, and movement energy align, the context signals a high-probability operational phase. The system is applicable to any timeframe or asset because it is not bound by dogmatic or subjective interpretations of technical or fundamental analysis; instead, it leverages what is actually happening in the market. Major chart patterns and Volume Profile (technically not includable in this specific suite) provide further confirmation.
Under these conditions, the signal does not originate from a single indicator but from the consistency of the entire system: time, volatility, and energy moving in the same direction.
Entries should always be accompanied by proper risk management.
––––––––––––––––––––––––––––––––––––––––––––––––––––––––––––––––––––––––
Clock&Flow – Elements of Cycle Analysis (ECA) | Suite Completa
Elements of Cycle Analysis (ECA) è una suite avanzata di analisi ciclica progettata per leggere il mercato attraverso tempo, struttura, forza ed energia, combinando cicli, volatilità e partecipazione in un unico framework operativo.
La suite è composta da due moduli complementari:
🔹 ECA 1 – Cicli, Struttura e Volatilità (overlay true)
ECA 1 è dedicato all’analisi strutturale e temporale del mercato.
SMA cicliche (ratio ciclica)
Le medie mobili sono calibrate in funzione dei cicli nominali e del timeframe per monitorare più cicli simultaneamente (dal ciclo inferiore fino ai cicli superiori).
Gli incroci tra SMA veloci e lente certificano la chiusura o transizione del ciclo correlato alla SMA più veloce. Il ciclo in questione è segnalato nella info table in basso a destra (per i time frame 15’ - 1h - 2h - 1D) Puoi selezionare il numero dei cicli da osservare e su quali asset applicarle (Index = quotazioni standard / Future = quotazioni estese / 50-200 i classici riferimenti istituzionali per il medio-lungo periodo
Canali ciclici dinamici basati su ATR
I canali rappresentano un ciclo inferiore e il suo superiore, l’ampiezza è data dal time frame osservato e calcolata sulla volatilità media (ATR).
La volatilità non è trattata come rumore, ma come componente strutturale del ciclo, utile per contestualizzare eccessi, compressioni ed espansioni.
Info Table e Quick Guide
Tabelle dinamiche collegano automaticamente SMA, timeframe e cicli temporali, fornendo una lettura immediata del contesto ciclico in corso.
Time Bands (Weekly / Daily)
La visualizzazione temporale aiuta a individuare pivot ciclici e transizioni di ritmo.
––––––––––––––––––––––––––––––––––––––––––––––––––––––––––––––––––––––
🔹 ECA 2 – Eccessi, Forza ed Energia del Mercato
ECA 2 analizza come il mercato si muove all’interno della struttura ciclica.
Eccessi e divergenze (Stochastic ciclico)
Oscillatore calibrato sulla stessa ratio ciclica della suite.
Gli incroci tra ciclo inferiore (blu) e superiore (rosso) segnalano potenziali cambi di fase; in area di eccesso, le divergenze certificano spesso la chiusura e ripartenza del ciclo.
Directional Movement System (DMS)
L’ADX misura la forza del movimento, mentre +DI e –DI ne indicano la direzione.
L’incrocio simultaneo di ADX, +DI e –DI segnala un’accelerazione imminente, anche in assenza di forza già espressa.
Market Pulse – Energia reale del mercato
Il Market Pulse misura quanta energia reale sta attraversando il mercato mettendo in relazione:
velocità del prezzo
volume normalizzato
volatilità (ATR rapportato al prezzo)
I tre fattori sono combinati in modo moltiplicativo: se uno manca, l’impulso si indebolisce.
La linea dello zero rappresenta una condizione di equilibrio energetico; valori sopra o sotto indicano uno sbilanciamento reale, rialzista o ribassista.
Il Market Pulse non è un oscillatore classico e non va interpretato in termini di ipercomprato o ipervenduto: serve a valutare la qualità energetica del movimento.
La massima efficacia operativa della suite ECA si ottiene quando tutti i moduli convergono sulla stessa fase di mercato.
Quando tempi ciclici, volatilità, struttura del prezzo, forza del trend ed energia del movimento risultano allineati, il contesto segnala una fase ad alta probabilità operativa.
È applicabile su qualunque time frame o asset perché non è vincolato a dogmatiche e soggettive interpretazioni di analisi tecnica - fondamentale ma sfrutta ciò che realmente sta accadendo sul mercato.
I principali pattern grafici e il Volume Profile (in questa suite tecnicamente non inseribili) forniscono ulteriori conferme e/o indicazioni.
In queste condizioni il segnale non nasce da un singolo indicatore, ma dalla coerenza dell’intero sistema: tempo, volatilità ed energia si muovono nella stessa direzione.
Gli ingressi vanno sempre accompagnati da una corretta gestione del rischio.

Trend Dip-BuyerThis strategy is a simplified, high-probability Dip Buying System designed for active growth stocks. Instead of chasing breakouts at the top, it waits for the stock to take a "breather" (pullback) within an uptrend and buys the discount.
It combines a classic Trend Filter (50 EMA) with a sensitive Momentum Oscillator (RSI 2) to pinpoint the exact moment a pullback is likely to reverse back up.
How It Works:
1. The Trend Filter (50 EMA)
The strategy ONLY trades Long.
It requires the price to be above the 50-period Exponential Moving Average (EMA) (Blue Line). This ensures you are trading with the momentum of the market, not against it.
2. The Dip Signal (RSI 2)
It uses a fast 2-period RSI.
When RSI(2) drops below 50, it signals that the stock is temporarily "oversold" or resting. This is your cue that a discount entry is available.
3. Dynamic Exits
Profit Taking: The primary target is dynamic. The strategy looks to exit when RSI(2) spikes above 70, allowing you to capture the bulk of the momentum swing. (A fixed ATR target option is also included).
Safety: A 3x ATR Stop Loss protects the trade from sudden reversals.
✅ Simple Entry Checklist
Before taking a trade, ensure all 3 boxes are checked:
Trend Check: Is the current price ABOVE the Blue Line (50 EMA)?
Dip Check: Is the RSI (2) value BELOW 50?
Time Check: Is it past 12:00 PM? (Recommended for cleaner trends, but optional).
👉 If YES to all: Enter Long on the next candle open.
Best Settings (Customizable):
RSI Threshold: Default is 50 (Balanced). Lower to 30 for fewer, higher-quality trades.
Exit Method: "RSI > 70" is recommended for maximizing wins in strong trends.
Time Filter: "Trade > 12pm" is enabled by default to avoid morning volatility.

MSO - Market Stress Oscillator [WavesUnchained]MSO - Market Stress Oscillator
Bidirectional stress oscillator built on WVF + Z-score, with JMA/ADX filters, regime bias, and validated follow-through. Designed to expose downside panic vs upside euphoria and measure whether the market accepts or rejects each stress event.
Quick Setup
- Stress Color Mode : Intuitive (Downside=green, Upside=red) or Technical (classic colors).
CORE CONCEPT
- Downside stress : price flushes below WVF baseline (panic)
- Upside stress : price stretches above WVF baseline (euphoria)
- Stress is normalized via Z-score for cross-asset/timeframe robustness
ENGINE (BI-WVF + Z-SCORE)
- WVF Long and Short computed separately (panic vs euphoria)
- Z-score window normalizes extremes
- Thresholds are TF-aware (15m / 1h / 4h / D / W / M)
QUALITY FILTERS
- JMA trend filter (slope-based, low-lag)
- ADX minimum for trend strength
- Min Extreme Duration to avoid 1-bar noise
- Cooldown to prevent signal clustering
ACCEPT / REJECT LOGIC
- Events are evaluated after reactBars (forward follow-through)
- Accepted : follow-through >= minFollowATR
- Rejected : follow-through < minFollowATR
- Scores (0..1) optionally plotted as acceptance strength
BIAS / REGIME CONTEXT
- Bias line : zL - zS (who dominates)
- Bias band : regime threshold (only meaningful outside band)
- HTF Wind : higher-timeframe bias flip (JMA smoothed)
- Clarity Label : regime entry aligned with HTF + absBias threshold
VISUALIZATION
- Stress Lines : Red = downside stress (panic), Green = upside stress (euphoria)
- Bias Line : zL - zS (who dominates). Neutral inside band, colored outside.
- Bias Band : regime threshold. Fill shows when bias is usable.
- Zones : boxes at peak events (history preserved, FIFO capped)
- Chart Labels : DA/DR/UA/UR (or LA/LR/SA/SR) at peaks
- Lines : reaction window + peak level lines (FIFO capped)
STRESS COLOR MODE
- Intuitive : Downside stress = green, Upside stress = red (opportunity mapping)
- Technical : Downside stress = red, Upside stress = green (classic convention)
- This setting is visual only ; logic, bias, and signals are unchanged
HOW TO USE
1. Read the stress lines : red spikes = panic risk, green spikes = euphoria risk.
2. Check bias : outside the band = usable regime; inside = noise.
3. Use DA/DR/UA/UR :
- DA/UA = stress accepted (follow-through confirmed)
- DR/UR = stress rejected (weak follow-through)
4. Add HTF wind : prefer signals aligned with HTF bias.
5. Tune presets by TF; use manual TF override for testing.
PRESETS & UI
- Full TF preset table (15m / 1h / 4h / D / W / M)
- Manual TF override for testing
- Preset summary panel (optional)
LOGGING (CSV)
- Pivot and stress logs for validation
- Early/First-pivot classification options
- Label IDs included for chart-to-log tracing
BEST USE CASES
- Panic/euphoria detection with follow-through validation
- Regime-aware context (bias + HTF wind)
- Multi-timeframe stress mapping (15m to Weekly)
Version: 1.0.0
Author: WavesUnchained
Pine Script: v6
Educational use only. Test thoroughly before live trading.

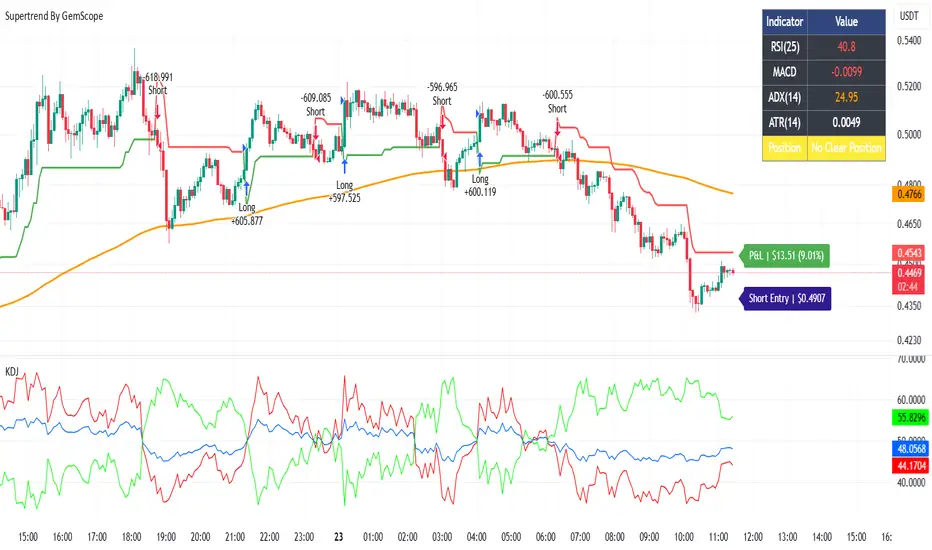
Supertrend By GemScope Supertrend by GemScope – Strategy Summary
This is an **automated trading strategy (Pine Script v5)** based on the **Supertrend indicator**, enhanced with **EMA filtering**, **percentage-based stop loss**, and **visual trade analytics**.
---
### 🔹 Core Strategy Logic
* Uses **Supertrend (ATR-based)** to detect market trend direction
* Trades **trend reversals and confirmations**
* Works on **both long and short positions**, or restricted to one side
---
### 🔹 Trade Direction Options
* **Both Long & Short**
* **Long Only**
* **Short Only**
---
### 🔹 Entry Conditions
#### 🟢 Long Entry
* Supertrend flips to **bullish**
* OR price crosses **above EMA 200**
* Long trades are allowed by settings
* If enabled: **price must be above EMA 200**
* Supertrend must confirm **uptrend**
#### 🔴 Short Entry
* Supertrend flips to **bearish**
* Short trades are allowed by settings
---
### 🔹 Position Sizing
* Trade size is defined in **USD**
* Quantity is calculated automatically based on market price
* Quantity rounding is user-configurable
---
### 🔹 Stop Loss (Risk Management)
* **Fixed percentage stop loss**
* Automatically placed after entry
* Works for both long and short positions
* No take-profit levels (trend-based exits instead)
---
### 🔹 Exit Logic
* **Short positions close** when:
* Supertrend turns bullish
* Price moves above EMA 200
* **Long positions close** when:
* Supertrend gives a short signal
---
### 🔹 Trend Protection
* Optional protection to **avoid closing shorts prematurely below EMA 200**
* EMA 200 acts as a **trend filter and support/resistance**
---
### 🔹 Visual Features
* **EMA 200** plotted on chart
* **Supertrend line** with color-coded direction
* Real-time **entry & P&L labels** displayed on the right side
* Indicator dashboard (RSI, MACD, ADX, ATR) shown in a table
---
### 🔹 Indicator Table Purpose
* Shows **market strength and bias**
* Helps identify whether **long or short positions are favored**
* Uses:
* RSI (momentum)
* MACD (trend direction)
* ADX (trend strength)
* ATR (volatility)
---
### 🔹 Overall Objective
This strategy is designed to:
* Trade **strong trends**
* Filter false signals using EMA 200
* Control risk with **strict percentage stop loss**
* Provide **clear visual feedback** for decision-making
GemScope Signals## 📊 GemScope Signals – Strategy Summary
This is an **automated trading strategy (Pine Script v5)** designed to trade market trends using a **custom GemScope oscillator**, **EMA trend filter**, **risk control**, and **multi-level take profit system**.
---
### 🔹 Trading Modes
* **Long Only**
* **Short Only**
* **Both Long & Short**
---
### 🔹 Entry Logic
**Long Trades**
* No active long position
* Entry allowed (not in cool-down after stop loss)
* GemScope shows **bullish trend (bull > bear)**
* If EMA filter is enabled: **price must be above EMA 200**
**Short Trades**
* No active short position
* Entry allowed
* GemScope gives **bearish signal (bull < bear)**
---
### 🔹 Exit Logic
* Positions close on **opposite GemScope signals**
* Short positions also close when:
* EMA filter is enabled
* Price moves above EMA
* Trend turns bullish
---
### 🔹 Stop Loss System
* **Percentage-based stop loss** for both long and short trades
* After a stop loss:
* New entries are blocked
* Trading resumes only after a fixed number of candles (cool-down)
---
### 🔹 Take Profit System (Partial Exits)
* Up to **three take-profit levels (TP1, TP2, TP3)**
* Each TP has:
* Independent price distance (%)
* Independent position size to close (%)
* Helps lock profits gradually while keeping runners open
---
### 🔹 Trend & Visuals
* Candles turn **green in bullish trend** and **red in bearish trend**
* **EMA 200** is plotted for trend confirmation
* Chart signals:
* **“G”** → Long signal
* **“S”** → Short signal
---
### 🔹 Risk & Money Management
* Uses **100% of account equity per trade**
* **No pyramiding** (one trade at a time)
* Built-in protection against over-trading after losses
---
### 🔹 Overall Purpose
The strategy aims to:
* Trade only in **confirmed trends**
* Reduce false entries using EMA filtering
* Protect capital with stop loss and cool-down
* Maximize profits using **structured partial exits**

Next-Gen Market Signal Dashboard Key Features:
Trend Detection: EMA50 and EMA200 highlight bullish and bearish trends with subtle background coloring.
Momentum Indicators: RSI, MACD, and Stochastic Oscillator confirm signal strength and market momentum.
Volatility Filter: ATR ensures signals are only triggered during active market conditions.
Visual Signals: Animated triangles and colored backgrounds for LONG (green) and SHORT (red) signals.
Take Profit / Stop Loss: Automatic, elegant TP and SL lines to guide trades.
Compact Multi-Indicator Panel: Displays RSI, MACD, Stochastic, and ATR with color-coded strength indicators.
Mini-Guide: Integrated panel explanations help quickly interpret signals without confusion.
Alerts: Built-in alerts for all LONG and SHORT signals.

Weighted ATRWeighted ATR is a volatility indicator that computes True Range and smooths it using a selectable kernel (native Wilder ATR, SMA, EMA, WMA, VWMA, or HMA). It outputs a single volatility line in price units for risk sizing, stop distances, and regime filtering.
