Scalp Boost LONG✦ Overview
Scalp Boost LONG is a visual tool designed to highlight potential short-term upward impulses.
A signal is generated only when multiple market conditions align at the candle close, combining momentum dynamics, local probability shifts, and abnormal volume behavior.
The indicator does not repaint.
✦ Concept
The tool focuses on selective situations where the market shows signs of micro-breakout potential.
If all internal conditions are confirmed — a LONG event is displayed.
If not — the chart remains clean.
This builds a low-noise signal model, prioritizing quality over frequency.
✦ Signal Logic
The LONG signal requires confirmation of all core conditions:
• Local impulse dynamics
Identifies short-term acceleration suggesting a breakout from a compressed price structure.
• Probability beyond a statistical zone
Uses relative breakout probability instead of fixed levels, checking whether price exceeds expected local ranges.
• Abnormal volume activity
Highlights candles with monetary flow above a custom threshold, signaling increased market interest.
• Anti-overheat filter
Conditions avoiding exhausted or low-momentum phases where continuation is less likely.
Only when all filters are aligned a LONG marker appears.
✦ Visual Structure
The chart display is intentionally minimal:
• ROC Curve
Subdued line, showing short-term momentum without distraction.
• LONG Marker
Green triangle below the candle on confirmed events.
• Candle Highlight
Soft background highlight on the signal bar.
• Volume Marker
Small red dot at the bottom of candles with abnormal monetary flow.
All visual elements appear only on candle close.
✦ Alerts
A clean event structure is available for notifications:
LONG Signal
This allows receiving alerts during chart analysis or in automated workflows while keeping full control over decision-making.
✦ Notes & Guidelines
This tool:
is not a trading system,
does not provide targets or stops,
may trigger against the dominant trend,
should be combined with the user’s own methodology.
Signals are rare by design.
Do not interpret each event as a trend continuation — it highlights conditions, not outcomes.
✦ Suggested Use
-(Non-mandatory ideas for advanced users)
-identifying potential micro-breakouts,
-timing entries around volume spikes,
-adding context to scalping models,
-filtering impulsive moves from noise.
-suitable for a 5-minute timeframe
The indicator can be helpful as a confirmation layer, not a standalone decision tool.
Whale

Whale KitThe Whale Kit is an all-in-one trading toolkit created by ChartPrime, providing a powerful set of indicators and analytical tools. It’s designed with simplicity in mind—clean inputs, intuitive visuals, and straightforward logic—so traders of all experience levels can make informed, confident decisions. This guide gives an overview of each component within the Whale Kit for J Bravo and explains some of the deeper mechanics behind them.
Features of the Whale Kit
Whale Candles
Whale Candles offer a unique visualization of price action by color-coding candles based on their angle relative to previous movement. This allows traders to instantly recognize trend strength and momentum shifts. Users can enable or disable the Whale Candle theme with a single toggle.
Whale Sequential
The Whale Sequential is a refined take on the classic sequential, designed to better detect trend exhaustion. Instead of simply counting consecutive candles, the Whale Sequential analyzes trend angle, giving a more accurate picture of momentum.
By factoring in the slope of the trend—not just higher or lower closes—it can highlight when a trend is weakening even before the traditional 9-count would appear.
When a potential exhaustion is detected, the system prints a “9” along with an optional label for easier visibility. This upgraded angle-based approach often provides earlier and more reliable insight into trend fatigue compared to traditional methods.
Whale Fibonacci Bands
The Whale Fibonacci Bands combine Fibonacci mathematics with a proprietary weighted-average formula to create a dynamic, adaptive price channel. These bands help traders identify key support, resistance, and directional bias in real time.
The system applies the metallic mean (golden/silver mean variations) to the input series, shifting more weight toward recent price action. This results in a smoother, more responsive channel that adapts quickly to market changes while still respecting classical Fibonacci behavior.
The outcome is a highly reliable, intuitive set of bands that reflect both volatility and trend—giving traders a clear visual roadmap of where price is likely to react.
Moving Averages
The suite includes the Whale 9 Moving Average along with several structural moving averages such as the 200-day and 200-week MA. These are custom-tuned, lower-lag moving averages designed to react faster than standard MAs without excessive noise. Users can toggle each MA individually to tailor their chart to their trading style.
The Whale Screener
The Whale Screener allows users to quickly scan for conditions such as active 9-counts, price relative to the Whale 9 MA, above or below the 200-day MA, and readings derived from the Whale Bands. It offers a fast, simplified way to identify setups across multiple market environments.

QED All-In-One(COM)-The yellow diamond and blue star are strong "Long" signals when the LF indicator's pink line crosses below 10.
-The pink star and yellow star are strong "short" signals when the LF indicator(NOT STUPID RSI) is above 90.
-The oversold (exclamation mark) signal indicates that a strong upward or downward trend could be imminent.
SUBSCRIPTION IS NEEDEED.
----------------------------------------------------------------------------------------------------------------
when pink line hits the bottom (close to 0). go for long. same as the short (opposite way)
DO NOT ENTER WHEN PINK LINE IS IN THE MIDDLE (close to YELLOW LINE). That's not the bottom or top you are looking for.
imgur.com
**************************
-노란색 다이아몬드와 파란색 별은 "Long" 시그널로 LF지표 핑크색 라인이 하단 10을 통과할때 강력합니다.
-핑크색과 노란색 별은 "short"시그널로 LF지표가 90이상일때 강력합니다.
-과매도(느낌표) 시그널은 곧 상승/하락의 추세가 될 수 있음을 의미합니다.

WAD : Whale Activity Detector🐋 WAD: Whale Activity Detector
WAD (Whale Activity Detector) automatically detects periods of abnormally high trading volume compared to the average, identifying potential whale (institutional) buy or sell activity and visualizing it directly on the chart.
🔍 How It Works
1. Buy/Sell Volume Separation
Each candle’s trading volume is categorized based on its direction:
Bullish candle → Buy volume
Bearish candle → Sell volume
This separation helps distinguish the actual strength of buying vs. selling pressure, rather than looking at total volume alone.
2. Average Volume Calculation
Over a user-defined lookback period (default: 34 bars), the indicator calculates the moving average of both buy and sell volumes, establishing a baseline for what constitutes “normal” activity.
3. Whale Activity Detection
When the current volume exceeds n times the average volume (default: 4×), the indicator flags it as a Whale Zone — a potential sign of large player involvement.
Volume surge on a bullish candle → Whale Buy
Volume surge on a bearish candle → Whale Sell
4. Visual Display
🟢 Green bars: Whale buy activity
🔴 Red bars: Whale sell activity
BUY/SELL labels: Appear above the chart when an anomaly is detected
Average line toggle: Users can turn the average volume lines on or off for clarity
5. Alerts
Whenever whale buy/sell signals are detected, real-time alerts are triggered.
Example: 🐋 Whale Buy – NVDA! 🟢
⚙️ Indicator Meaning
Rather than showing raw volume, WAD tracks “abnormal volume relative to the average.”
It filters out noise and highlights the moments where large entities begin to move.
Essentially, it visualizes intentional and impactful trades hidden within standard volume activity.
🚀 Example Use Cases
Whale accumulation tracking – Repeated strong buy signals may indicate sustained institutional accumulation.
Short-term breakout confirmation – Price often rallies shortly after whale buy signals appear.
Support/resistance analysis – Whale sell zones frequently align with short-term resistance areas.
In short:
WAD identifies when trading volume exceeds its historical norm to highlight where big money enters or exits the market.
===============================================================================
🐋 WAD : 세력 매매거래 추적기
WAD(Whale Activity Detector) 는 특정 종목의 거래량 패턴 속에서
‘평균 대비 비정상적으로 큰 거래량이 발생한 구간’을 자동으로 감지해
세력(Whale)의 매수·매도 활동을 시각화하는 지표입니다.
🔍 작동 원리
매수·매도 거래량 분리
각 캔들이 양봉인지, 음봉인지에 따라 거래량을 분리합니다.
양봉 시 발생한 거래량 → 매수 거래량(buy volume)
음봉 시 발생한 거래량 → 매도 거래량(sell volume)
이렇게 분리함으로써 단순 거래량이 아닌,
실제 매수세/매도세의 힘을 구분할 수 있습니다.
평균 거래량 계산
사용자가 지정한 기간(기본 34봉)을 기준으로
매수·매도 거래량의 이동평균선을 각각 계산합니다.
이는 ‘정상적인 거래량 수준’을 판단하는 기준선으로 활용됩니다.
이상치 탐지 (Whale Activity Detection)
현재 거래량이 평균 거래량의 n배(기본 4배)를 초과할 경우,
그 구간을 세력 개입 구간(Whale Zone) 으로 판단합니다.
양봉에서 급증 → 세력 매수 (Whale Buy)
음봉에서 급증 → 세력 매도 (Whale Sell)
시각적 표시
초록색 기둥 : 세력 매수 거래량
빨간색 기둥 : 세력 매도 거래량
라벨 표시 (BUY / SELL) : 이상치 발생 시 차트 상단에 표시
평균선 표시 옵션 : 사용자가 원할 때 평균선을 켜거나 끌 수 있음
알림(Alerts)
세력의 매수·매도 신호가 감지되면,
알림 메시지를 통해 실시간으로 통보받을 수 있습니다.
(예: 🐋 Whale Buy - NVDA! 🟢)
⚙️ 지표의 의미
단순 거래량이 아니라, ‘평균 대비 비정상적 거래량’ 을 추적합니다.
즉, “세력이 본격적으로 움직이기 시작한 구간” 만 걸러내는 지표입니다.
노이즈가 많은 거래량 차트 속에서 의도 있는 거래의 흔적을 포착할 수 있습니다.
🚀 활용 예시
세력 매집 구간 포착 : 큰 매수 시그널이 반복적으로 발생하는 구간은 세력의 누적 매집 가능성을 의미함
단기 급등 신호 확인 : 매수 이상치가 발생한 직후 가격이 급등하는 경우가 많음
지지/저항 분석과 병행 활용 : 세력 매도 구간은 단기 저항으로 작용하는 경향이 있음
copyright @invest_hedgeway

AlphaFlow - Trend DetectorOVERVIEW
AlphaFlow identifies and tracks large volume moves by combining volume analysis, price impact measurement, and conviction scoring to separate significant institutional moves from normal trading activity. Rather than just flagging high volume, this indicator evaluates whether large trades actually moved the market and assigns conviction levels based on multiple confirmation factors.
WHAT MAKES THIS ORIGINAL
This is not simply a volume indicator or volume-weighted price tracker. The originality lies in the multi-factor conviction scoring system that evaluates whether large volume moves represent genuine institutional conviction or just noise.
Key Differentiators:
- Combines volume ratio AND price impact (volume alone doesn't mean conviction)
- Conviction scoring system that weighs trend alignment, follow-through, and volume persistence
- Cumulative flow tracking that shows persistent directional pressure over time
- Market regime detection (bullish/bearish/sideways) based on flow dynamics
- Tiered signal system (EXTREME/HIGH/MEDIUM conviction) rather than binary signals
This approach solves the problem of volume spikes that don't lead to meaningful price action, or price moves on low volume that don't persist.
HOW IT WORKS
1. Whale Detection Engine:
Volume Qualification: Compares current volume to a rolling average (default 50 bars). Whale activity requires volume to be at least 1.5x the average (adjustable).
Price Impact Requirement: Volume alone isn't enough. The bar must also show significant price movement (default 0.1% minimum). This filters out high-volume consolidation where no one is actually committed to direction.
Direction Identification: Bullish whale = close > open on high volume. Bearish whale = close < open on high volume.
2. Conviction Scoring System:
The indicator doesn't just flag whale activity - it evaluates conviction through multiple factors:
Base Conviction: Calculated from (volume_ratio × price_impact) / 10
This gives higher scores to moves with both exceptional volume AND large price swings.
Trend Alignment Bonus (1.5x multiplier): Whale moves aligned with the 20-period EMA trend receive higher conviction scores. Institutional money tends to accumulate with the trend, not against it.
Follow-Through Bonus (1.3x multiplier): After whale activity, does price continue in that direction over the next bars (default 3)? Genuine conviction shows persistence.
Volume Persistence (1.2x multiplier): Is elevated volume sustained over multiple bars, or is it a one-time spike? The 3-bar average volume ratio above 1.5x indicates sustained interest.
Conviction Levels:
- EXTREME: Score > 15 (large whale emoji labels, highest confidence)
- HIGH: Score > 8 (triangle signals, strong confidence)
- MEDIUM: Score > 3 (small triangles, moderate confidence)
- LOW: Score < 3 (not plotted to reduce noise)
3. Cumulative Flow Analysis:
Rather than treating each whale move in isolation, the indicator tracks cumulative flow using an EMA of whale activity. This reveals persistent directional pressure.
Flow Calculation: Each whale bar contributes (whale_strength × direction) to the flow. Strength is volume_ratio × price_impact_percent.
Flow Momentum: Rate of change in the cumulative flow (5-bar change)
Flow Acceleration: Second derivative (3-bar change of momentum)
These metrics reveal whether whale activity is accelerating, decelerating, or reversing.
4. Market Regime Detection:
Bullish Regime: Cumulative flow > 2 AND momentum positive
Bearish Regime: Cumulative flow < -2 AND momentum negative
Sideways Regime: Neither condition met
The background color reflects the current regime, helping traders understand the broader context.
5. Flow Strength Meter:
The main plot normalizes cumulative flow to a -100 to +100 scale based on the 100-bar range. This provides a consistent visual reference regardless of the asset or timeframe.
Extreme levels at ±50 indicate particularly strong directional flow where reversals or consolidation become more likely.
HOW TO USE IT
Settings Configuration:
Whale Detection Section:
- Volume Average Period (default 50): Shorter periods make detection more sensitive to recent volume changes. Longer periods require more exceptional volume to trigger.
- Whale Volume Multiplier (default 1.5): How much above average volume must be to qualify. Lower = more signals. Higher = only extreme moves.
- Minimum Price Impact (default 0.1%): Filters out high-volume bars that didn't actually move price. Adjust based on asset volatility.
Trend Analysis:
- Trend Strength Period (default 20): EMA period for trend alignment bonus
- Confirmation Bars (default 3): How many bars to check for follow-through
Visual Settings:
- Flow Strength Meter: Main plot showing normalized cumulative flow
- Conviction Labels: Detailed labels showing volume ratio and price impact on extreme/high conviction whales
- Trend Background: Color-coded regime indication
Signal Interpretation:
EXTREME Conviction (Whale Emoji Labels):
These are the highest confidence signals. Large volume with significant price impact, aligned with trend, showing follow-through. These often mark the beginning or continuation of strong moves.
HIGH Conviction (Large Triangles):
Strong signals meeting most criteria. Good for main entries or adding to positions.
MEDIUM Conviction (Small Triangles):
Whale activity present but with fewer confirmation factors. Use for partial positions or require additional confirmation.
Flow Strength Meter:
- Above zero and rising: Bullish flow building
- Below zero and falling: Bearish flow building
- Approaching ±50: Extreme readings, watch for exhaustion
- Crossing zero: Flow regime change
Dashboard Information:
The top-right table shows:
- Current regime (bullish/bearish/sideways)
- Flow strength value
- Last whale direction
- Conviction level of last whale
- Current volume ratio
- Flow momentum direction
- Indicator status
Trading Strategies:
Trend Following: Take EXTREME and HIGH conviction signals aligned with the flow meter direction. Enter when flow is positive and rising for bullish whales, negative and falling for bearish whales.
Regime-Based: Only trade in bullish/bearish regimes (colored backgrounds). Avoid trading in sideways regimes where whale moves tend to reverse quickly.
Flow Reversals: When flow meter crosses zero with EXTREME conviction whale in the new direction, this often marks regime changes.
Exhaustion Plays: When flow reaches ±50 extreme levels, watch for EXTREME conviction whales in the opposite direction as potential reversal signals.
TECHNICAL DETAILS
Volume Ratio = Current Volume / SMA(Volume, Period)
Price Impact % = ABS(Close - Open) / Open × 100
Whale Detected = (Volume Ratio >= Multiplier) AND (Price Impact >= Minimum)
Whale Direction = Close > Open ? 1 : -1
Base Conviction = (Volume Ratio × Price Impact %) / 10
Trend Alignment = Whale Direction == Trend Direction ? 1.5 : 1.0
Follow-Through = Price continues whale direction over N bars ? 1.3 : 1.0
Volume Persistence = SMA(Volume Ratio, 3) > 1.5 ? 1.2 : 1.0
Final Conviction = Base × Trend Alignment × Follow-Through × Volume Persistence
Whale Flow = Whale Detected ? (Volume Ratio × Price Impact × Direction) : 0
Cumulative Flow = EMA(Whale Flow, 20)
Flow Momentum = Change(Cumulative Flow, 5)
Flow Acceleration = Change(Momentum, 3)
Normalized Flow Strength = (Cumulative Flow / Highest(ABS(Cumulative Flow), 100)) × 100
WHAT THIS SOLVES
Common Volume Indicator Problems:
- Volume spikes that don't move price (consolidation noise)
- Price moves on low volume that quickly reverse
- No differentiation between strong and weak volume signals
- Treating all high-volume bars equally regardless of context
- No measure of whether volume represents conviction or panic
Whale Flow Solutions:
- Requires both volume AND price impact for signals
- Conviction scoring separates strong moves from weak ones
- Cumulative flow shows persistent pressure vs isolated spikes
- Trend alignment and follow-through filter low-quality signals
- Tiered system lets traders choose their confidence threshold
LIMITATIONS
- Cannot identify individual whales or attribute volume to specific entities
- High volume can come from many sources (whales, retail panic, algo activity)
- Works best on liquid assets with consistent volume patterns
- Less reliable on low-volume assets or during market closures
- Conviction scoring thresholds may need adjustment per asset/timeframe
- Does not predict future whale activity, only identifies it after bars close
- Flow can remain at extremes longer than expected during strong trends
- False signals can occur during news events or earnings
- Not a standalone trading system - requires risk management and other analysis
Best used in combination with price action, support/resistance, and broader market context.
EDUCATIONAL VALUE
For traders learning about:
- Volume analysis beyond simple volume indicators
- Multi-factor signal confirmation systems
- Market regime and flow concepts
- Conviction-based scoring methodologies
- Cumulative indicator design
- Normalized plotting for cross-asset comparison
- Pine Script table and dashboard creation
Not financial advice.

Smart Money Footprint & Cost Basis Engine [AlgoPoint]Smart Money Footprint & Cost Basis Engine
This indicator is a comprehensive market analysis tool designed to identify the "footprints" of Smart Money (institutions, whales) and pinpoint high-probability reaction zones. Instead of relying on lagging averages, this engine analyzes the very structure of the market to find where large players have shown their hand.
How It Works: The Core Logic
The indicator operates on a multi-stage confirmation process to identify and validate Smart Money zones:
Smart Money Detection (The Trigger): The engine first scans the chart for signs of intense, urgent buying or selling. It does this by identifying Fair Value Gaps (FVGs) created by large, high-volume Displacement Candles. This is our initial Point of Interest (POI).
Cost Basis Calculation (The Average Price): Once a potential Smart Money move is detected, the indicator calculates the Volume-Weighted Average Price (VWAP) for that specific move. This gives us a highly accurate estimate of the average price at which the large players entered their positions.
Historical Confirmation (The "Memory"): This is the indicator's most unique feature. It checks its historical database to see if a similar Smart Money move (in the same direction) has occurred in the same price area in the past. If a match is found, the zone's significance is confirmed.
Verified Cost Basis Zone (The Final Output): A zone that passes all the above checks is drawn on the chart as a high-probability Verified Cost Basis Zone. These are the "memory zones" where the market is likely to react upon a re-visit.
How to Use This Indicator
Cost Basis Zones (The Boxes):
Green Boxes: Bullish zones where Smart Money likely accumulated positions. When the price returns here, a BUY reaction is expected.
Red Boxes: Bearish zones where Smart Money likely distributed positions. When the price returns here, a SELL reaction is expected.
Zone Strength (★★★): Each zone is created with a star rating. More stars indicate a higher-confidence zone (based on factors like volume intensity and historical confirmation).
BUY/SELL Signals: A signal is only generated when the price enters a zone AND the confirmation filters (if enabled in the settings) are passed.
Zone Statuses:
Green/Red: Active and waiting to be tested.
Gray: The zone has been tested, and a signal was produced.
Dark Gray (Invalidated): The zone was broken decisively and is no longer considered valid support/resistance.
Key Settings
Signal Accuracy Filters: You can enable/disable three powerful filters to balance signal quantity and quality:
Momentum Confirmation (Stoch): Waits for momentum to align with the zone's direction.
Candlestick Confirmation (Engulfing): Waits for a strong reversal candle inside the zone.
Lower Timeframe MSS Confirmation: The most advanced filter; waits for a trend shift on a lower timeframe before giving a signal.
Historical Confirmation:
Require Historical Confirmation: Toggle the "Memory" feature on/off. Turn it off to see all potential SM zones.
Tolerance Calculation Method: Choose between a dynamic ATR Multiplier (recommended for all-around use) or a fixed Percentage to define the zone size.

52SIGNAL RECIPE Whale Smart Money Detector52SIGNAL RECIPE Whale Smart Money Detector
◆ Overview
52SIGNAL RECIPE Whale Smart Money Detector is an innovative indicator that detects the movements of whales (large investors) in the cryptocurrency market in real-time. This powerful tool tracks large-scale trading activities that significantly impact the market, providing valuable signals before important market direction changes occur. It can be applied to any cryptocurrency chart, allowing traders to follow the movements of big money anytime, anywhere.
The unique strength of this indicator lies in its comprehensive analysis of volume surges, price volatility, and trend strength to accurately capture whale market entries and exits. By providing clear visual representation of large fund flow data that is difficult for ordinary traders to detect, you gain the opportunity to move alongside the big players in the market.
─────────────────────────────────────
◆ Key Features
• Whale Activity Detection System: Analyzes volume surges and price impacts to capture large investor movements in real-time
• Precise Volume Analysis: Distinguishes between regular volume and whale volume to track only meaningful market movements
• Market Impact Measurement: Quantifies and analyzes the real impact of whale buying/selling on the market
• Continuity Tracking: Follows market direction continuity after whale activity to confirm signal validity
• Intuitive Visualization: Easily identifies whale activity points through color bar charts and clear labels
• Trend Strength Display: Calculates and displays current market buy/sell strength in real-time in a table
• Whale Signal Filtering: Applies multiple filtering systems to detect only genuine whale activity
• Customizable Sensitivity Settings: Offers flexible parameters to adjust whale detection sensitivity according to market conditions
─────────────────────────────────────
◆ Understanding Signal Types
■ Whale Buy Signal
• Definition: Occurs when volume increases significantly above average, immediate volume impact is large, and price rises beyond normal volatility
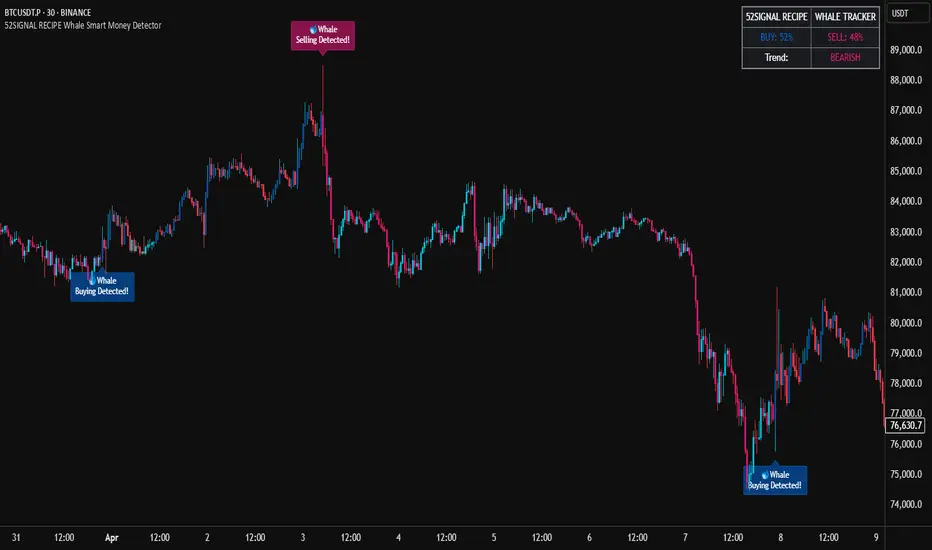
• Visual Representation: Translucent blue bar coloring with "🐋Whale Buying Detected!" label on the candle where the buy signal occurs
• Market Interpretation: Indicates that large funds are actively buying the coin, which is likely to lead to price increases
■ Whale Sell Signal
• Definition: Occurs when volume increases significantly above average, immediate volume impact is large, and price falls beyond normal volatility
• Visual Representation: Translucent pink bar coloring with "🐋Whale Selling Detected!" label on the candle where the sell signal occurs
• Market Interpretation: Indicates that large funds are actively selling the coin, which is likely to lead to price decreases
─────────────────────────────────────
◆ Understanding Trend Analysis
■ Trend Analysis Method
• Definition: Measures current trend and strength by analyzing the ratio of up/down candles over a set period
• Visual Representation: Displayed in the table as "BUY" and "SELL" percentages, with the current trend clearly marked as "BULLISH", "BEARISH", or "NEUTRAL"
• Calculation Method:
▶ Buy ratio = (Number of up candles) / (Total analysis period)
▶ Sell ratio = (Number of down candles) / (Total analysis period)
▶ Current trend determined by the dominant ratio as "BULLISH" or "BEARISH"
■ Trend Utilization Methods
• Whale Signal Confirmation: Signal reliability increases when whale signals align with the current trend
• Reversal Point Identification: Opposing whale signals during strong trends may indicate important reversal points
• Market Strength Assessment: Understand the balance of power in the current market through buy/sell ratios
• Signal Context Understanding: Consider trend information alongside whale signals for interpretation in a broader market context
─────────────────────────────────────
◆ Indicator Settings Guide
■ Key Setting Parameters
• Volume Impact Factor:
▶ Purpose: Sets the minimum multiplier for immediate volume impact to be considered whale activity
▶ Lower values: Generate more signals, detect smaller whales
▶ Higher values: Fewer signals, detect only very large whales
▶ Recommended range: 2.0-4.0 (adjust according to market conditions)
• Sensitivity Factor:
▶ Purpose: Adjusts sensitivity of price movement relative to normal volatility
▶ Lower values: Increased sensitivity, more signals generated
▶ Higher values: Decreased sensitivity, only stronger price impacts detected
▶ Recommended range: 0.2-0.5 (set higher in highly volatile markets)
• Trend Analysis Period:
▶ Purpose: Sets the number of candles to calculate buy/sell ratios
▶ Lower values: More responsive to recent trends
▶ Higher values: More stable analysis considering longer-term trends
▶ Recommended range: 30-70 (adjust according to trading style)
─────────────────────────────────────
◆ Synergy with Other Indicators
• Key Support/Resistance Levels:
▶ Whale signals occurring near important technical levels have higher reliability
▶ Coincidence of weekly/monthly pivot points and whale signals confirms important price points
• Moving Averages:
▶ Pay attention to whale signals near key moving averages (50MA, 200MA)
▶ Simultaneous occurrence of moving average breakouts and whale signals indicates important technical events
• Volume Profile:
▶ Whale activity near high volume nodes confirms important price levels
▶ Whale signals at low volume nodes may indicate possibility of rapid price movements
• Volatility Indicators:
▶ Whale signals after periods of low volatility may mark the beginning of new market movements
▶ Whale signals after Bollinger Band contraction may be precursors to large movements
• Market Structure:
▶ Whale signals near key market structures (higher highs/lows, lower highs/lows) suggest structural changes
▶ Coincidence of market structure changes and whale activity may signal important trend changes
─────────────────────────────────────
◆ Conclusion
52SIGNAL RECIPE Whale Smart Money Detector tracks the trading activities of large investors in the cryptocurrency market in real-time, providing traders with valuable insights. Because it can be applied to any cryptocurrency chart, you can utilize it immediately on your preferred trading platform.
The core value of this indicator is providing intuitive visualization of large fund flows that are easily missed by ordinary traders. By comprehensively analyzing volume surges, immediate price impacts, and trend continuity to accurately capture whale activity, you gain the opportunity to move alongside the big players in the market.
Clear buy/sell signals and real-time trend strength measurements help traders quickly grasp market conditions and understand market direction. By integrating this powerful tool into your trading system, gain insights into where the market's smart money is flowing for better market understanding.
─────────────────────────────────────
※ Disclaimer: Like all trading tools, the 52SIGNAL RECIPE Whale Smart Money Detector should be used as a supplementary indicator and not relied upon exclusively for trading decisions. Past patterns of whale behavior may not guarantee future market movements. Always employ appropriate risk management strategies in your trading.
52SIGNAL RECIPE Whale Smart Money Detector
◆ 개요
52SIGNAL RECIPE Whale Smart Money Detector는 암호화폐 시장에서 고래(대형 투자자)의 움직임을 실시간으로 감지하는 혁신적인 지표입니다. 이 강력한 도구는 시장에 큰 영향을 미치는 대규모 트레이딩 활동을 추적하여 중요한 시장 방향 전환이 일어나기 전에 귀중한 신호를 제공합니다. 모든 암호화폐 차트에 적용 가능하여 트레이더들이 언제 어디서든 대형 자금의 움직임을 따라갈 수 있게 해줍니다.
이 지표의 독보적인 강점은 거래량 급증, 가격 변동성, 그리고 추세 강도를 종합적으로 분석하여 고래의 시장 진입과 퇴출을 정확히 포착한다는 점입니다. 일반 트레이더들이 놓치기 쉬운 대형 자금의 흐름 데이터를 시각적으로 명확하게 제공함으로써, 여러분은 시장의 큰 손들과 함께 움직일 수 있는 기회를 얻게 됩니다.
─────────────────────────────────────
◆ 주요 특징
• 고래 활동 감지 시스템: 거래량 급증과 가격 임팩트를 분석하여 대형 투자자의 움직임을 실시간으로 포착
• 정밀한 거래량 분석: 일반 거래량과 고래 거래량을 구분하여 의미 있는 시장 움직임만 추적
• 시장 영향력 측정: 고래의 매수/매도가 시장에 미치는 실질적 영향력을 수치화하여 분석
• 연속성 추적: 고래 활동 이후 시장 방향의 지속성을 추적하여 신호의 유효성 확인
• 직관적 시각화: 컬러 바 차트와 명확한 라벨을 통해 고래 활동 지점을 쉽게 식별
• 추세 강도 표시: 현재 시장의 매수/매도 강도를 실시간으로 계산하여 테이블에 표시
• 고래 신호 필터링: 진정한 고래 활동만 감지하도록 다중 필터링 시스템 적용
• 맞춤형 감도 설정: 시장 상황에 따라 고래 감지 감도를 조절할 수 있는 유연한 파라미터 제공
─────────────────────────────────────
◆ 신호 유형 이해하기
■ 고래 매수 신호
• 정의: 거래량이 평균보다 크게 증가하고, 즉각적인 거래량 충격이 크며, 가격이 정상 변동성을 초과하여 상승할 때 발생
• 시각적 표현: 매수 신호가 발생한 캔들에 반투명 파란색 바 컬러링과 함께 "🐋Whale Buying Detected!" 라벨 표시
• 시장 해석: 대형 자금이 적극적으로 코인을 매수하고 있으며, 이는 곧 가격 상승으로 이어질 가능성이 높음을 의미
■ 고래 매도 신호
• 정의: 거래량이 평균보다 크게 증가하고, 즉각적인 거래량 충격이 크며, 가격이 정상 변동성을 초과하여 하락할 때 발생
• 시각적 표현: 매도 신호가 발생한 캔들에 반투명 분홍색 바 컬러링과 함께 "🐋Whale Selling Detected!" 라벨 표시
• 시장 해석: 대형 자금이 적극적으로 코인을 매도하고 있으며, 이는 곧 가격 하락으로 이어질 가능성이 높음을 의미
─────────────────────────────────────
◆ 추세 분석 이해하기
■ 추세 분석 방식
• 정의: 설정된 기간 동안의 상승/하락 캔들 비율을 분석하여 시장의 현재 추세와 강도를 측정
• 시각적 표현: 테이블에 "BUY"와 "SELL" 비율이 백분율로 표시되며, 현재 추세가 "BULLISH", "BEARISH" 또는 "NEUTRAL"로 명확하게 표시됨
• 계산 방식:
▶ 매수 비율 = (상승 캔들 수) / (전체 분석 기간)
▶ 매도 비율 = (하락 캔들 수) / (전체 분석 기간)
▶ 우세한 비율에 따라 "BULLISH" 또는 "BEARISH" 추세 결정
■ 추세 활용 방법
• 고래 신호 확인: 고래 신호가 현재 추세와 일치할 때 신호의 신뢰도가 높아짐
• 반전 포인트 식별: 강한 추세 속에서 발생하는 반대 방향의 고래 신호는 중요한 반전 포인트일 수 있음
• 시장 강도 평가: 매수/매도 비율을 통해 현재 시장의 세력 균형 파악
• 신호 발생 맥락 이해: 추세 정보와 고래 신호를 함께 고려하여 더 넓은 시장 컨텍스트에서 해석
─────────────────────────────────────
◆ 지표 설정 가이드
■ 주요 설정 매개변수
• Volume Impact Factor (거래량 임팩트 요소):
▶ 목적: 고래 활동으로 간주할 즉각적인 거래량 충격의 최소 배수 설정
▶ 낮은 값: 더 많은 신호 생성, 작은 고래도 감지
▶ 높은 값: 더 적은 신호, 매우 큰 고래만 감지
▶ 권장 범위: 2.0-4.0 (시장 상황에 따라 조정)
• Sensitivity Factor (민감도 요소):
▶ 목적: 정상 변동성 대비 가격 변동의 민감도 조절
▶ 낮은 값: 민감도 증가, 더 많은 신호 생성
▶ 높은 값: 민감도 감소, 더 강한 가격 충격만 감지
▶ 권장 범위: 0.2-0.5 (변동성이 높은 시장에서는 높게 설정)
• Trend Analysis Period (추세 분석 기간):
▶ 목적: 매수/매도 비율을 계산할 캔들 수 설정
▶ 낮은 값: 최근 추세에 더 민감하게 반응
▶ 높은 값: 더 긴 기간의 추세를 고려하여 안정적인 분석
▶ 권장 범위: 30-70 (트레이딩 스타일에 따라 조정)
─────────────────────────────────────
◆ 다른 지표와의 시너지
• 주요 지지/저항 레벨:
▶ 중요한 기술적 레벨 근처에서 발생하는 고래 신호는 더 높은 신뢰도를 가짐
▶ 주간/월간 피봇 포인트와 고래 신호의 일치는 중요한 가격 지점을 확인해줌
• 이동평균선:
▶ 주요 이동평균선(50MA, 200MA) 근처에서 발생하는 고래 신호에 주목
▶ 이동평균선 돌파와 고래 신호가 동시 발생 시 중요한 기술적 이벤트 확인
• 볼륨 프로필:
▶ 높은 볼륨 노드 근처에서의 고래 활동은 중요한 가격 레벨 확인
▶ 낮은 볼륨 노드에서 발생하는 고래 신호는 급격한 가격 이동 가능성 암시
• 변동성 지표:
▶ 낮은 변동성 구간 이후 발생하는 고래 신호는 새로운 시장 움직임의 시작일 수 있음
▶ 볼린저 밴드 수축 후 발생하는 고래 신호는 큰 움직임의 전조일 수 있음
• 시장 구조:
▶ 주요 시장 구조(높은 고점/저점, 낮은 고점/저점) 근처에서 발생하는 고래 신호는 구조 변화 암시
▶ 시장 구조 변화와 고래 활동의 일치는 중요한 트렌드 변화 신호일 수 있음
─────────────────────────────────────
◆ 결론
52SIGNAL RECIPE Whale Smart Money Detector는 암호화폐 시장에서 대형 투자자들의 거래 활동을 실시간으로 추적하여 트레이더들에게 귀중한 통찰력을 제공합니다. 모든 암호화폐 차트에 적용 가능하기 때문에, 여러분이 선호하는 트레이딩 플랫폼에서 바로 활용할 수 있습니다.
이 지표의 핵심 가치는 일반 트레이더들이 놓치기 쉬운 대형 자금의 흐름을 직관적으로 시각화하여 제공한다는 점입니다. 거래량 급증, 즉각적인 가격 충격, 그리고 추세 지속성을 종합적으로 분석하여 고래의 활동을 정확히 포착함으로써, 여러분은 시장을 움직이는 큰 손들과 함께할 수 있는 기회를 얻게 됩니다.
명확한 매수/매도 신호와 실시간 추세 강도 측정은 트레이더들이 시장 상황을 한눈에 파악하고 시장의 방향성을 이해하는 데 도움을 줍니다. 이 강력한 도구를 여러분의 트레이딩 시스템에 통합함으로써, 시장의 스마트 머니가 어디로 흘러가는지 파악하고 더 나은 통찰력을 얻으세요.
─────────────────────────────────────
※ 면책 조항: 모든 트레이딩 도구와 마찬가지로, 52SIGNAL RECIPE Whale Smart Money Detector는 보조 지표로 사용해야 하며 트레이딩 결정을 전적으로 의존해서는 안 됩니다. 과거의 고래 행동 패턴이 미래 시장 움직임을 보장하지는 않습니다. 항상 적절한 리스크 관리 전략을 트레이딩에 활용하세요.
WHALE SIGNAL 4H
WHALE SIGNAL 4H BASED ON VOLUME CHANGE AND MOVING AVERAGE
This script aims to highlight potential whale signals on the 4-hour timeframe by analyzing volume changes, and it provides options for customization through input parameters. Whale signals are then displayed on the chart with different colors for the last hit and the previous hits. The Detector parameter adds flexibility to consider neighboring bars in the detection process, Let's break down the key components:
1/The script defines input parameters that users can customize:
-VCH (Volume Change on 4H candle) with a default value of 3, 3 times the MA Value.
-Length_240 (Moving Average length for the last 21 bars on the 4-hour timeframe).
-Detector (a boolean parameter to enable or disable whale detection in the previous or next bar).
2/Logic Section:
The script defines a function bar(hit) to convert the bar index based on the timeframe.
It calculates the Volume Change (whale signal) by comparing the current volume with a threshold (VCH * vma).
The Detector parameter allows for flexibility in detecting whale signals in neighboring bars.
3/ Plotting Section:
The script defines a function is_whale() to check if there is a whale signal and if it occurred in the last three bars.
It uses the plot function to display whale signals on the chart with different colors and offsets.

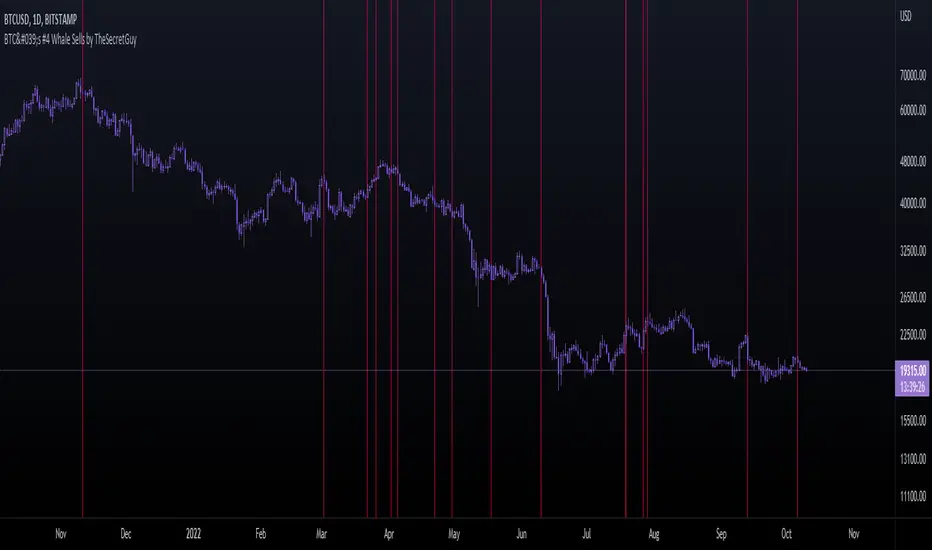
BTC's #4 Whale Sells [TheSecretGuy]Hello there !
I have been tracking BTC richests wallets for some time - and one of them seems to be aligning its sells pretty well with what the market is about to do.
BTC's Whale #3 (now Whale #4) has been selling his BTC in very crutial moments - therefore I felt that converting this into an indicator will give us a pretty visual feedback of what that Whale expects to happen at a given point.
In order to do that, I have listed manually all of his sells (dates) until today and placed a vertical line on the chart on each of these dates.
This sadly can't be automated as Pinescript language doesn't allow to reach outter data - I'd need to update this manually.
Hope this helps you a bit, Cheers!
Retail Bomber MK1Handydandy tool to wait for the whales to wake up and start trading.
Each Zone has a schedule (call it market session) and pumps and dumps can be seen on specific times.
And for each zone you can either Highlight the background of just the start time, the whole session, or color the bars instead of changing the background.
Each zone is already set for a specific market open (session open): ASIA, UK, SYDNEY, NY + other 2 extra zones.
All of this is customisable 🙂
To set the time configuration, it goes like this:
1230:1330:1234567
1230:1330 is the period of time you want to study
1234567 are the days of the week, where 1=Sunday...And you fall on 7=Saturday
Example: If we want to study the same ranges from Monday to Friday only, it goes like: 1230 1330:23456
Colors can be editable
Labels for each session can be changed too.
Still testing it.

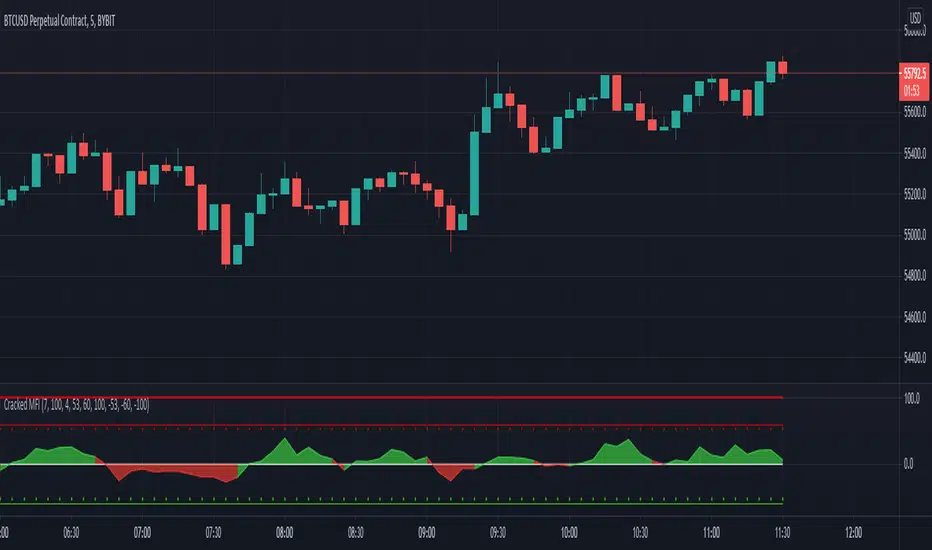
Cracked MFIThis is my leading MFI that I use because it tends to lead and not lag.
The Bar length is where you can adjust the average based on the amount of bars.
The MFI Multiplier is used for calculating the money flow by multiplying by the volume.
The Y Position is where the sprite is on the Y axis (vertical) of the stage. The value gets higher or lower depending on how far up on the Stage the sprite is.
Hope this helps!
Cracked Entry & ExitThis just helps give you a good signal that it could be a good place for an entry. Please note that this indicator is made for scalping. This means you need to be shaving/skimming/taking profits frequently. I have found that when this signal starts to appear that is when I zoom out on larger time frames to see if it is in fact a good time to go in. I typically set a very tight stoploss and/or move it up into the green quickly. Hope this helps.

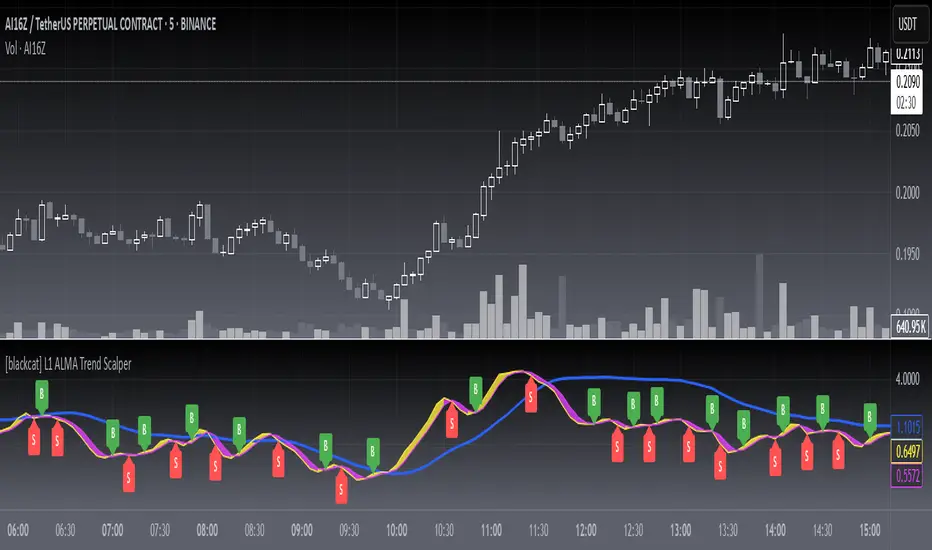
[blackcat] L1 ALMA Trend ScalperLevel: 1
Background
The Arnaud Legoux Moving Average (ALMA) indicator was recently added to the family of moving averages. It was developed in 2009 by Arnaud Legous and Dimitrios Kouzis Loukas. Since then, this indicator has gained huge popularity among traders.
ALMA works like any moving average work. However, the calculation of the ALMA is more perfect compared to the moving average. This indicator has minimal lag which makes it a leading indicator in the market. While the SMA, MA, EMA and SMMA signal line is often delayed. The ALMA was designed to address the two critical disadvantages of traditional moving averages, responsiveness and smoothness.
Function
L1 ALMA Trend Scalper is simple but powerful. This indicator makes full use of ALMA's rapid response advantage to provide buying and selling points by winding and crossing two short-term moving averages. A mid-term moving average can provide relatively effective support and pressure. Finally, the function of whale pump detection is simply realized through the characteristics of the moving average.
Key Signal
trendline --> mid term moving average for support and resistance
tradingline ---> basic element for fast line and slow line
fastline ---> fast line for short term
slowline --> slow line for short term
pumpstart ---> simple whale pump zone detection
Pros and Cons
Pros:
1. Simple but clear to see the trend reversals
2. Aux middle term moving average help just whether it is a true or fake breakout
Cons:
1. No advanced trading skill is incorporated
2. Need improvements on sideways.
Remarks
Just be simple but powerful
Readme
In real life, I am a prolific inventor. I have successfully applied for more than 60 international and regional patents in the past 12 years. But in the past two years or so, I have tried to transfer my creativity to the development of trading strategies. Tradingview is the ideal platform for me. I am selecting and contributing some of the hundreds of scripts to publish in Tradingview community. Welcome everyone to interact with me to discuss these interesting pine scripts.
The scripts posted are categorized into 5 levels according to my efforts or manhours put into these works.
Level 1 : interesting script snippets or distinctive improvement from classic indicators or strategy. Level 1 scripts can usually appear in more complex indicators as a function module or element.
Level 2 : composite indicator/strategy. By selecting or combining several independent or dependent functions or sub indicators in proper way, the composite script exhibits a resonance phenomenon which can filter out noise or fake trading signal to enhance trading confidence level.
Level 3 : comprehensive indicator/strategy. They are simple trading systems based on my strategies. They are commonly containing several or all of entry signal, close signal, stop loss, take profit, re-entry, risk management, and position sizing techniques. Even some interesting fundamental and mass psychological aspects are incorporated.
Level 4 : script snippets or functions that do not disclose source code. Interesting element that can reveal market laws and work as raw material for indicators and strategies. If you find Level 1~2 scripts are helpful, Level 4 is a private version that took me far more efforts to develop.
Level 5 : indicator/strategy that do not disclose source code. private version of Level 3 script with my accumulated script processing skills or a large number of custom functions. I had a private function library built in past two years. Level 5 scripts use many of them to achieve private trading strategy.
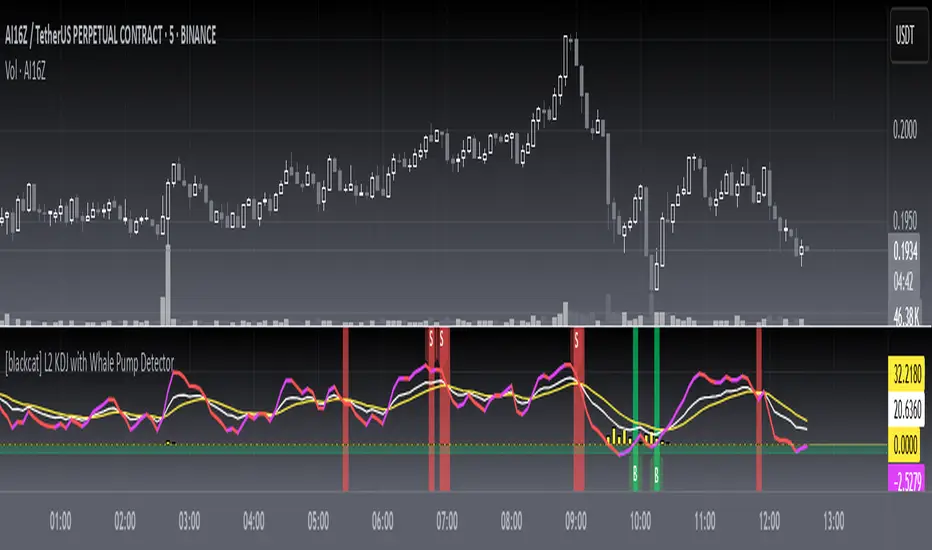
L2 KDJ with Whale Pump DetectorLevel: 2
Background
One of the biggest differences between cryptocurrency and traditional financial markets is that cryptocurrency is based on blockchain technology. Individual investors can discover the direction of the flow of large funds through on-chain transfers. These large funds are often referred to as Whale. Whale can have a significant impact on the price movements of cryptocurrencies, especially Bitcoin . Therefore, how to monitor Whale trends is of great significance both in terms of fundamentals and technical aspects.
The KDJ oscillator display consists of 3 lines (K, D and J - hence the name of the display) and 2 levels. K and D are the same lines you see when using the stochastic oscillator. The J line in turn represents the deviation of the D value from the K value. The convergence of these lines indicates new trading opportunities. Just like the Stochastic Oscillator, oversold and overbought levels correspond to the times when the trend is likely to reverse.
Function
L2 KDJ with Whale Pump Detector is a composite indicator that combines both KDJ and Whale Pump Detector. By virtue of this, fake signal of KDJ can be filtered out to some degree.
Key Signal
whalepump --> whale buy behavior will be detected and displayed in yellow histograms
k --> k value of a stochastic oscillator
d --> d value of a stochastic oscillator
j --> the deviation of the d value from the d value of a stochastic oscillator
Pros and Cons
Pros:
1. filter out KDJ fake signal by introducing whale buy/pump detector
2. J value can be used to detect overbought and oversold regions
Cons:
1. It works better in small time frame and sideways. Extreme long or short conditions may cause KDJ staturate.
2. It can only indicate in current time frame, larger time frame trend info is missing.
Remarks
Composite KDJ+Whale Pump Detector. Works fine in 15mins time frame.
Readme
In real life, I am a prolific inventor. I have successfully applied for more than 60 international and regional patents in the past 12 years. But in the past two years or so, I have tried to transfer my creativity to the development of trading strategies. Tradingview is the ideal platform for me. I am selecting and contributing some of the hundreds of scripts to publish in Tradingview community. Welcome everyone to interact with me to discuss these interesting pine scripts.
The scripts posted are categorized into 5 levels according to my efforts or manhours put into these works.
Level 1 : interesting script snippets or distinctive improvement from classic indicators or strategy. Level 1 scripts can usually appear in more complex indicators as a function module or element.
Level 2 : composite indicator/strategy. By selecting or combining several independent or dependent functions or sub indicators in proper way, the composite script exhibits a resonance phenomenon which can filter out noise or fake trading signal to enhance trading confidence level.
Level 3 : comprehensive indicator/strategy. They are simple trading systems based on my strategies. They are commonly containing several or all of entry signal, close signal, stop loss, take profit, re-entry, risk management, and position sizing techniques. Even some interesting fundamental and mass psychological aspects are incorporated.
Level 4 : script snippets or functions that do not disclose source code. Interesting element that can reveal market laws and work as raw material for indicators and strategies. If you find Level 1~2 scripts are helpful, Level 4 is a private version that took me far more efforts to develop.
Level 5 : indicator/strategy that do not disclose source code. private version of Level 3 script with my accumulated script processing skills or a large number of custom functions. I had a private function library built in past two years. Level 5 scripts use many of them to achieve private trading strategy.
Showtime PointsThe indicator is an indicator created by making use of the features of 5 original and RSI indicators.
It shows signals that the coins in the accumulation period in the Altcoin market have become suitable for the pump with volume and other factors.
It is observed that it works quite successfully when supported by technical analysis.
If the scoring is below 60, it indicates that it is not ready for the pump. After 66 points, only the "high" signal appears instead of points. With the arrival of points, the stop points must be determined correctly. It should be considered that the accumulation period is long.
How to get access?
Please click on the link in the signature for getting access.

Whale alertThe purpose of this indicator is to detect when whales are around and draw a vertical line on hourly chart. But how do we detect them? By analyzing behavior. Usually whales scale in/out of positions a few days in a row and they also trade at the same time every day, because they are whales and don't care, they can move then market whenever they want.
Based on the above assumptions, this indicator checks:
1. hourly volume, it has to be 3 x the MA(volume) for last 14 days (of course 3 and 14 are configurable in settings and need to be tuned individually for each pair)
2. the same hour of the day (10am UTC) for the past 3 days looking for #1 condition.
We can easily see on chart that a whale was present at 10am UTC for two days in a row, they went short yesterday and long today (May 6th). Also, we can zoom out and see the same whale traded at 10am many times in the past.
Can't wait for 10am tomorrow and watch out, whales are around :)

Whale Trading SystemThis script is an advanced version of the distributional blocks script.
In distributional buys and sells:
I used a high - low cloud filter, which makes it more prudent to sell the next sell higher for sells and to buy the next purchase lower for buys.
I also used the Stochastic Money Flow Index function because it also uses volume to separate regions.
The long period is 52 weeks, which is equal to one year,
The short period is one-fourth of its value, which is equal to a financial quarter.
Then the values calculated with these periods are calculated by stochastic - rsi logic within the function, giving us two averages and separating the regions according to crossovers and crossunders .
In buys and sales, the higher your next distributional position size makes your profit more .
In the old system, there was a confusion as it was not divided into zones.
Because we divide into zones here, zone changes are the last stop to free up existing positions, and you must reopen each time you change zones.
And I changed standard distribution days, depending on the price change and the histogram, as StochMFI also took into account the volume.
In this way, there is sustainability.
I am also sharing my educational idea that explains the logic of this system in more detail :
Now that we have been divided into regions, a maximum of 10 pieces will suffice us.
And the regional shifts will allow us to sell and buy all of our position size, and now we will feel much more comfortable.
The most timeframe I find most accurate are the weekly bars.
Even in the example, we see how we have benefited from the sharp drop in bitcoin, while the price is falling, and we have lowered the average with higher-weight purchases than the previous one.
In both buys and sales here, both the histogram intensities and the average of the purchases you have reduced with the transactions, or the earnings you have increased with the sales, guide you.
In areas with high volatility ,if we adjust our positions properly, even if we follow the changes in the region, we will get rid of those situations with few wounds and we will surely catch the trend!
NOTE : Crossover/crossunder and distributional buy/sell alerts added.
Best regards , Noldo.

WhaleExperimental #Whale Indicator for those Fish That like to become a WHALE 🐳
Base on Price Action Volatility vs Volume (V vs V)

whale finder work very good on BTC 4hour chart
detect the hidden moves in the chart
it give a sell and buy signals and put it on the chart
do not get last candle signal till it close
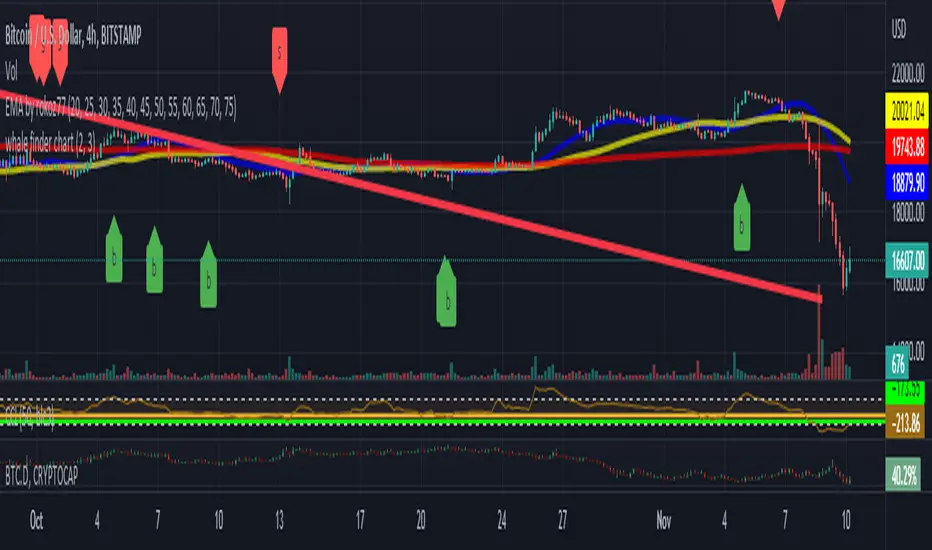
Librehash Aggressive M.A. ForecastThis indicator is fairly simple in nature, but there's a lot more to it than meets the eye.
The control panel is set up so that you're able to customize the type of MA indicator that you would like to use (HullsMA, SMA, EMA, WMA, VWMA, Double EMA, etc.)
In addition, traders can also tweak the signal producer so that it fits their given needs on a chart if they feel that the settings are not optimized to produce (but, from what we backtested, we imagine that this won't be a huge necessity).
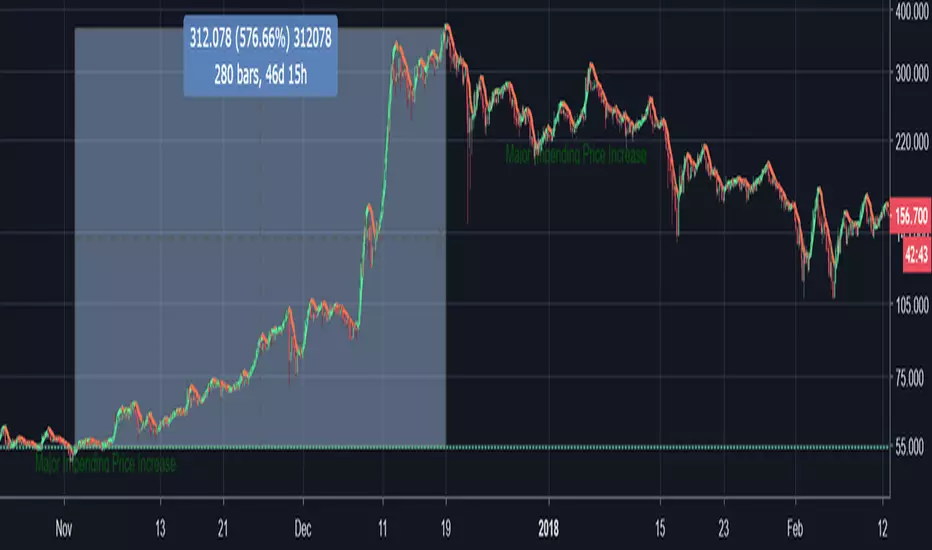
However, beyond all of this, the biggest feature of this indicator is the fact that it is designed to catch MONSTER gains, hence the name:
Whale Detector System
Below, are two potent examples of this indicator's whale detection capabilities.
In the picture above, we can catch the indicator warning us of a MASSIVE sell off in price. And it appears that it was right.
And here, we can see the indicator warn us of a MAJOR increase in price - to the tune of 600%+ actually.
In fact, it appears that it was able to anticipate the entire bull run, which is almost unprecedented in terms of indicator predictive capabilities go.
If you're interested in this indicator, please do not hesitate to contact me at your earliest convenience, and I will arrange for you to purchase the indicator.
Thank you.