Apple Inc. (AAPL) 4H – NASDAQ chart:
Here’s a detailed read of the setup my drawn 👇
---
🧭 Chart Overview
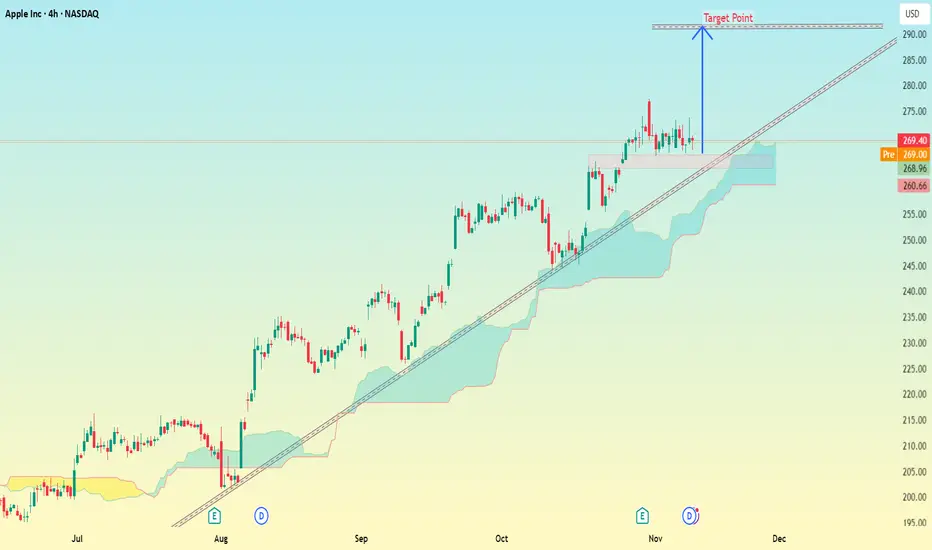
Current Price: ≈ $269.4
Trend: Strong uptrend (price holding above Ichimoku cloud & rising trendline)
Support Zone: Around $265 – $266 (where price retested the trendline + cloud)
Resistance/Target Box: Marked on my chart as Target Point near the upper trendline.
---
🎯 Target Analysis
My blue arrow points to a resistance zone near the top of the ascending channel.
The Target Point zone is around $285 – $288.
→ That’s roughly +6% to +7% upside from the current level.
---
📈 Summary
Type Level (USD) Notes
Entry (current) 269–270 Price retesting support/trendline
Target 285 – 288 Channel top / bullish target
Stop-loss (recommended) 260 – 261 Below trendline & Ichimoku cloud
---
⚠ Notes
If AAPL closes below $260, this trendline support breaks, and momentum may shift bearish.
But as long as it stays above $265, it looks strong toward $285+.
Watch volume — a breakout above $275 with volume would confirm move to target.
Here’s a detailed read of the setup my drawn 👇
---
🧭 Chart Overview
Current Price: ≈ $269.4
Trend: Strong uptrend (price holding above Ichimoku cloud & rising trendline)
Support Zone: Around $265 – $266 (where price retested the trendline + cloud)
Resistance/Target Box: Marked on my chart as Target Point near the upper trendline.
---
🎯 Target Analysis
My blue arrow points to a resistance zone near the top of the ascending channel.
The Target Point zone is around $285 – $288.
→ That’s roughly +6% to +7% upside from the current level.
---
📈 Summary
Type Level (USD) Notes
Entry (current) 269–270 Price retesting support/trendline
Target 285 – 288 Channel top / bullish target
Stop-loss (recommended) 260 – 261 Below trendline & Ichimoku cloud
---
⚠ Notes
If AAPL closes below $260, this trendline support breaks, and momentum may shift bearish.
But as long as it stays above $265, it looks strong toward $285+.
Watch volume — a breakout above $275 with volume would confirm move to target.
Giao dịch đang hoạt động
active 📲 Join telegram channel free .
t.me/addlist/dg3uSwzkMSplNjFk
Forex, Gold & Crypto Signals with detailed analysis & get consistent results.
t.me/addlist/dg3uSwzkMSplNjFk
Gold Signal's with proper TP & SL for high profit opportunities.
t.me/addlist/dg3uSwzkMSplNjFk
Forex, Gold & Crypto Signals with detailed analysis & get consistent results.
t.me/addlist/dg3uSwzkMSplNjFk
Gold Signal's with proper TP & SL for high profit opportunities.
Bài đăng liên quan
Thông báo miễn trừ trách nhiệm
The information and publications are not meant to be, and do not constitute, financial, investment, trading, or other types of advice or recommendations supplied or endorsed by TradingView. Read more in the Terms of Use.
📲 Join telegram channel free .
t.me/addlist/dg3uSwzkMSplNjFk
Forex, Gold & Crypto Signals with detailed analysis & get consistent results.
t.me/addlist/dg3uSwzkMSplNjFk
Gold Signal's with proper TP & SL for high profit opportunities.
t.me/addlist/dg3uSwzkMSplNjFk
Forex, Gold & Crypto Signals with detailed analysis & get consistent results.
t.me/addlist/dg3uSwzkMSplNjFk
Gold Signal's with proper TP & SL for high profit opportunities.
Bài đăng liên quan
Thông báo miễn trừ trách nhiệm
The information and publications are not meant to be, and do not constitute, financial, investment, trading, or other types of advice or recommendations supplied or endorsed by TradingView. Read more in the Terms of Use.