--
### 📊 **Technical Analysis Summary:**
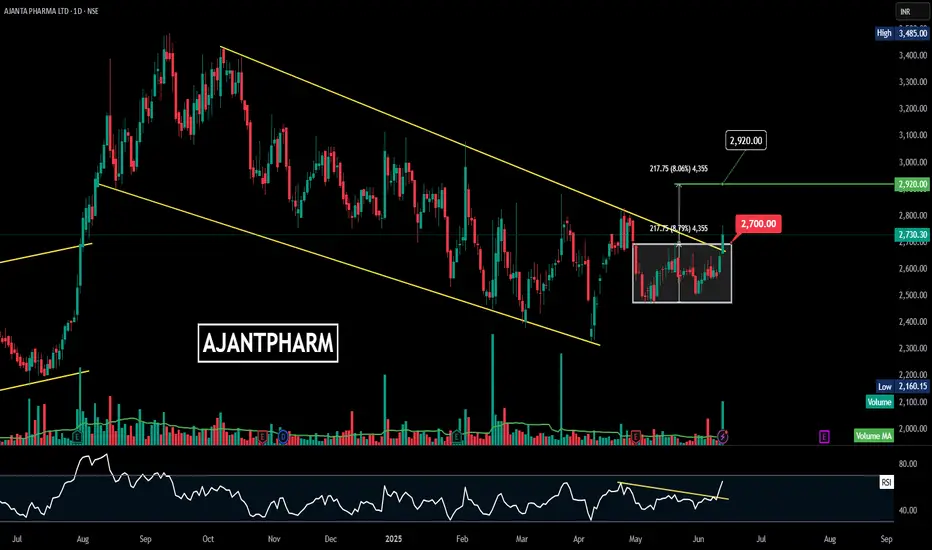
#### 🔹 **Chart Pattern:**
* **Falling Channel** (Yellow trendlines): Price has been respecting a downward-sloping channel since mid-2023.
* Recently, the price **broke out above the upper trendline**, indicating a **potential trend reversal**.
#### 🔹 **Consolidation Zone:**
* There was a **rectangle consolidation** (boxed region) between ₹2,480 and ₹2,700.
* The breakout above ₹2,700 confirms bullish intent and may act as a new support.
#### 🔹 **Breakout Target:**
* The measured move from the box is **approx. ₹217.75**.
* Adding to the breakout level gives a projected **target of ₹2,920**.
#### 🔹 **Volume:**
* **Volume spike** on breakout day = strong confirmation of the breakout.
#### 🔹 **RSI (Relative Strength Index):**
* RSI broke out of its own **downtrend resistance**.
* Now trading above 60 = bullish momentum building up.
---
### 🎯 **Levels to Watch:**
| Type | Price (₹) |
| ----------------------- | ----------- |
| **Breakout Point** | 2,700 |
| **Current Price** | 2,730 |
| **Target** | 2,920 |
| **Support Zone** | 2,480–2,700 |
| **Volume Confirmation** | Yes ✅ |
---
### ✅ **Conclusion:**
Ajanta Pharma is showing strong bullish signs:
* Breakout from falling channel
* Volume-backed move
* RSI confirmation
**As long as the price holds above ₹2,700**, the upside towards ₹2,920 remains intact.
### 📊 **Technical Analysis Summary:**
#### 🔹 **Chart Pattern:**
* **Falling Channel** (Yellow trendlines): Price has been respecting a downward-sloping channel since mid-2023.
* Recently, the price **broke out above the upper trendline**, indicating a **potential trend reversal**.
#### 🔹 **Consolidation Zone:**
* There was a **rectangle consolidation** (boxed region) between ₹2,480 and ₹2,700.
* The breakout above ₹2,700 confirms bullish intent and may act as a new support.
#### 🔹 **Breakout Target:**
* The measured move from the box is **approx. ₹217.75**.
* Adding to the breakout level gives a projected **target of ₹2,920**.
#### 🔹 **Volume:**
* **Volume spike** on breakout day = strong confirmation of the breakout.
#### 🔹 **RSI (Relative Strength Index):**
* RSI broke out of its own **downtrend resistance**.
* Now trading above 60 = bullish momentum building up.
---
### 🎯 **Levels to Watch:**
| Type | Price (₹) |
| ----------------------- | ----------- |
| **Breakout Point** | 2,700 |
| **Current Price** | 2,730 |
| **Target** | 2,920 |
| **Support Zone** | 2,480–2,700 |
| **Volume Confirmation** | Yes ✅ |
---
### ✅ **Conclusion:**
Ajanta Pharma is showing strong bullish signs:
* Breakout from falling channel
* Volume-backed move
* RSI confirmation
**As long as the price holds above ₹2,700**, the upside towards ₹2,920 remains intact.
Thông báo miễn trừ trách nhiệm
Thông tin và ấn phẩm không có nghĩa là và không cấu thành, tài chính, đầu tư, kinh doanh, hoặc các loại lời khuyên hoặc khuyến nghị khác được cung cấp hoặc xác nhận bởi TradingView. Đọc thêm trong Điều khoản sử dụng.
Thông báo miễn trừ trách nhiệm
Thông tin và ấn phẩm không có nghĩa là và không cấu thành, tài chính, đầu tư, kinh doanh, hoặc các loại lời khuyên hoặc khuyến nghị khác được cung cấp hoặc xác nhận bởi TradingView. Đọc thêm trong Điều khoản sử dụng.