Stock Analysis - step by step for Algoquant Fintech Ltd.
Chart & Price Action Analysis (Weekly Chart)-:
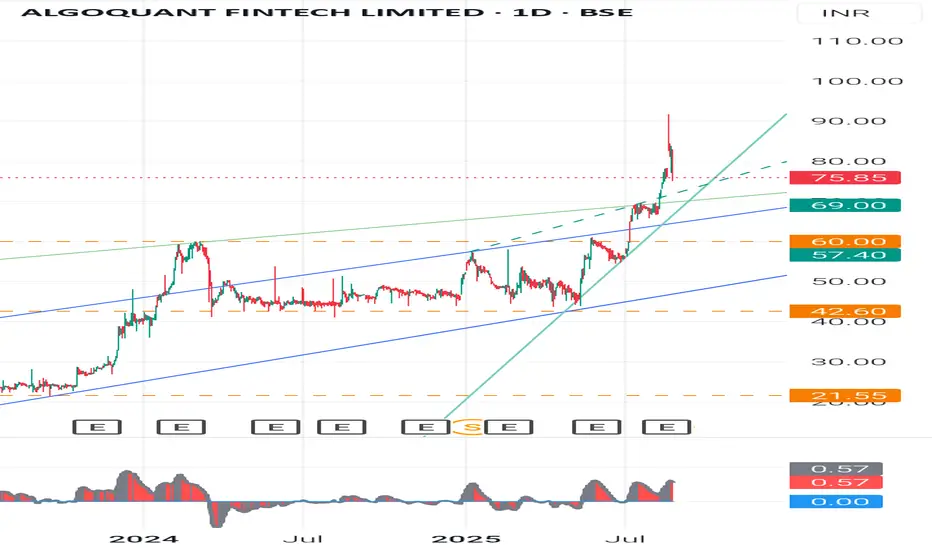
-Current Price: 78.95 (-3.84%)
+Recent Move: Stock gave a strong breakout above its long consolidation channel ( 42- 69).
-Candlestick: The latest candle is a long wick candle after a strong breakout - This signals profit booking after a sharp rally.
- Support Levels
69 - Recent breakout retest zone
60 - Strong support from previous swing highs
42.6 - Major base support (long-term)
- Resistance Levels
85- 88 - Immediate resistance (due to long upper wick supply)
100+ - Psychological round level
120 - Next major target if momentum sustains
🕯️ Candlestick & Swing Analysis
Pattern: Breakout candle with long wick - suggests short-term profit booking, but trend remains positive.
Swing Trend: Stock formed higher highs & higher lows since mid-2023, a sign of strong uptrend.
Risk: If it falls below 69 on weekly closing, trend may weaken.
- Fundamental Comparison (with Fintech peers like Infibeam Avenues, IndiaMart, and small fintech players)
Metric Algoquant Fintech Infibeam Avenues IndiaMart Intermesh
P/E Ratio Very High (Loss-making / low EPS stage) -38x -45x
Revenue Growth Very high (small base effect) Moderate Stable
Debt Low Low Very Low
Business Stage Emerging (High growth, high risk) Mid-sized, stable Established, B2B stronghold
👉 Learning: Algoquant is in an early stage compared to peers - higher growth potential but also higher risk.
📘 Basic Learnings for Students (Investment Education)
1. Candlestick Learning - Long upper wicks after breakout = profit booking - watch for retest of breakout levels.
2. Swing Analysis - Trend is up as long as higher highs-higher lows structure is maintained.
3. Chart Pattern - Breakout from long channel = momentum can continue if volumes sustain.
4. Fundamental Insight - Always compare with industry peers on P/E, revenue growth, debt, margins.
5. Risk Management - In emerging companies, volatility is high. Always keep a stop-loss.
⚠️ Disclaimer
This analysis is for educational purposes only. It is not investment advice. Stock markets are subject to risks. Please do your own research (DYOR) or consult a SEBI-registered advisor before investing.
#Algoquant #FintechStocks #StockMarketIndia #TechnicalAnalysis #CandlestickPatterns #SwingTrading #InvestingForBeginners #FundamentalAnalysis #StockMarketEducation #DYOR
Chart & Price Action Analysis (Weekly Chart)-:
-Current Price: 78.95 (-3.84%)
+Recent Move: Stock gave a strong breakout above its long consolidation channel ( 42- 69).
-Candlestick: The latest candle is a long wick candle after a strong breakout - This signals profit booking after a sharp rally.
- Support Levels
69 - Recent breakout retest zone
60 - Strong support from previous swing highs
42.6 - Major base support (long-term)
- Resistance Levels
85- 88 - Immediate resistance (due to long upper wick supply)
100+ - Psychological round level
120 - Next major target if momentum sustains
🕯️ Candlestick & Swing Analysis
Pattern: Breakout candle with long wick - suggests short-term profit booking, but trend remains positive.
Swing Trend: Stock formed higher highs & higher lows since mid-2023, a sign of strong uptrend.
Risk: If it falls below 69 on weekly closing, trend may weaken.
- Fundamental Comparison (with Fintech peers like Infibeam Avenues, IndiaMart, and small fintech players)
Metric Algoquant Fintech Infibeam Avenues IndiaMart Intermesh
P/E Ratio Very High (Loss-making / low EPS stage) -38x -45x
Revenue Growth Very high (small base effect) Moderate Stable
Debt Low Low Very Low
Business Stage Emerging (High growth, high risk) Mid-sized, stable Established, B2B stronghold
👉 Learning: Algoquant is in an early stage compared to peers - higher growth potential but also higher risk.
📘 Basic Learnings for Students (Investment Education)
1. Candlestick Learning - Long upper wicks after breakout = profit booking - watch for retest of breakout levels.
2. Swing Analysis - Trend is up as long as higher highs-higher lows structure is maintained.
3. Chart Pattern - Breakout from long channel = momentum can continue if volumes sustain.
4. Fundamental Insight - Always compare with industry peers on P/E, revenue growth, debt, margins.
5. Risk Management - In emerging companies, volatility is high. Always keep a stop-loss.
⚠️ Disclaimer
This analysis is for educational purposes only. It is not investment advice. Stock markets are subject to risks. Please do your own research (DYOR) or consult a SEBI-registered advisor before investing.
#Algoquant #FintechStocks #StockMarketIndia #TechnicalAnalysis #CandlestickPatterns #SwingTrading #InvestingForBeginners #FundamentalAnalysis #StockMarketEducation #DYOR
Bài đăng liên quan
Thông báo miễn trừ trách nhiệm
Thông tin và các ấn phẩm này không nhằm mục đích, và không cấu thành, lời khuyên hoặc khuyến nghị về tài chính, đầu tư, giao dịch hay các loại khác do TradingView cung cấp hoặc xác nhận. Đọc thêm tại Điều khoản Sử dụng.
Bài đăng liên quan
Thông báo miễn trừ trách nhiệm
Thông tin và các ấn phẩm này không nhằm mục đích, và không cấu thành, lời khuyên hoặc khuyến nghị về tài chính, đầu tư, giao dịch hay các loại khác do TradingView cung cấp hoặc xác nhận. Đọc thêm tại Điều khoản Sử dụng.