Giá xuống
AMD at a Crossroads: Deep Correction or a Launch to New Highs?
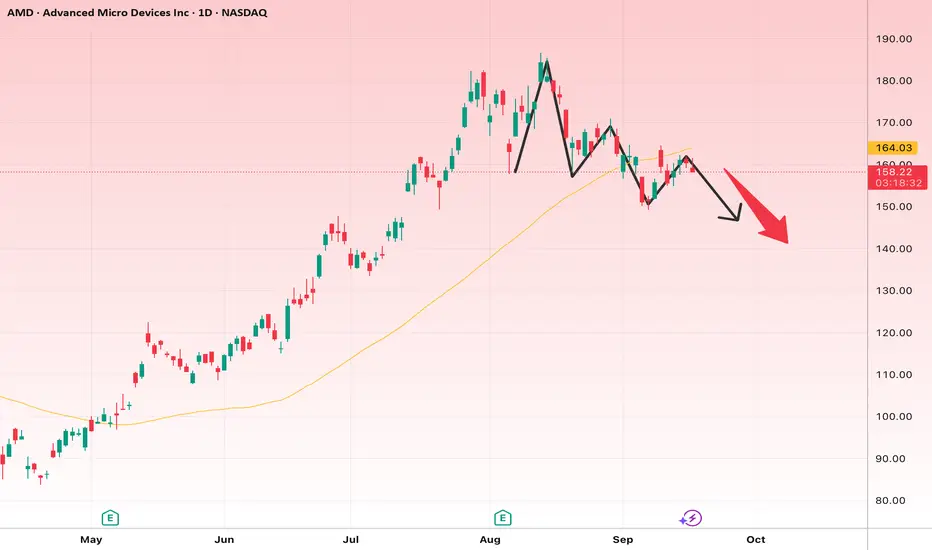
🔎 Technical Analysis (Based on the Chart)
Recent Trend:
After a sharp rally from around $100 to nearly $180, the stock entered a corrective phase.
A series of lower highs and lower lows suggests the start of a short-term downtrend.
Price is now trading below the 50-day moving average (yellow line), which is a bearish signal.
Patterns & Price Action:
The chart shows a possible Head & Shoulders structure or at least a similar bearish formation.
The red arrow indicates potential downside movement toward lower levels.
📉 Short-Term Outlook (2–6 weeks)
Bias: Bearish
Targets:
First target: $150
Second target: $140 (if support breaks)
Stop-loss: A confirmed close above $166–168 (back above the moving average and resistance).
📈 Long-Term Outlook (3–6 months)
If the current correction extends, the stock could dip toward $135–140, then potentially start a new bullish phase.
Upside Targets:
First target: $180 retest
Second target: $200–210 if the historical high breaks
Stop-loss (long-term): A confirmed close below $135 (break of major support, trend reversal to bearish).
✅ Summary:
Short-term: Likely correction toward $150–140.
Long-term: As long as $135 holds, bullish targets toward $200 remain valid.
Thông báo miễn trừ trách nhiệm
Thông tin và ấn phẩm không có nghĩa là và không cấu thành, tài chính, đầu tư, kinh doanh, hoặc các loại lời khuyên hoặc khuyến nghị khác được cung cấp hoặc xác nhận bởi TradingView. Đọc thêm trong Điều khoản sử dụng.
Thông báo miễn trừ trách nhiệm
Thông tin và ấn phẩm không có nghĩa là và không cấu thành, tài chính, đầu tư, kinh doanh, hoặc các loại lời khuyên hoặc khuyến nghị khác được cung cấp hoặc xác nhận bởi TradingView. Đọc thêm trong Điều khoản sử dụng.