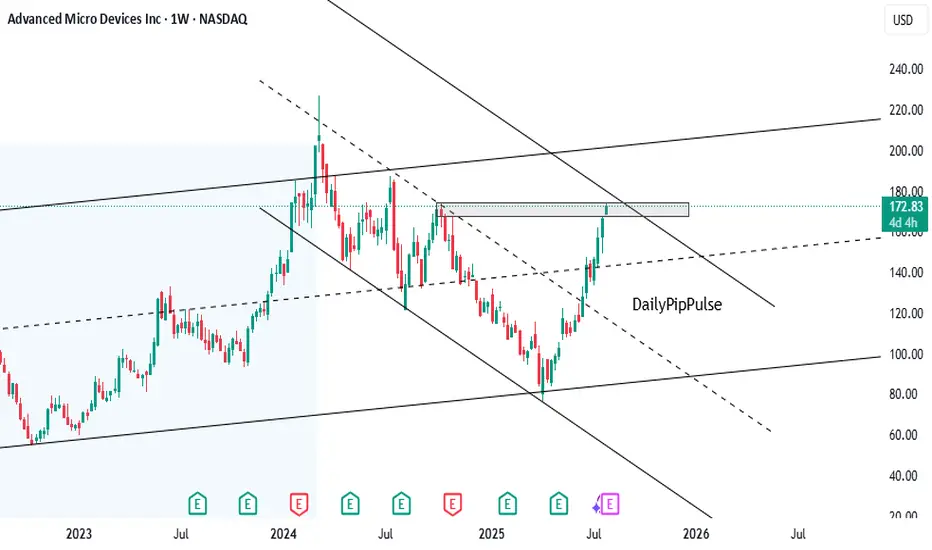
the weekly price action of Advanced Micro Devices Inc (AMD):The stock is trading near a critical resistance zone marked with a rectangular box just below $180.In the past, this area acted as a rejection point, evident from prior pullbacks when the stock neared these levels.
The chart reflects a larger declining channel. Current price action shows AMD approaching the upper boundary of this channel, which may act as dynamic resistance.
If AMD breaks above the $180 resistance convincingly, there’s potential for the stock to aim for higher targets, such as the next major zone ($240).
Failure to break above $180 may lead to a retest of lower levels, potentially near $140 or the breakout zone ($100-$120).
Thông báo miễn trừ trách nhiệm
Thông tin và các ấn phẩm này không nhằm mục đích, và không cấu thành, lời khuyên hoặc khuyến nghị về tài chính, đầu tư, giao dịch hay các loại khác do TradingView cung cấp hoặc xác nhận. Đọc thêm tại Điều khoản Sử dụng.
Thông báo miễn trừ trách nhiệm
Thông tin và các ấn phẩm này không nhằm mục đích, và không cấu thành, lời khuyên hoặc khuyến nghị về tài chính, đầu tư, giao dịch hay các loại khác do TradingView cung cấp hoặc xác nhận. Đọc thêm tại Điều khoản Sử dụng.