Intraday Technical Outlook (15m Chart)
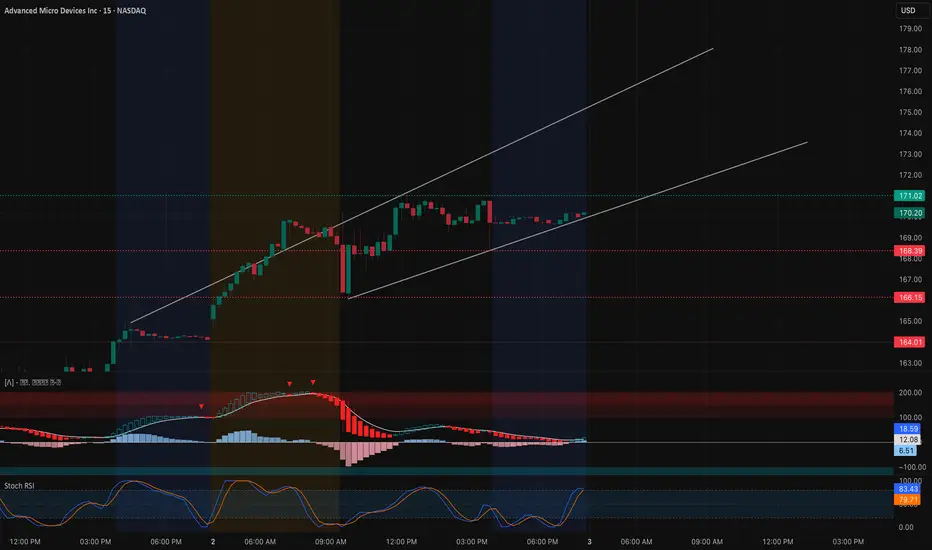
AMD ended the session at $170.20, holding steady inside a rising channel after a strong upside run. The 15-minute chart shows buyers keeping momentum intact:
* MACD: Flattening near positive territory after a pullback, signaling momentum may reload for another push.
* Stoch RSI: Back in overbought territory, showing near-term strength but risk of a cooling period.
* Key Levels: Support rests at $169–168.5, with further downside markers at $166.1 and $164.0. Resistance is at $171–172, the upper channel and prior rejection zone.
Intraday takeaway: If AMD holds above $168.5, bulls have the edge to retest $171–172. A breakdown below $168 exposes a quick fade toward $166–164.
Options Sentiment & GEX Outlook (1H Chart)

Options flow and GEX positioning highlight AMD pressing into a major resistance zone:
* Gamma Walls:
* $171–172.5: Strongest positive GEX cluster and major call wall — current ceiling.
* $167.5–165: Supportive GEX zones that should act as buffers on pullbacks.
* $157.5–155: Heavy put wall, the deeper risk level if weakness accelerates.
* Implications:
* Sustaining above $170–171 opens the door to a potential extension toward $175–177.5, though dealer hedging may pin AMD near the gamma wall if momentum slows.
* A rejection from $171 likely forces a retrace into $167.5–165 where buyers could reload.
* Volatility Context: IVR at 34.7 (below average) shows options are moderately priced, giving traders flexibility for directional calls or debit spreads.
My Thoughts & Recommendation
For Oct 3 trading, AMD is positioned right at the top of its channel and a major gamma wall.
* Intraday (scalping/trading): Stay bullish above $168.5 with eyes on $171–172 resistance. A breakout here can drive toward $175+, while a rejection means quick scalps back into $167.5–165.
* Options trading (swing/0DTE): Calls are favorable on a breakout above $171 with tight stops. If AMD fails at $171, puts toward $165 become a higher-probability play.
Bias heading into Oct 3: Bullish, but watch carefully for rejection at $171–172.
Disclaimer: This analysis is for educational purposes only and does not constitute financial advice. Always do your own research and manage risk before trading.
AMD ended the session at $170.20, holding steady inside a rising channel after a strong upside run. The 15-minute chart shows buyers keeping momentum intact:
* MACD: Flattening near positive territory after a pullback, signaling momentum may reload for another push.
* Stoch RSI: Back in overbought territory, showing near-term strength but risk of a cooling period.
* Key Levels: Support rests at $169–168.5, with further downside markers at $166.1 and $164.0. Resistance is at $171–172, the upper channel and prior rejection zone.
Intraday takeaway: If AMD holds above $168.5, bulls have the edge to retest $171–172. A breakdown below $168 exposes a quick fade toward $166–164.
Options Sentiment & GEX Outlook (1H Chart)
Options flow and GEX positioning highlight AMD pressing into a major resistance zone:
* Gamma Walls:
* $171–172.5: Strongest positive GEX cluster and major call wall — current ceiling.
* $167.5–165: Supportive GEX zones that should act as buffers on pullbacks.
* $157.5–155: Heavy put wall, the deeper risk level if weakness accelerates.
* Implications:
* Sustaining above $170–171 opens the door to a potential extension toward $175–177.5, though dealer hedging may pin AMD near the gamma wall if momentum slows.
* A rejection from $171 likely forces a retrace into $167.5–165 where buyers could reload.
* Volatility Context: IVR at 34.7 (below average) shows options are moderately priced, giving traders flexibility for directional calls or debit spreads.
My Thoughts & Recommendation
For Oct 3 trading, AMD is positioned right at the top of its channel and a major gamma wall.
* Intraday (scalping/trading): Stay bullish above $168.5 with eyes on $171–172 resistance. A breakout here can drive toward $175+, while a rejection means quick scalps back into $167.5–165.
* Options trading (swing/0DTE): Calls are favorable on a breakout above $171 with tight stops. If AMD fails at $171, puts toward $165 become a higher-probability play.
Bias heading into Oct 3: Bullish, but watch carefully for rejection at $171–172.
Disclaimer: This analysis is for educational purposes only and does not constitute financial advice. Always do your own research and manage risk before trading.
Thông báo miễn trừ trách nhiệm
Thông tin và ấn phẩm không có nghĩa là và không cấu thành, tài chính, đầu tư, kinh doanh, hoặc các loại lời khuyên hoặc khuyến nghị khác được cung cấp hoặc xác nhận bởi TradingView. Đọc thêm trong Điều khoản sử dụng.
Thông báo miễn trừ trách nhiệm
Thông tin và ấn phẩm không có nghĩa là và không cấu thành, tài chính, đầu tư, kinh doanh, hoặc các loại lời khuyên hoặc khuyến nghị khác được cung cấp hoặc xác nhận bởi TradingView. Đọc thêm trong Điều khoản sử dụng.