Cập nhật
Falling Wedge breakout.
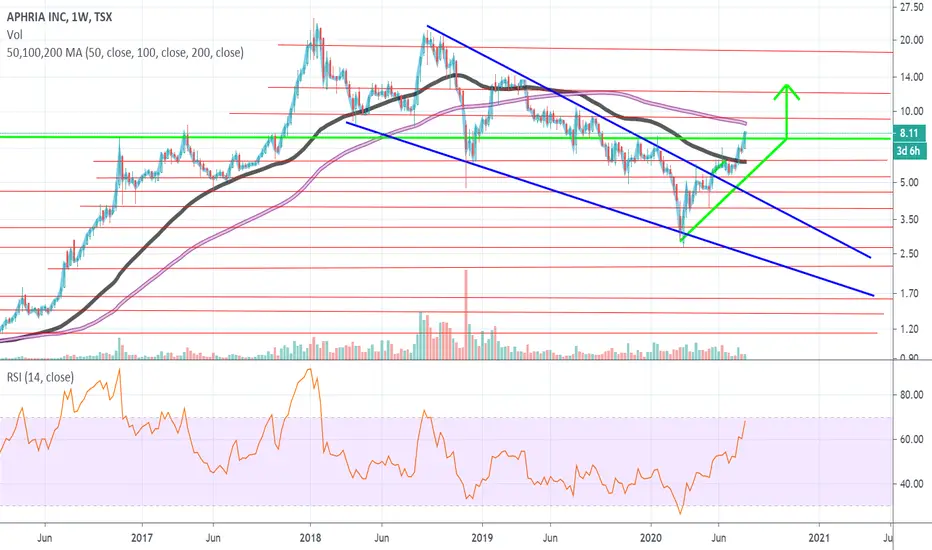
APHA has broken the downward sloping resistance of the Falling Wedge pattern outlined in blue flush to the upside, and upon back testing the area of resistance it's now turned into support.
Notice the higher high creation for the first time since 2018 ATH's?
The Green pattern in this chart is an Ascending Triangle, and upon break out of this pattern APHA has created a Macro higher high.
Any pull back in APHA would need to hold either the top of the ascending triangle upon a back test, or the upward sloping green line of support if there's to be continued bullish price action.
Ghi chú
Bullish Flag on a log scale one day & 5-day chart.
Thông báo miễn trừ trách nhiệm
Thông tin và ấn phẩm không có nghĩa là và không cấu thành, tài chính, đầu tư, kinh doanh, hoặc các loại lời khuyên hoặc khuyến nghị khác được cung cấp hoặc xác nhận bởi TradingView. Đọc thêm trong Điều khoản sử dụng.
Thông báo miễn trừ trách nhiệm
Thông tin và ấn phẩm không có nghĩa là và không cấu thành, tài chính, đầu tư, kinh doanh, hoặc các loại lời khuyên hoặc khuyến nghị khác được cung cấp hoặc xác nhận bởi TradingView. Đọc thêm trong Điều khoản sử dụng.