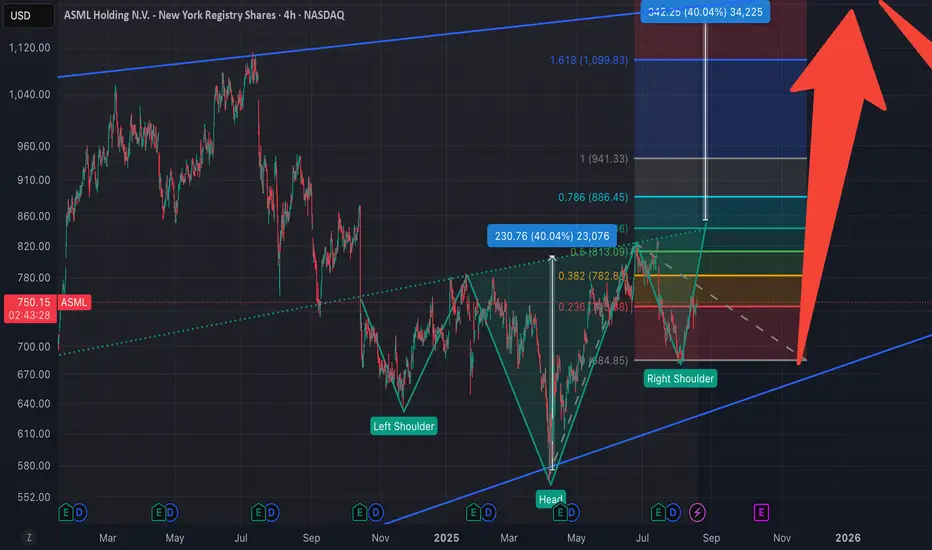
Based on the conjecture, the right shoulder is about to form. The head and shoulders bottom pattern will only complete upon a breakout above 840. If the price falls below the previous low (approximately 680), the conjecture fails. The projected rise from the head and shoulders bottom roughly aligns with the overhead resistance levels. The long-term chart pattern appears more like a wedge.
Short-term support: 68x
Short-term resistance: 84x
Target levels: 84x, 94x, 11xx
Short-term support: 68x
Short-term resistance: 84x
Target levels: 84x, 94x, 11xx
Thông báo miễn trừ trách nhiệm
Thông tin và các ấn phẩm này không nhằm mục đích, và không cấu thành, lời khuyên hoặc khuyến nghị về tài chính, đầu tư, giao dịch hay các loại khác do TradingView cung cấp hoặc xác nhận. Đọc thêm tại Điều khoản Sử dụng.
Thông báo miễn trừ trách nhiệm
Thông tin và các ấn phẩm này không nhằm mục đích, và không cấu thành, lời khuyên hoặc khuyến nghị về tài chính, đầu tư, giao dịch hay các loại khác do TradingView cung cấp hoặc xác nhận. Đọc thêm tại Điều khoản Sử dụng.