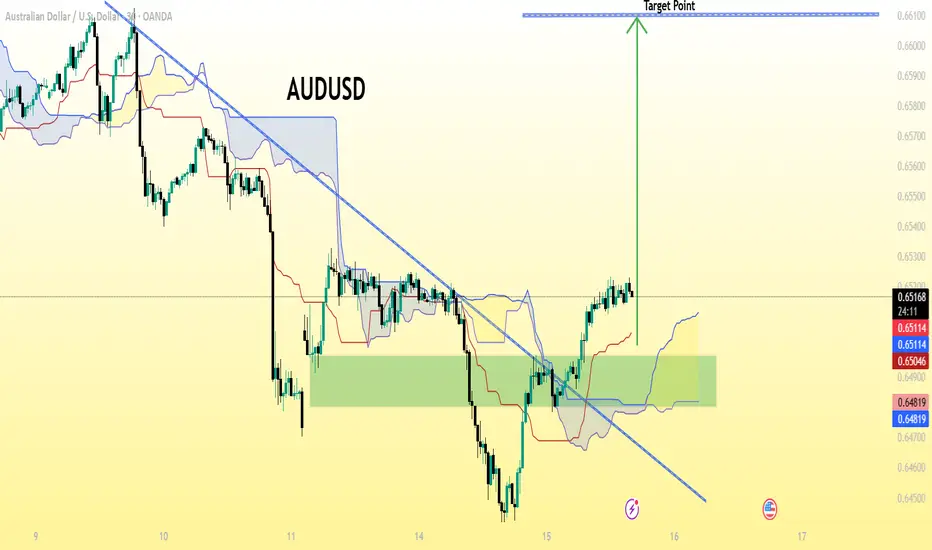
AUD/USD on a 30-minute timeframe (based on the visible labels). Let’s break it down carefully:
The pair AUD/USD is currently trading around 0.6518.
The chart shows a bullish breakout above a descending trendline.
The green zone marked looks like a demand/support zone.
A target line is already drawn near the top of the chart, labeled “Target Point”.
🔍 Based on the chart:
The “Target Point” appears to be at approximately 0.6600 – 0.6605 level.
🧭 Summary:
Type Level
Entry Zone Around 0.6500–0.6520
Target (TP) 0.6600 – 0.6605
Stop Loss (SL) Likely below the green zone, around 0.6480
💡 Interpretation:
This setup seems to be a breakout + retest trade idea where the expectation is that AUD/USD will move upward about 80–100 pips toward the 0.6600 target area.
Giao dịch đang hoạt động
active activeBài đăng liên quan
Thông báo miễn trừ trách nhiệm
Thông tin và các ấn phẩm này không nhằm mục đích, và không cấu thành, lời khuyên hoặc khuyến nghị về tài chính, đầu tư, giao dịch hay các loại khác do TradingView cung cấp hoặc xác nhận. Đọc thêm tại Điều khoản Sử dụng.
Bài đăng liên quan
Thông báo miễn trừ trách nhiệm
Thông tin và các ấn phẩm này không nhằm mục đích, và không cấu thành, lời khuyên hoặc khuyến nghị về tài chính, đầu tư, giao dịch hay các loại khác do TradingView cung cấp hoặc xác nhận. Đọc thêm tại Điều khoản Sử dụng.