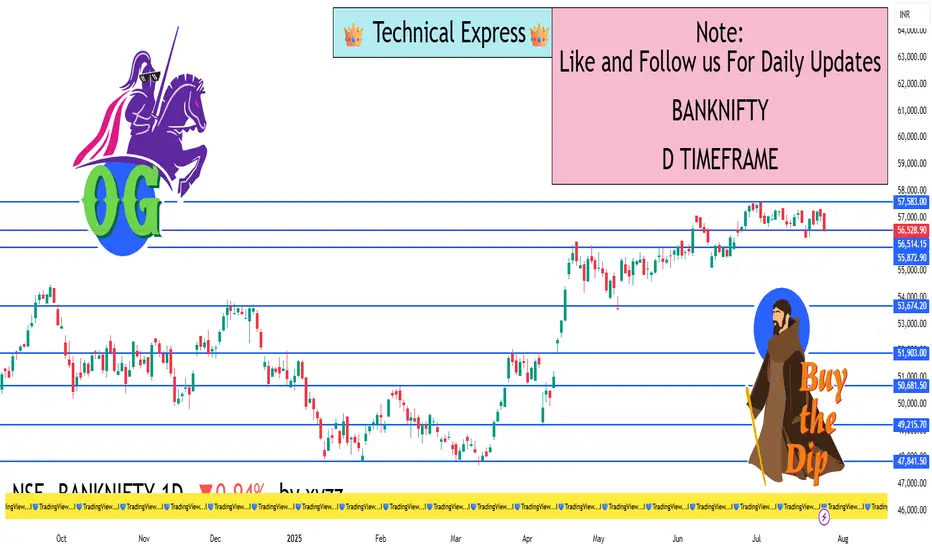
Closing Price: ₹56,528.90
Opening Price: ₹57,113.90
Day High: ₹57,170.70
Day Low: ₹56,439.40
Net Change: –₹537.15 (–0.94%)
🔹 Key Price Levels
📉 Support Zones:
Support 1 (S1): ₹56,255
Support 2 (S2): ₹55,982
Support 3 (S3): ₹55,524
Fibonacci Support Zone: ₹56,260 – ₹56,430
Camarilla Support Levels: ₹56,460 / ₹56,395 / ₹56,328
📈 Resistance Zones:
Resistance 1 (R1): ₹56,987
Resistance 2 (R2): ₹57,444
Resistance 3 (R3): ₹57,718
Fibonacci Resistance Zone: ₹56,992 – ₹57,165
Camarilla Resistance Levels: ₹56,596 / ₹56,663 / ₹56,730
🔸 Pivot Point (Central Level): ₹56,713
🔹 Trend Direction (1-Day Timeframe)
📊 Short-Term Trend: Consolidating with mild bearish pressure.
📉 Price closed below pivot point (₹56,713), signaling short-term weakness.
✅ Still within bullish structure as long as it holds above ₹55,980 – ₹56,000.
🔹 Technical Indicator Snapshot
RSI: Around 58 → Still in bullish territory, but momentum cooling.
MACD: Positive crossover, but histogram flattening — sign of range or pause.
20 EMA: Near ₹57,000 → Price is currently below this level.
50 EMA: Around ₹55,500 → Still acts as major support.
Price Action: Forming inside candles → Indicates compression/indecision.
I built a Buy & Sell Signal Indicator with 85% accuracy.
📈 Get access via DM or
WhatsApp: wa.link/d997q0
Contact - +91 76782 40962
| Email: techncialexpress@gmail.com
| Script Coder | Trader | Investor | From India
📈 Get access via DM or
WhatsApp: wa.link/d997q0
Contact - +91 76782 40962
| Email: techncialexpress@gmail.com
| Script Coder | Trader | Investor | From India
Bài đăng liên quan
Thông báo miễn trừ trách nhiệm
Thông tin và các ấn phẩm này không nhằm mục đích, và không cấu thành, lời khuyên hoặc khuyến nghị về tài chính, đầu tư, giao dịch hay các loại khác do TradingView cung cấp hoặc xác nhận. Đọc thêm tại Điều khoản Sử dụng.