Hello everyone !
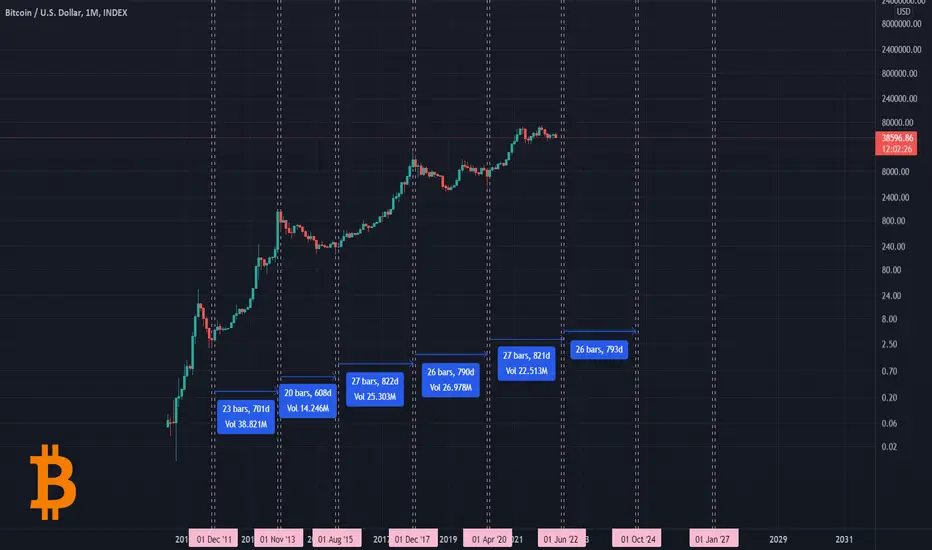
With this chart you can always know when the exact time for BTC and the whole crypto market to turn Bullish or Bearish in this repetitive cycle.
Each part consists of two lines, the first line to indicate the end of the current cycle and the second line to indicate the beginning of the new cycle.
The average is 748 Days for all cycles, And as you can see in terms of time market is too close to turn, So be aware of Bears!
----------------------------------------------------------------
Liked the idea?
Comment, Like, Follow ✌
Thông báo miễn trừ trách nhiệm
Thông tin và ấn phẩm không có nghĩa là và không cấu thành, tài chính, đầu tư, kinh doanh, hoặc các loại lời khuyên hoặc khuyến nghị khác được cung cấp hoặc xác nhận bởi TradingView. Đọc thêm trong Điều khoản sử dụng.
Thông báo miễn trừ trách nhiệm
Thông tin và ấn phẩm không có nghĩa là và không cấu thành, tài chính, đầu tư, kinh doanh, hoặc các loại lời khuyên hoặc khuyến nghị khác được cung cấp hoặc xác nhận bởi TradingView. Đọc thêm trong Điều khoản sử dụng.