📊 Technical Trend & Pattern
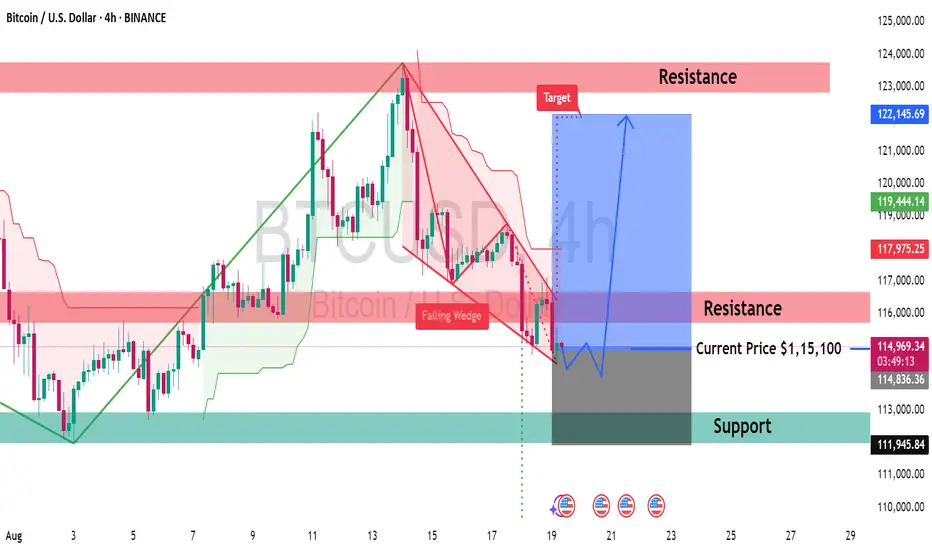
Bitcoin is currently trading around $115,100, consolidating within a falling wedge pattern, which is typically a bullish reversal setup. Price has tested the lower support zone near $111,945 and is now attempting a breakout to the upside.
🔎 Key Levels
Support: $111,945 – $113,000 zone
Immediate Resistance: $116,000
Major Resistance Zone: $122,000 – $123,000
Target (upon breakout): $122,145+
⚡ Fundamental Outlook
Market sentiment remains cautiously optimistic, with investors watching macroeconomic data and institutional flows. A confirmed breakout above resistance could trigger renewed bullish momentum toward the $122K zone.
📈 Trading Idea
As per the falling wedge breakout setup, Bitcoin has the potential to move higher if price sustains above $115K. A rejection from resistance could push it back toward support before another breakout attempt.
👍 Like this analysis & 🔔 Follow me for more trading updates and ideas.
💬 What’s your view? Drop your comments and ideas below!
Thông báo miễn trừ trách nhiệm
Thông tin và ấn phẩm không có nghĩa là và không cấu thành, tài chính, đầu tư, kinh doanh, hoặc các loại lời khuyên hoặc khuyến nghị khác được cung cấp hoặc xác nhận bởi TradingView. Đọc thêm trong Điều khoản sử dụng.
Thông báo miễn trừ trách nhiệm
Thông tin và ấn phẩm không có nghĩa là và không cấu thành, tài chính, đầu tư, kinh doanh, hoặc các loại lời khuyên hoặc khuyến nghị khác được cung cấp hoặc xác nhận bởi TradingView. Đọc thêm trong Điều khoản sử dụng.